What Is Object Diagram
A UML object diagram is a structural diagram that displays examples of classifiers used in models. Similar to class diagrams, object diagrams use a notation. Class diagrams show the actual classifiers and their connections inside a system, while object diagrams display particular instances of the classifiers and the relations among them at a given moment.
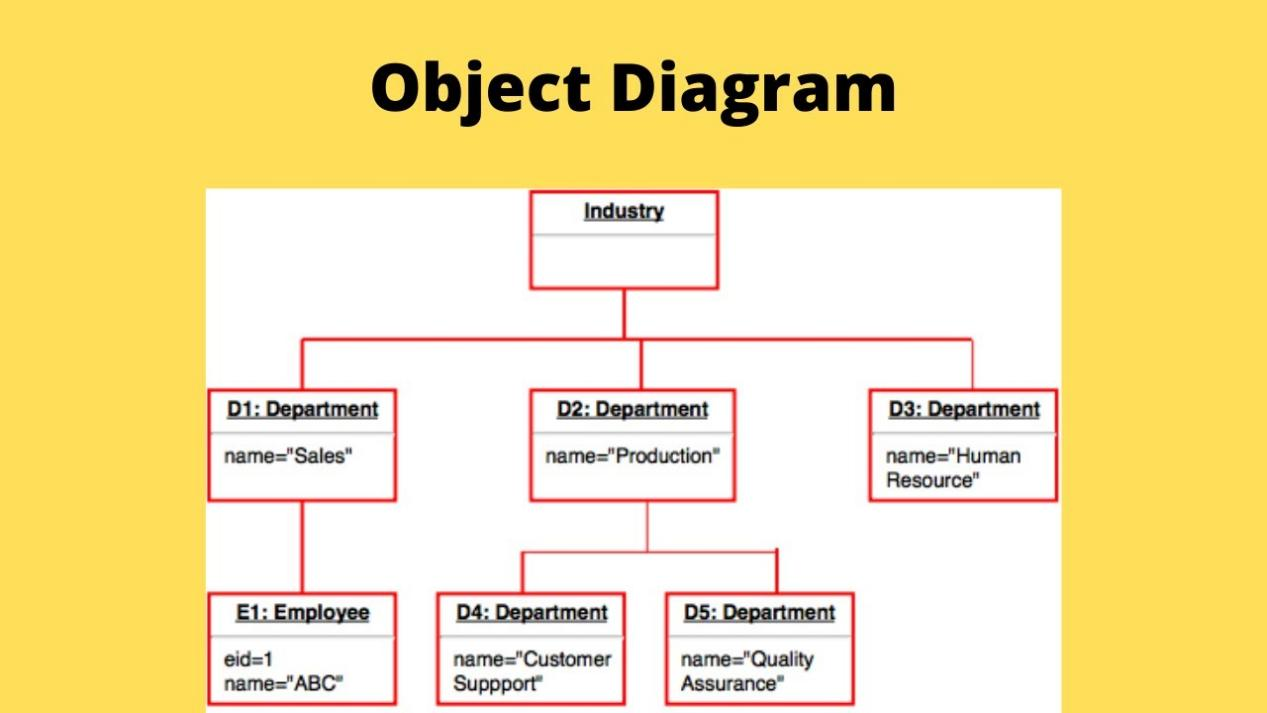
Source: Ytimg
The classifiers in the class, deployment, component, and use-case diagrams may be instantiated to build object diagrams. Object diagrams in UML provide a picture of the instances in a system and the connections between them.
Purpose of Object Diagram
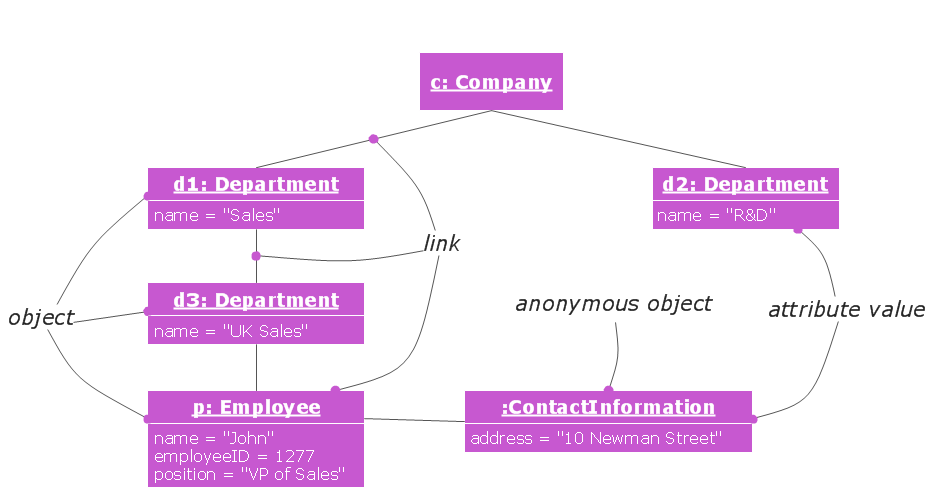
Source: Conceptdraw
What are the uses of object diagrams? Generally speaking, object diagrams are helpful in the following situations:
- Simulate a system's static architecture or structure using hypothetical cases and actual data.
- It aids in our understanding of the features that users should get from the system.
- It helps recognize the connections between items.
- Create a static frame that depicts instances of items and their connections in the dynamic life narrative of a system by visualizing, documenting, building, and designing it.
- Object diagrams are used as individual test cases to check the class diagrams for correctness and completeness.
- They are used to learn the connections and dependencies between certain cases and the representation of particular classifier examples.
Pros and Cons of Object Diagram

Advantages of Object Diagrams
Readable and Flexible
The biggest advantage is that any coder who comprehends even a small portion of the program can readily grasp the diagram's codes. This allows a computer programmer to utilize the codes to run the program and update or reuse them whenever he wishes.
The ability to adapt object diagrams to the business's or technology's needs is another aspect that makes it a crucial tool for software development.
Proper Communication for the Software Architecture
Since it provides the foundation for the operation and efficiency of the system, the software architecture serves as its blueprint. Software engineering modeling uses the comprehensive language of UML (Unified Modeling Language).
Additionally, it aids in monitoring, security, and user performance evaluation and provides pertinent instructions for the task.
Planning Tool Before Making a Program
Before you begin developing your software, object diagrams may assist you in designing it. The tool may assist with producing codes that build up the model's UML structure. When you construct the software, you may cut overhead by changing the diagram, which is rather simple.
Easily Debug Any Issue
Finding the fault in more complex software may take hours and hours of searching, and it may also have long-term negative effects on the system. With object diagrams, a program is skillfully created so that each job has its codes, making it simpler for the programmer to debug.
Disadvantages of Object Diagrams
It is a bit time-consuming
The main deterrent of object diagrams is the time-consuming nature of managing the diagrams. A programmer must synchronize the codes needed for software projects for object diagrams to provide outstanding work.
It Is Just A Language
You may argue that it only serves as a means of communication amongst those who can grasp it. Additionally, it all depends on how you use it. Only if you are utilizing it as part of a comprehensive model-based system will you be able to get information on traceability, which is significant in particular sectors but demands strict discipline.
UML object diagrams, however, also need more formal semantics in several domains. Work is being done to raise the quality of it in the two fields of state machines and composite structures. It might prevent you from achieving the objectives that your firm has set for you if you don't make full use of it.
Designing – That Is All
Object diagrams need a lot of design work, which may be time-consuming and daunting for certain businesses. Due to falling for the codes, businesses ignore the actual program and overanalyze the true problem.
It Can Ascend Its Complexity
Because it may become so sophisticated and prevent new programmers from understanding or utilizing it, some programmers believe they are better off without it. Due to its enormous amount of diagrams and codes, employing the object diagram becomes less crucial.
Object Diagram Vs. Class Diagram
An object diagram is similar to a class diagram, except it shows the instances of classes in the system. We depict actual classifiers and their relationships, making use of class diagrams. On the other hand, an object diagram represents specific instances of classes and relationships between them at a time. Below are some differences between them.
- Class diagram depicts the static view of a system, while object diagram portrays the real-time behavior of a system.
- Dynamic changes are not included in the class diagram, whereas dynamic changes are captured in the object diagram.
- An instance's data values and attributes are not involved in class diagrams, but object diagrams incorporate the data values and attributes of an entity.
- The object behavior is manipulated in the class diagram. In Object diagrams, objects are the instances of a class.
Components, Notations, and Examples of Object Diagram
Object diagrams are simple to create: they're made from objects represented by rectangles linked together with lines. Take a look at the major elements of an object diagram.
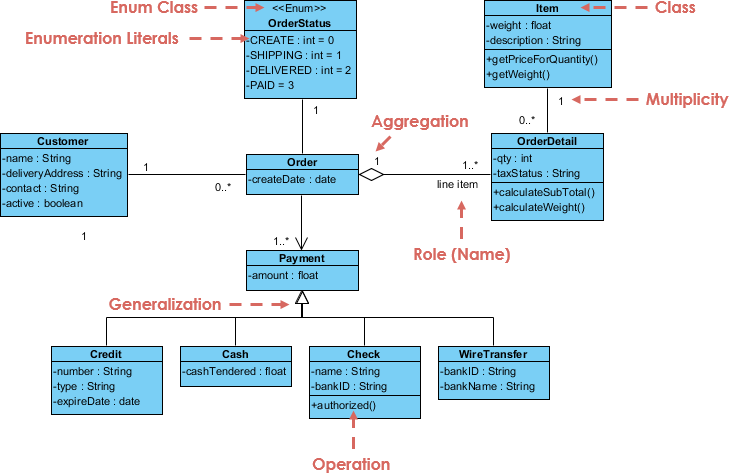
- Objects: objects are instances of a class. For example, if "car" is a class, a 2009 Nissan Altima is an object of a class.
- Class Titles: Class titles are the specific attributes of a given class. In the family tree of the object diagram, class titles include the name, gender, and age of the family members. You can list class titles as items on the object or even in the object's properties (such as color).
- Class Attributes: Class attributes are represented by a rectangle with two tabs that indicate a software element.
- Links: Links are the lines that connect two shapes of an object diagram to each other. The corporate object diagram below shows how departments are connected in the traditional organizational chart style.
How to Draw an Object Diagram in UML
Now that you have learned some basic aspects of an object diagram, you may want to draw one by yourself. However, how to start? This is a problem for every green hand.
Don’t worry. Many online tools help users to make diagrams in a better way. To name a few, Boardmix is one of your best options. As a professional diagram maker, you can comfortably finish the diagram creation. No steep learning curve. Everyone can draw their object diagram with Boardmix.

Besides, if you are in a team and need to work with others, Boarmix is also a great assistant thanks to the real-time collaboration features. All your ideas can easily be formulated on Boardmix.
Now let’s see how to draw an object diagram using Boardmix.
From Template
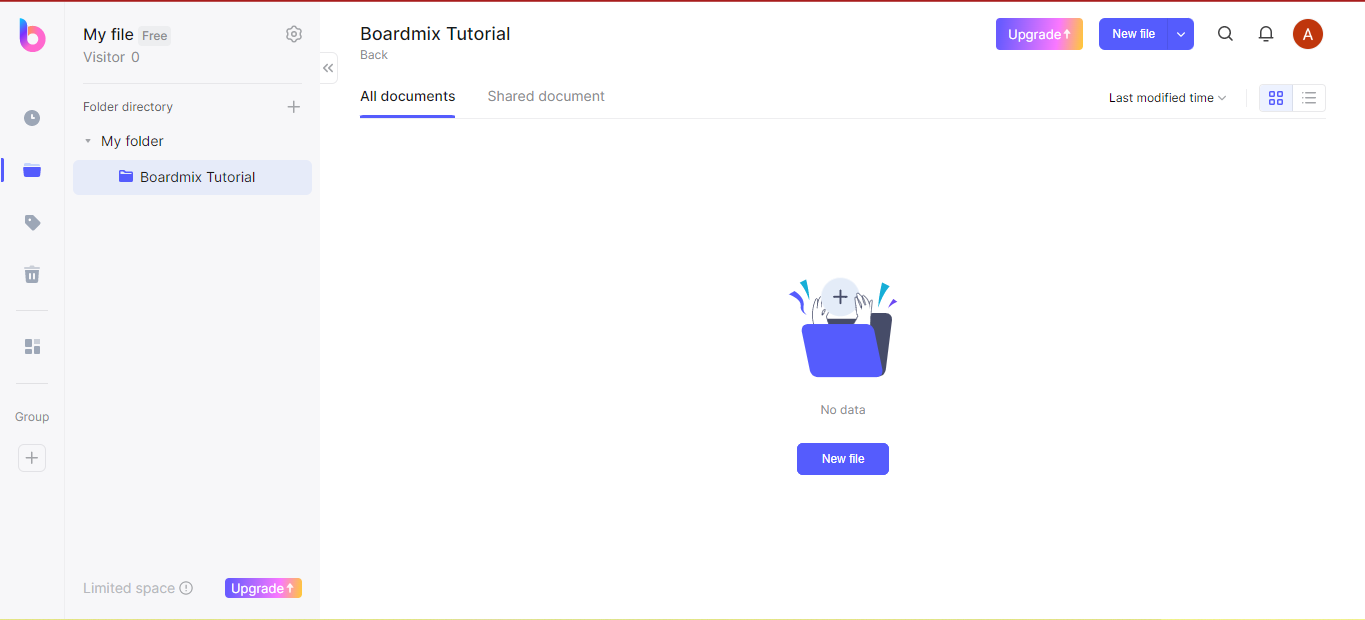
Step 1: Create a new Boardmix canvas by clicking on "New File".
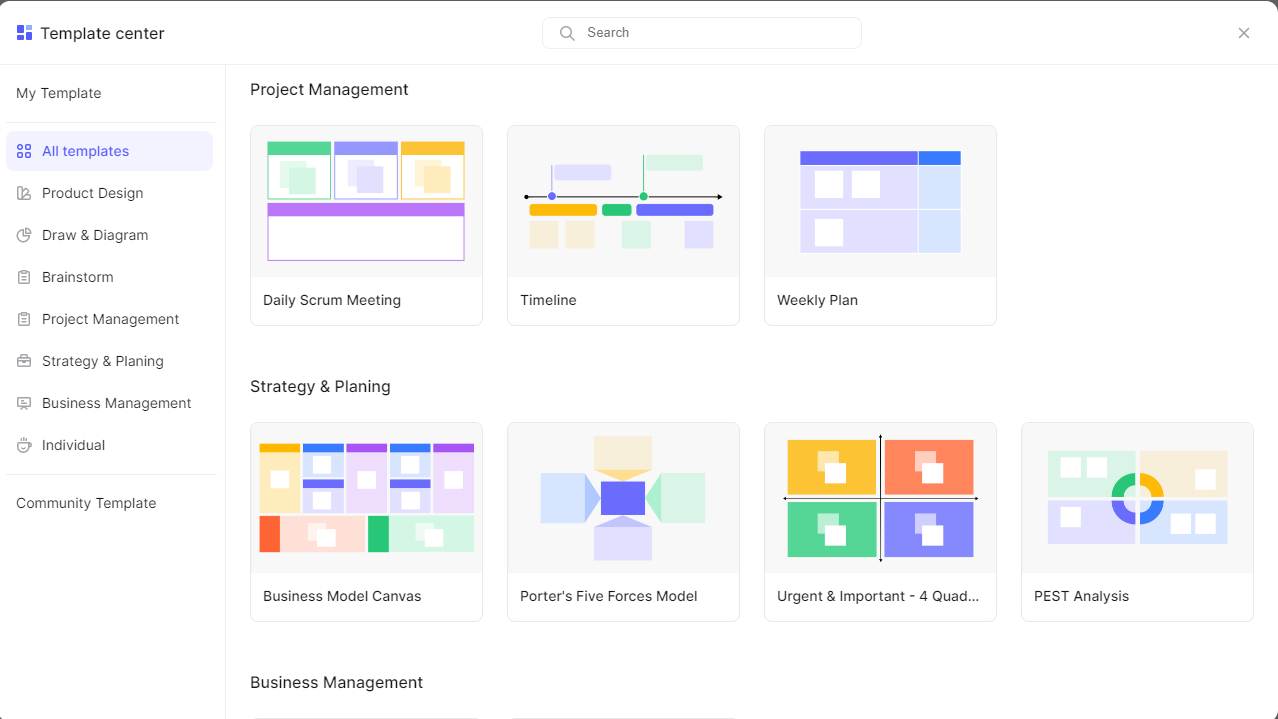
Step 2: On the left toolbar, click on the first icon for templates. It displays "Templates" when hovered as seen in the screenshot below. There are lots of templates available for use. Scroll down or use the search bar provided and find the templates you want. Click to use it.
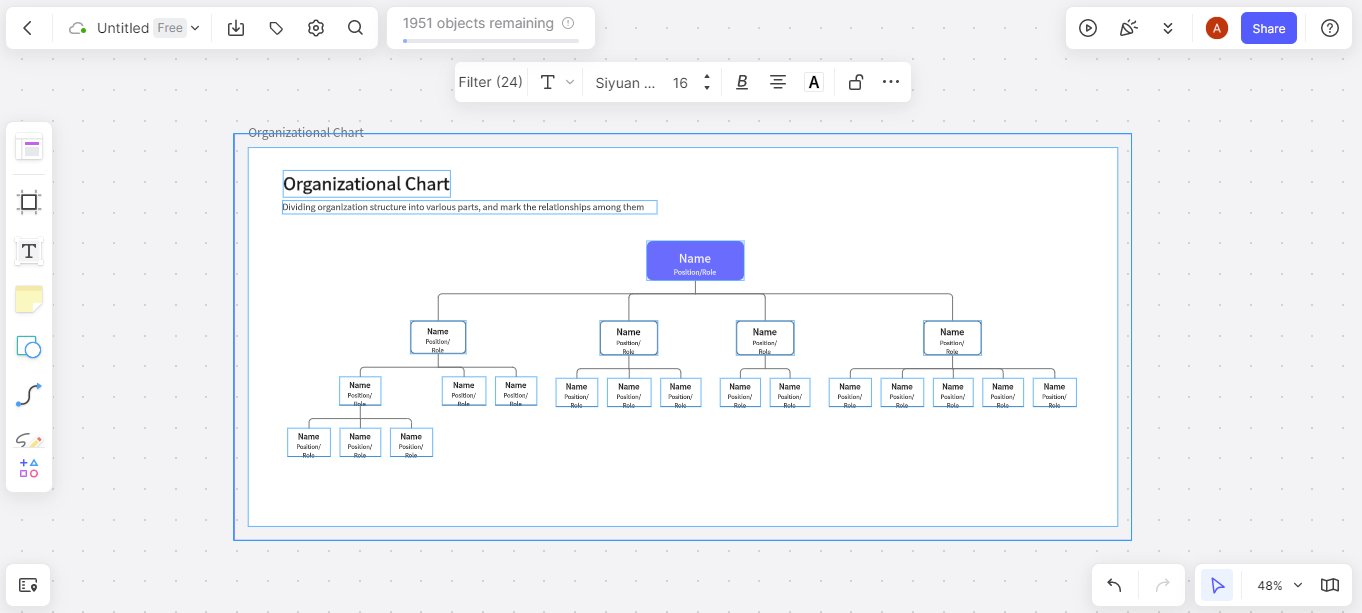
Step 3: An already designed yet editable object diagram is shown on the canvas. Edit the text and form of this diagram to suit your use case.
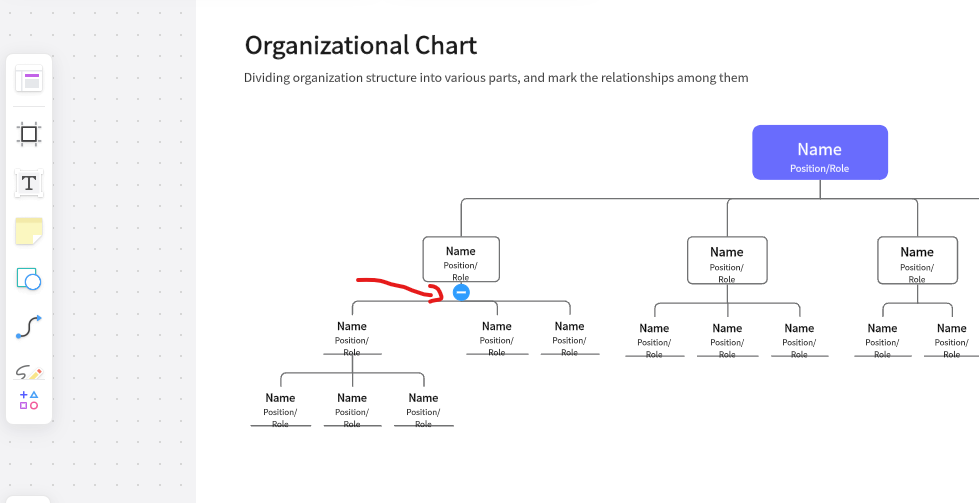
Step 4: Click on the node at any side of the objects to add or remove the links. The screenshot below shows the node having a "negative sign". If clicked, the linked objects are deleted.
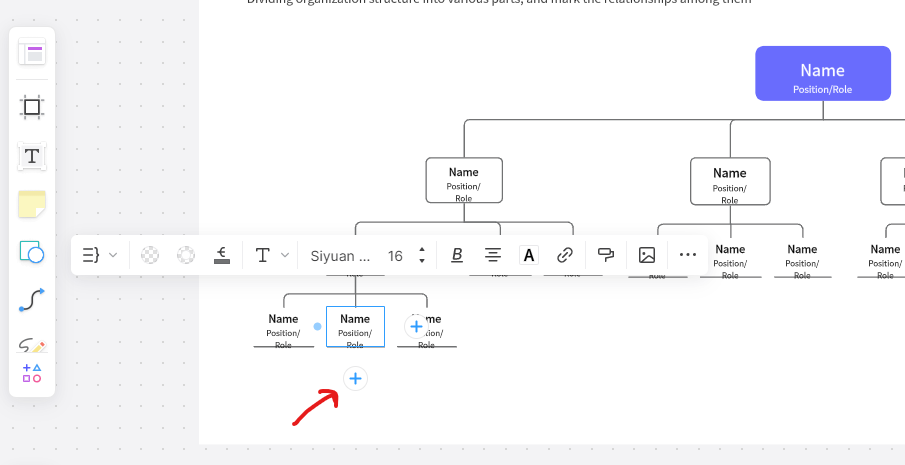
Step 5: Edit the text and add as many links as you want to the template! It is 100% editable.
Without Templates (From Scratch)
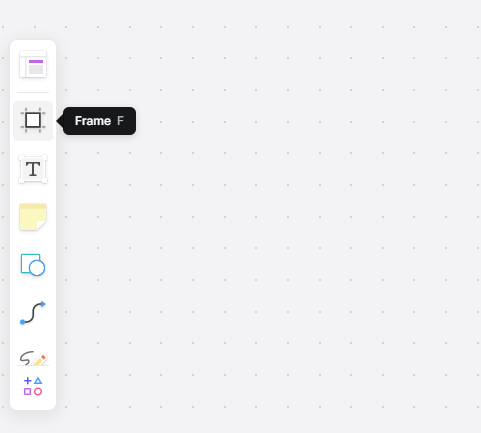
Step 1: Open a new file with a blank Canvas. From the left toolbar, click on the "Frames" icon.
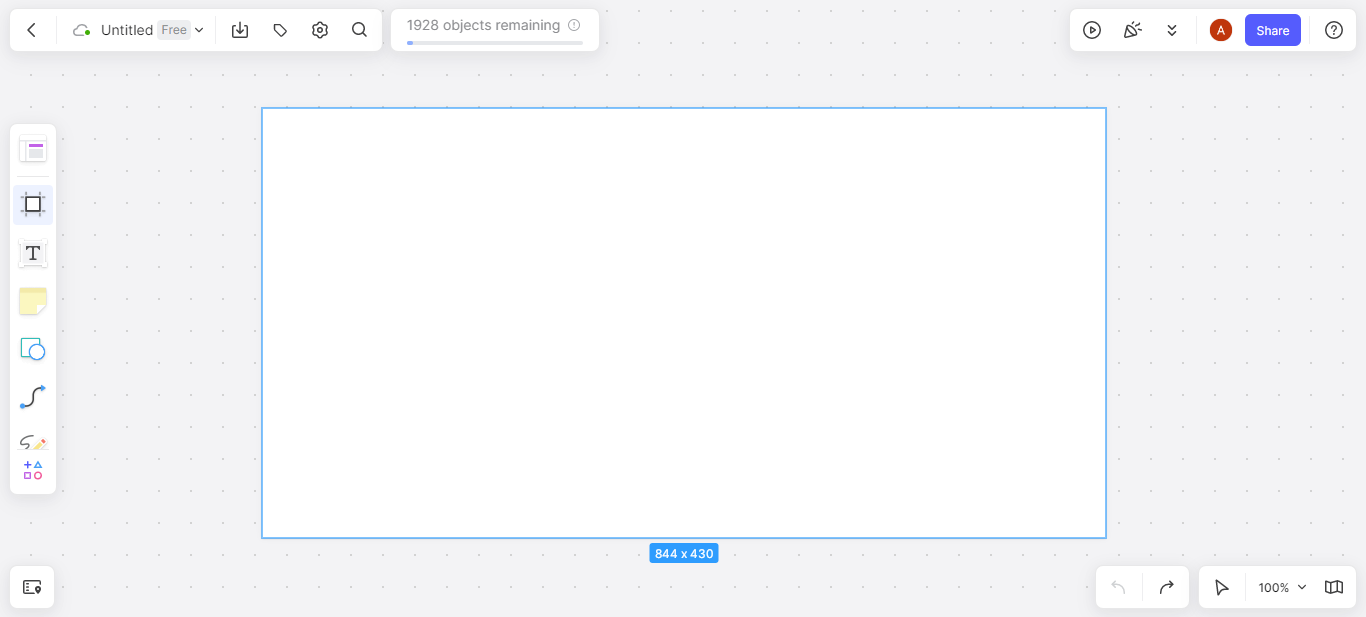
Step 2: Draw a white (empty) board to house the object diagram.
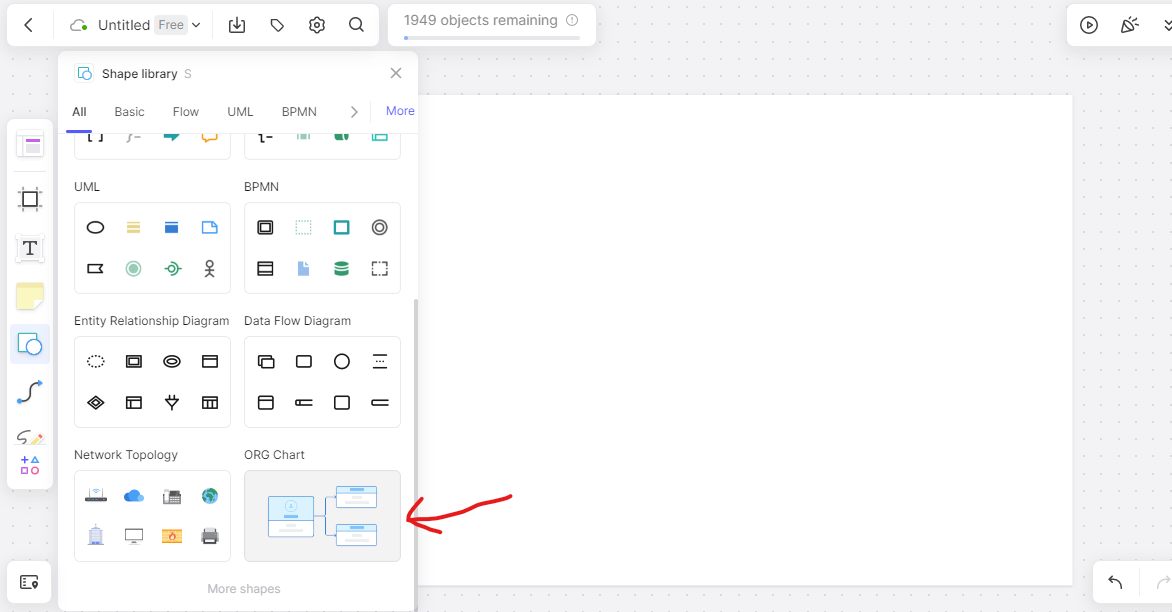
Step 3: Click on the "Shapes" icon on the left toolbar and open up the Boardmix shape library. There are many categories of shapes we could select from. However, you should use the category named "Org Chart". These shapes are pre-made and well-suited for object diagrams.
Step 4: Draw the shape on the white Frame canvas. Every shape has 4 nodes, one at each side. Click on the shape to reveal these nodes. Click on any node to add a link as well as a new object. You can also drag these elements to suit your desired structure.
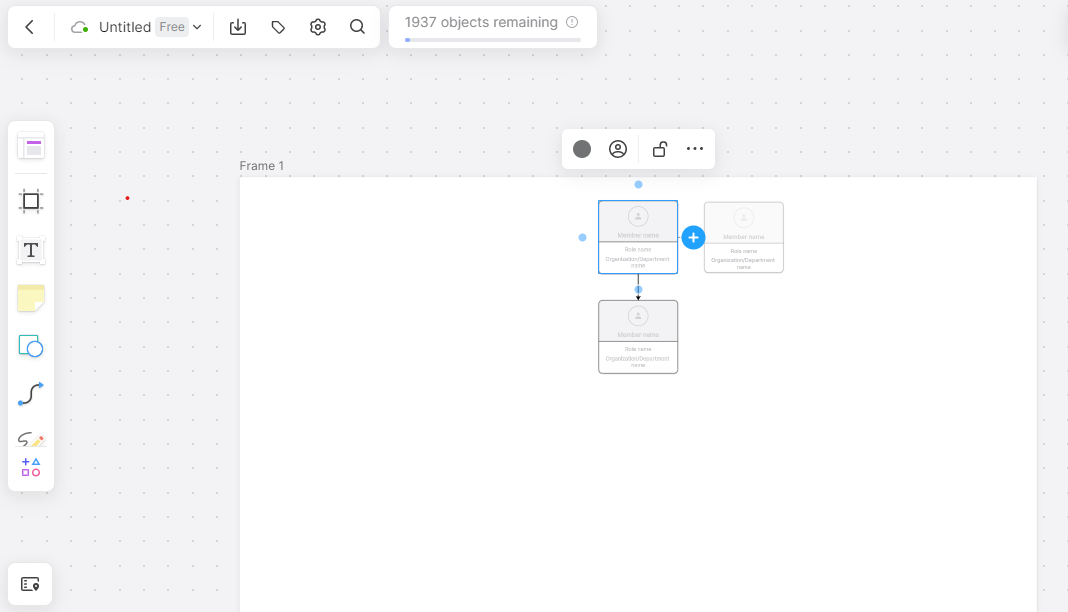
Step 5: Edit the texts and add images if required on each object. This brings the diagram to life!
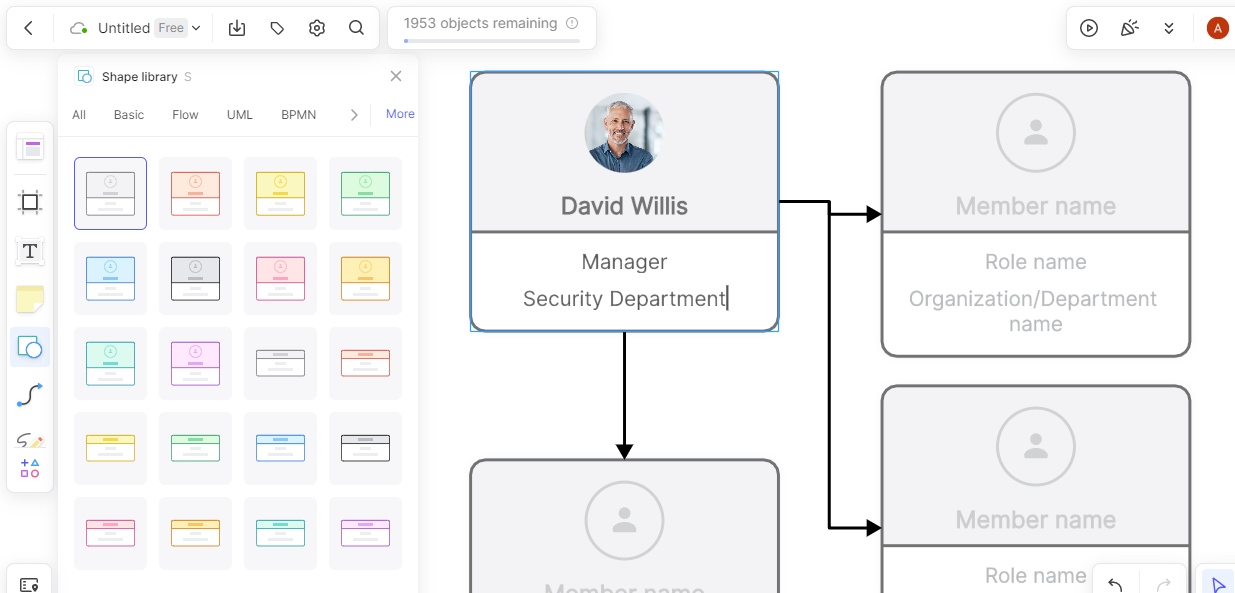
Step 6: Add colors and fully customize your diagram to suit your use case.
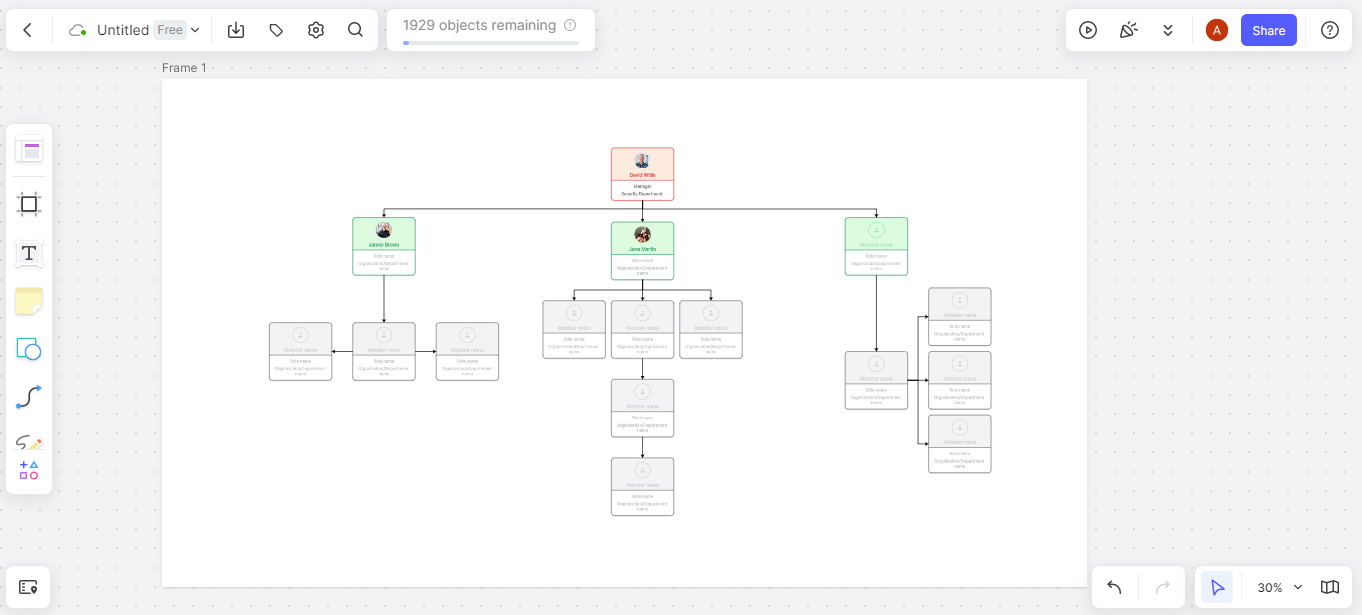
Step 7: Click on the "Export" button from the top bar, and select the file format for export. There are lots of exportable formats e.g. jpg, png, svg, pdf, .bdx, and so on. Export and save to your device.


