

A PERT diagram, sometimes called a PERT chart, is a project management tool used to schedule, organize, map out, and coordinate tasks within a project. It provides a graphical representation of a project's timeline that enables project managers to break down each task in the project for analysis. The name PERT is an acronym for Program Evaluation and Review Technique. A PERT chart is a great way to help you estimate more accurately.
In this article, you are going to learn everything about the PERT chart. Keep reading.

Pros and Cons of the Pert Diagram
What Makes a Pert Diagram
Terminologies of the Pert Diagram
There are numerous terminologies used for PERT diagrams, and we'll mention a few.
- Scope: A specific definition of what the project does and does not entail. A well-researched and coordinated scope of work is critical to managing the expectations of customers and workers alike.
- Task: A task is an arrow-shaped element of a PERT chart representing an activity that must be performed. There are two types of tasks: predecessors, which precede a milestone (event), and successors, which follows a milestone (event).
- Critical Activity: Critical activity is an activity that has slack equal to zero. An activity with zero slack is not necessarily on the critical path since its path may be shorter.
- Critical Path: The longest time path through the task network. The "longest" path (in terms of time) to the completion of a project.
- Crashing: The goal of crashing a project is to reduce the duration as much as possible, regardless of cost. It is the opposite of relaxing a project.
- Relaxation: The method that is the opposite of crashing a project. Relaxation is used to lower costs while extending the duration of the project.
- Slack Time: Slack (or float) measures the excess time and resources available to complete a task.The amount of time a task can be delayed before the project finish date is delayed.
- Constraints: Restrictions set on the start or finish date of a task.
- Dummy activity: An imaginary activity with no duration, used to either show an indirect relationship between 2 tasks or clarified the tasks' identities.
- Milestone: A milestone (also known as a PERT event) is an element of a PERT chart, marking the start or completion of a task or several tasks. It consumes no time and uses no resources.
- Expected Time: Expected time is the best estimate of the time required to accomplish an activity (te) or a path (TE), accounting for the fact that things don't always proceed as normal (something goes wrong, something goes better than expected).
- Fast-tracking: Project activities are initially supposed to be completed sequentially but performed simultaneously to save time.
Components in a PERT Diagram
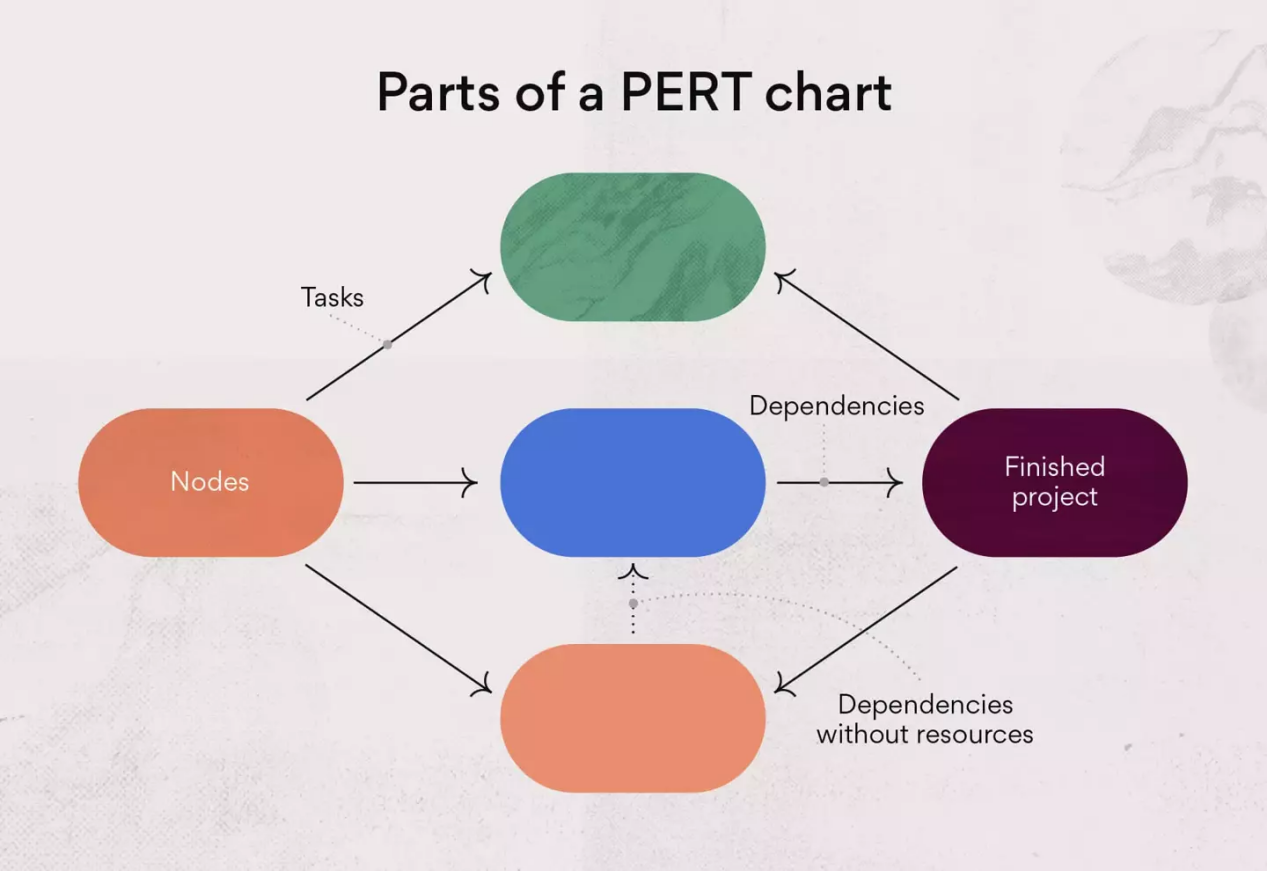
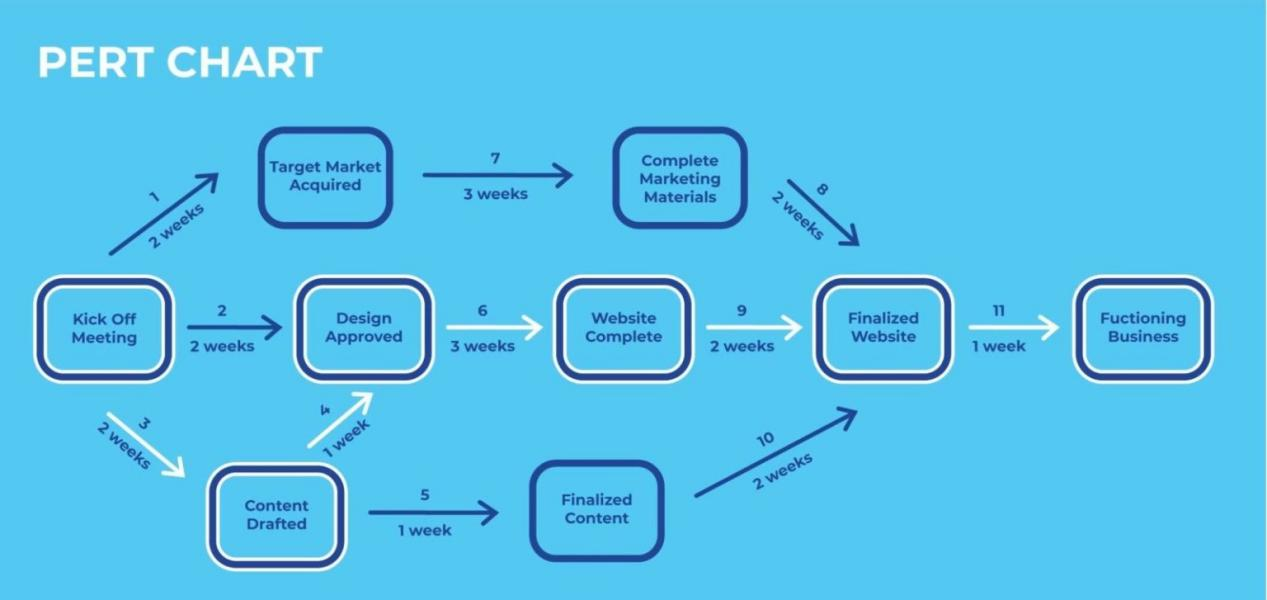
Numbered nodes
These are the numbered boxes you see in the PERT chart example above. (Some project managers choose to draw them as circles.)
Each node represents an event or milestone in the project, the completion of one stage, or a series of tasks needed to move the project forward.
Directional (or concurrent) arrows
These arrows on a PERT chart represent the tasks or activities that need to be completed before the team can move on to the next event or phase of the project.
Divergent arrows
These arrows represent tasks a team may work on simultaneously or in any sequence they choose because they do not have dependencies.
Formulas Used for a Pert Diagram
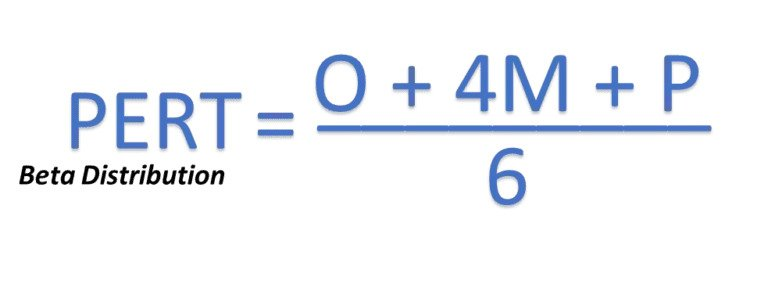
The PERT estimate (E) is based on a formula that includes your optimistic time estimate (O), your most likely time estimate (M), and your pessimistic time estimate (P). The basic equation is this: E = (O + 4M +P) / 6. If you have difficulty with equations, consider using a PERT calculator on the web to simplify things.
At the same time, PERT can help to calculate the standard deviation (SD) from this estimate. The PERT equation for this value is SD = (P-O) / 6. The standard deviation tells us how accurate the initial PERT time estimate is so we can give our workers, superiors, and customers a completion window rather than a hard and fast completion date. Web-based calculators are available online to simplify the standard deviation calculation for convenience.
Create a Pert Chart with Boardmix
You can draw a PERT chart by hand or use PERT chart software to create visualizations. Boardmix is the software that helps you create PERT charts quickly and easily and improve your team's resource distribution.
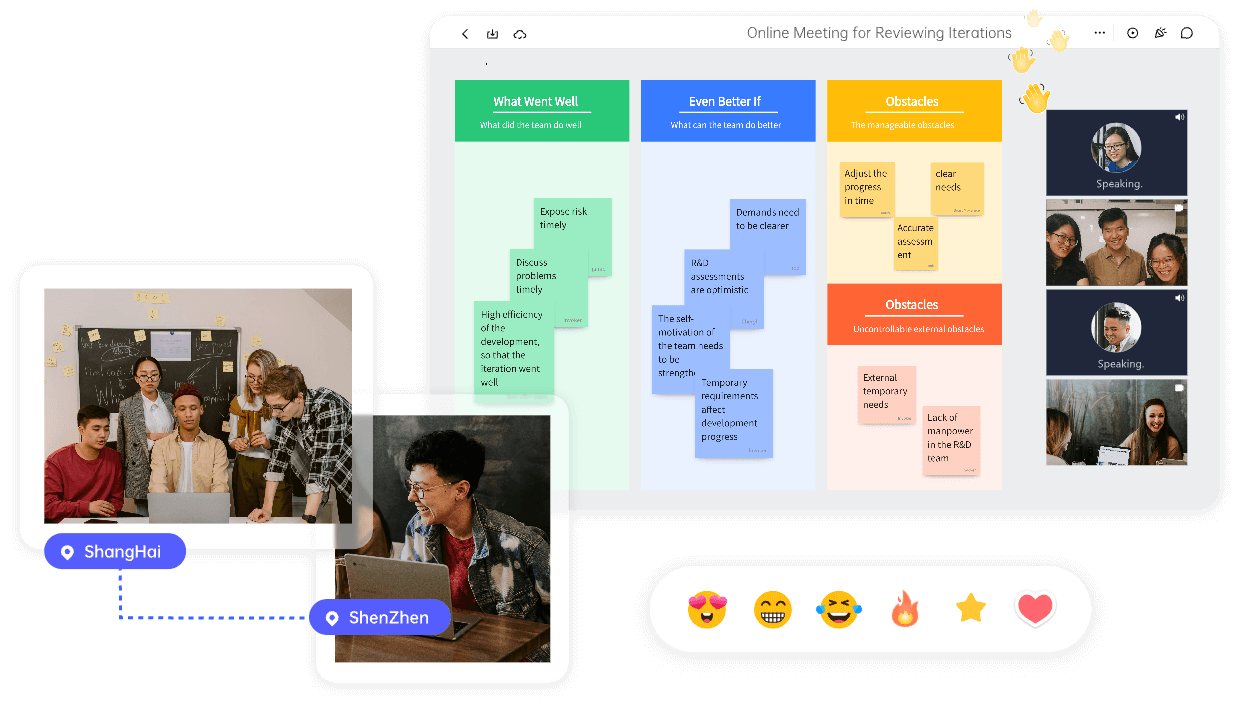
Boardmix is an industry-leading PERT chart software with many features and benefits, including:
- User-friendly interface that is intuitive and easy to learn.
- Convenient and simple file management.
- Filter your search based your preferred platform, aesthetic, etc.
- Powerful integrations with other software like Zoom and some storage apps.
- Built-in templates for different chart styles and various use cases.
Able to collaborate with your workmates in real time and share the file via link.
How to Make a PERT Chart
To simplify the procedure, you can register and log onto the Boardmix first. We have provided a list of actions to assist you in making a PERT chart that you may modify to your project's requirements.
- Identify the major milestones in your project and the steps necessary to attain each one. Create a list of these.
- Set up the order. Choose the steps you must take to fulfill each of these milestones in the correct sequence.
- Establish the necessary timeframe. Namely how long each task should take.
- Create an outline: Outline your PERT diagram using your list. Project milestones should be represented by "nodes" that are presented as circles, triangles, or boxes. 'Vectors,' which are arrows used to connect the series of jobs and emphasize their interdependencies, should be utilized to connect these nodes.
- Develop your critical path, which shows the shortest time necessary to accomplish the project.
- Revise when circumstances change. You'll likely keep getting new information throughout your project, which will cause your timelines to adjust. So that the team can utilize the PERT chart as a trustworthy tool throughout the project. Therefore, keep updating it frequently to reflect these changes.


