If you are preparing for a presentation, you might be wondering which is the best way to show your data. A PowerPoint flowchart is usually a great way to show how a system works without needing to write a large block of text. Everyone in the meeting will be able to understand the flowchart at a glance since this diagram is so widely used.
In fact, the PowerPoint offers you several tools that permit you to create an easy-to-follow flowchart for your presentation.
In this article, we are going to show you the steps to creating a PowerPoint flowchart in two different methods. In addition to this, we will also present you with the best alternative to drawing efficient diagrams that your whole team can work on. Stay tuned.

Brief Introduction to Flowchart
A flowchart PowerPoint has become such a popular element for all presentations because it is a very convenient and powerful diagram. In reality, a flowchart is a type of diagram that represents the way that a system, process, or algorithm works. When you are using a PowerPoint flowchart, you can rest assured that all of your team members are on the same page since they all know how to interpret it.
In more detail, the basic elements of a flowchart PowerPoint are the following:
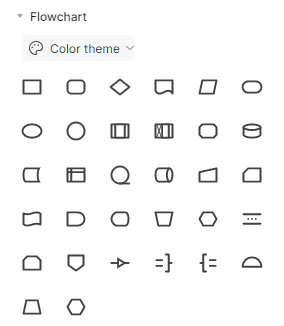
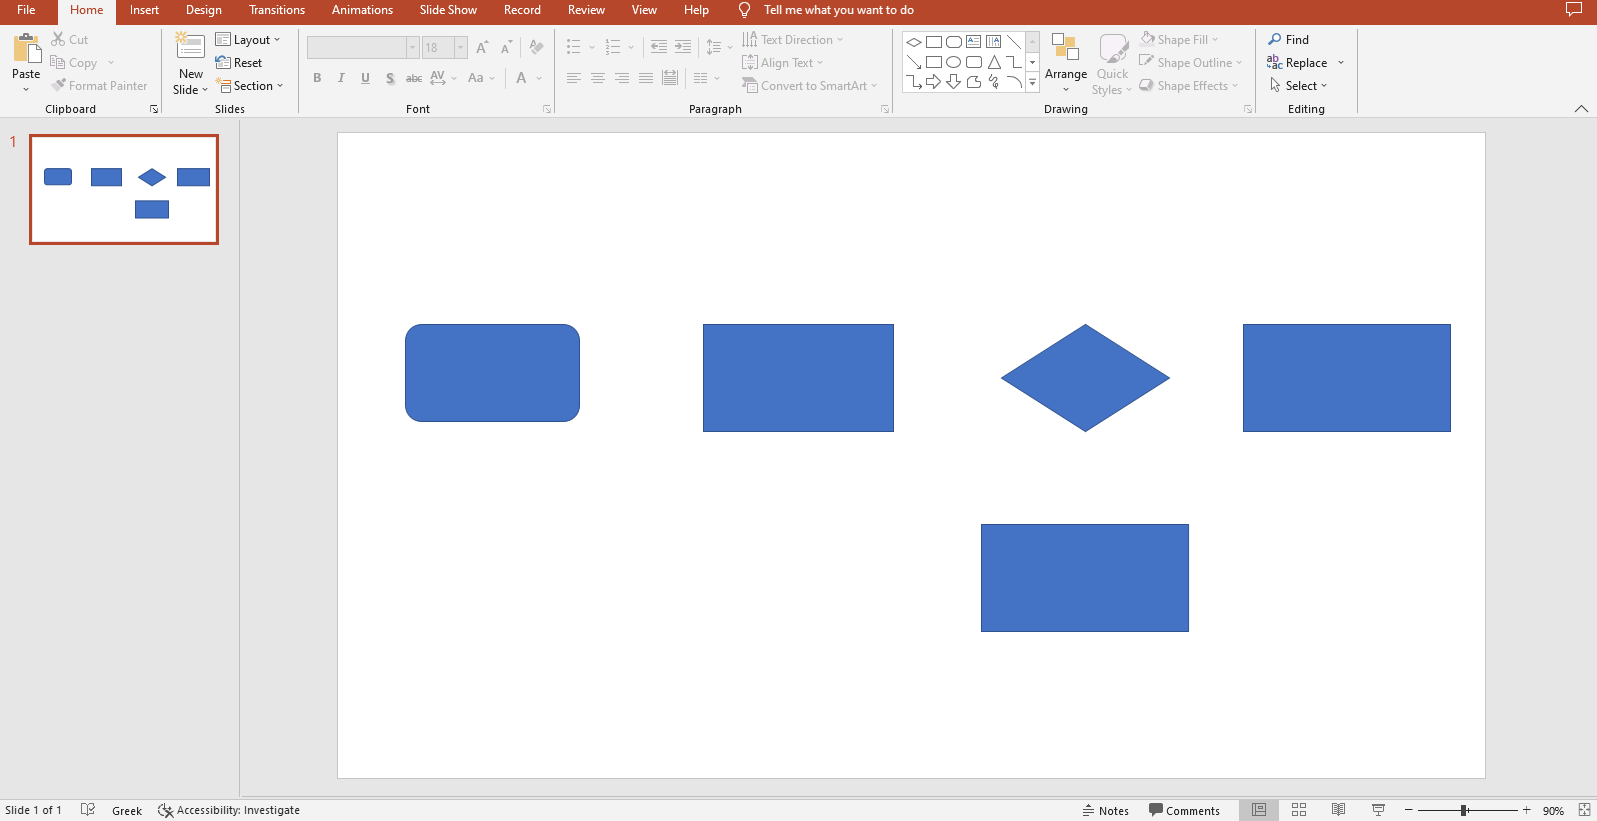
- Start/End symbol – this symbol indicates the beginning and the ending of a system. It is noted as a rounded rectangle.
- Process symbol – this notates any process that takes place and makes changes in the systems. It is indicated by a rectangle.
- Decision symbol – with this notation, you are showing a conditional operation that is often a yes/no or true/false question. It is noted as a diamond.
- Input/output symbol – this element shows that you need to insert data in the system or that the system exports data. It is shown with a rhomboid shape.
- On-page connector – this symbol is used to make your flowchart PowerPoint easier to follow as it replaces the complex parts of the diagram. It is represented by a circle.
- Off-page connector – this symbol indicates that the target is on another page and is used to simplify your PowerPoint flowchart. It is noted as a pentagon.
With this notation in mind, you can go on to create an effective flowchart PowerPoint that everyone understands.
How to Make a PowerPoint Flowchart
If you are interested in creating a PowerPoint flowchart, you can easily do that directly on the Microsoft Office application. In fact, there are two separate ways to draw your flowchart PowerPoint, either creating it from scratch or using SmartArt. Below, we will give you detailed instructions on how to create it with both methods.
With SmartArt
The first method is to use SmartArt. This particular feature makes it easy to draw a flowchart PowerPoint or any other type of diagram as it offers you readymade templates.
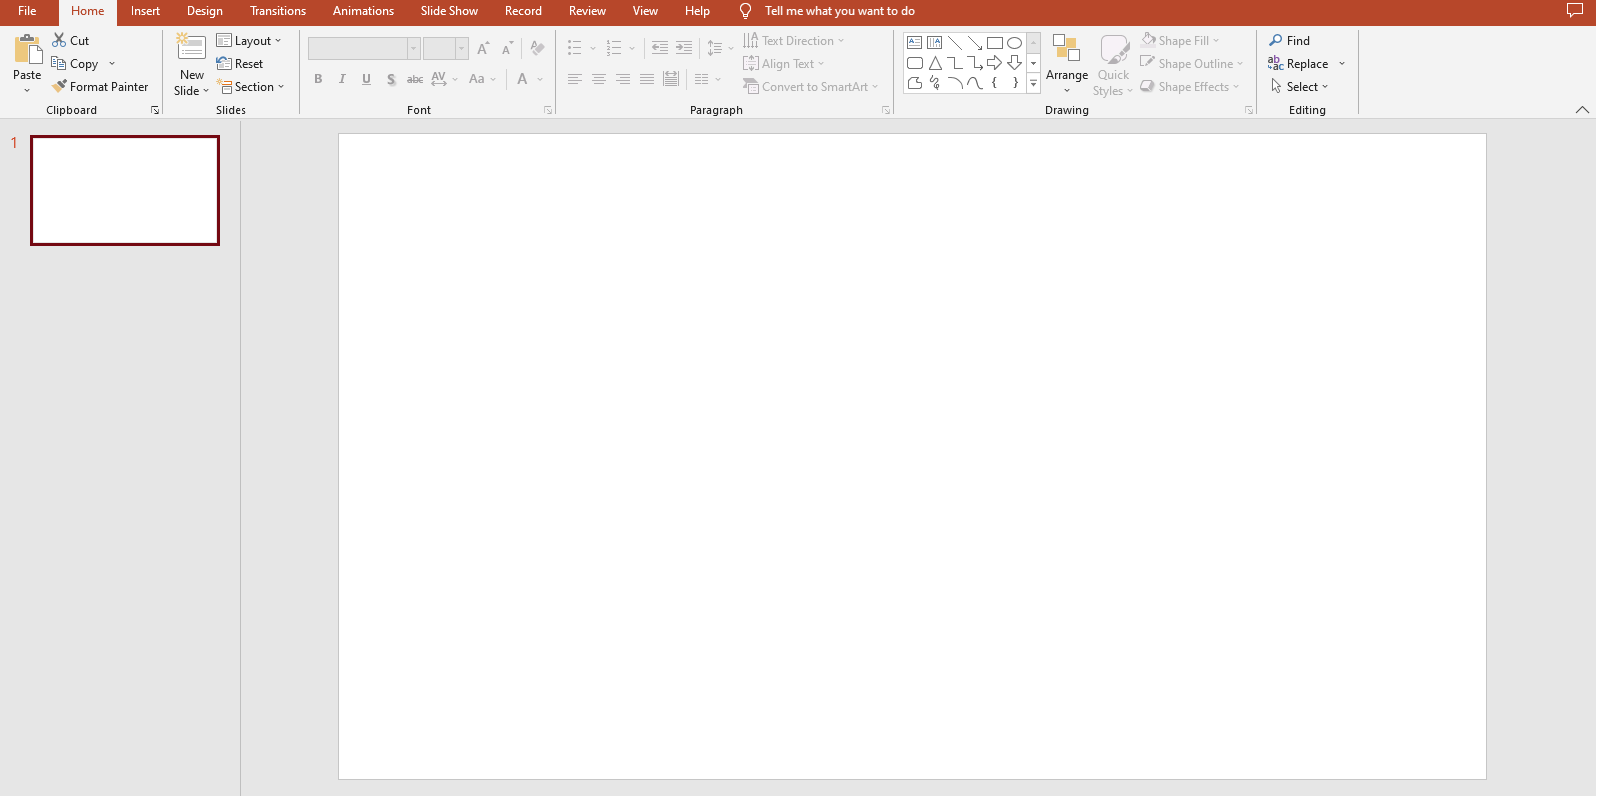
Step 1 - Launch PowerPoint, load a blank presentation and create a blank slide.
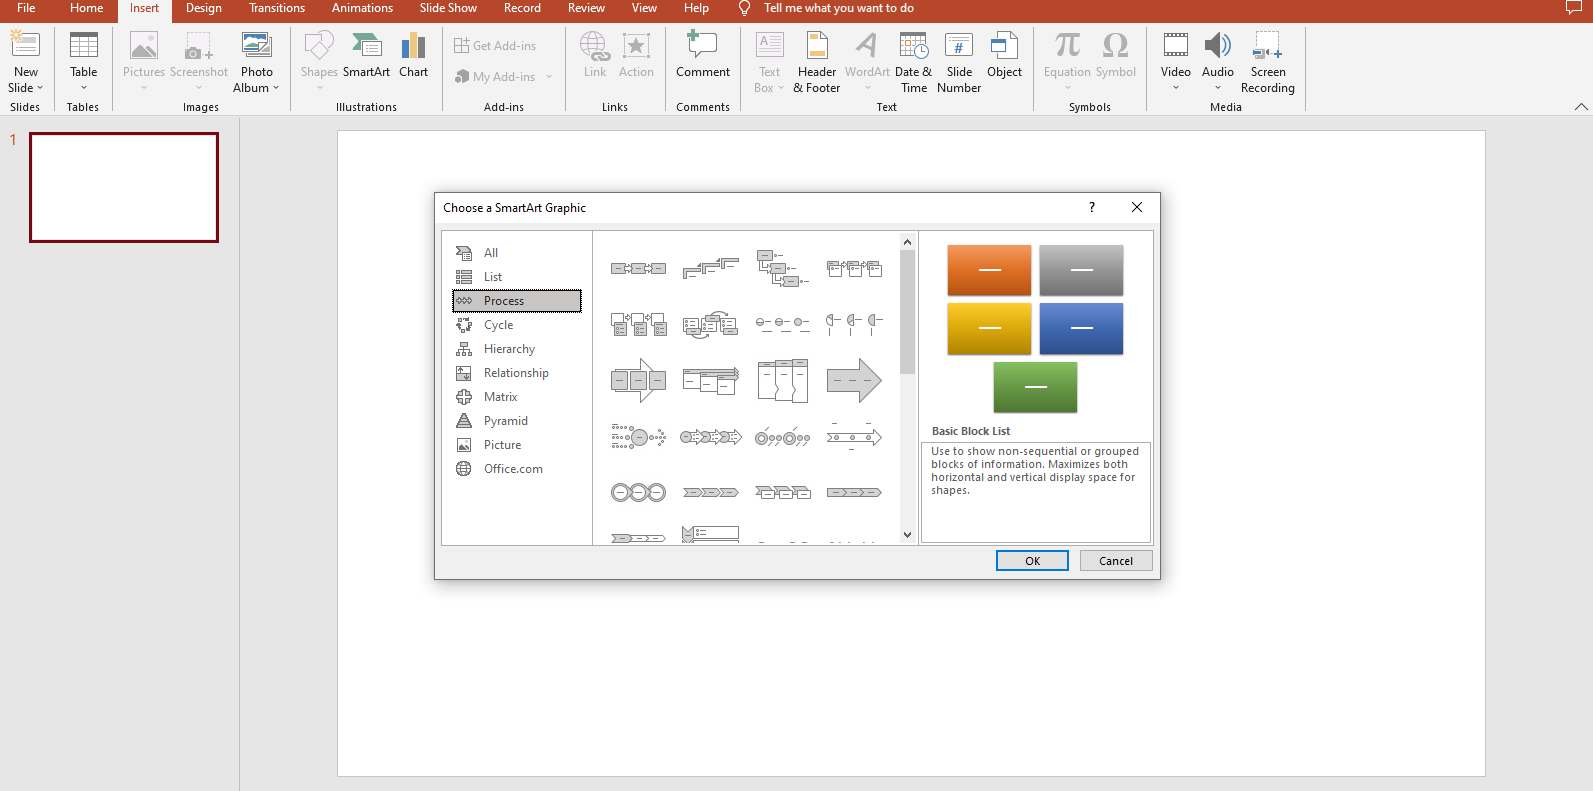
Step 2 - Go to the Insert tab and click on SmartArt. Find the appropriate flowchart under the Process section. Click on the chart you want to include and insert it in your slide.
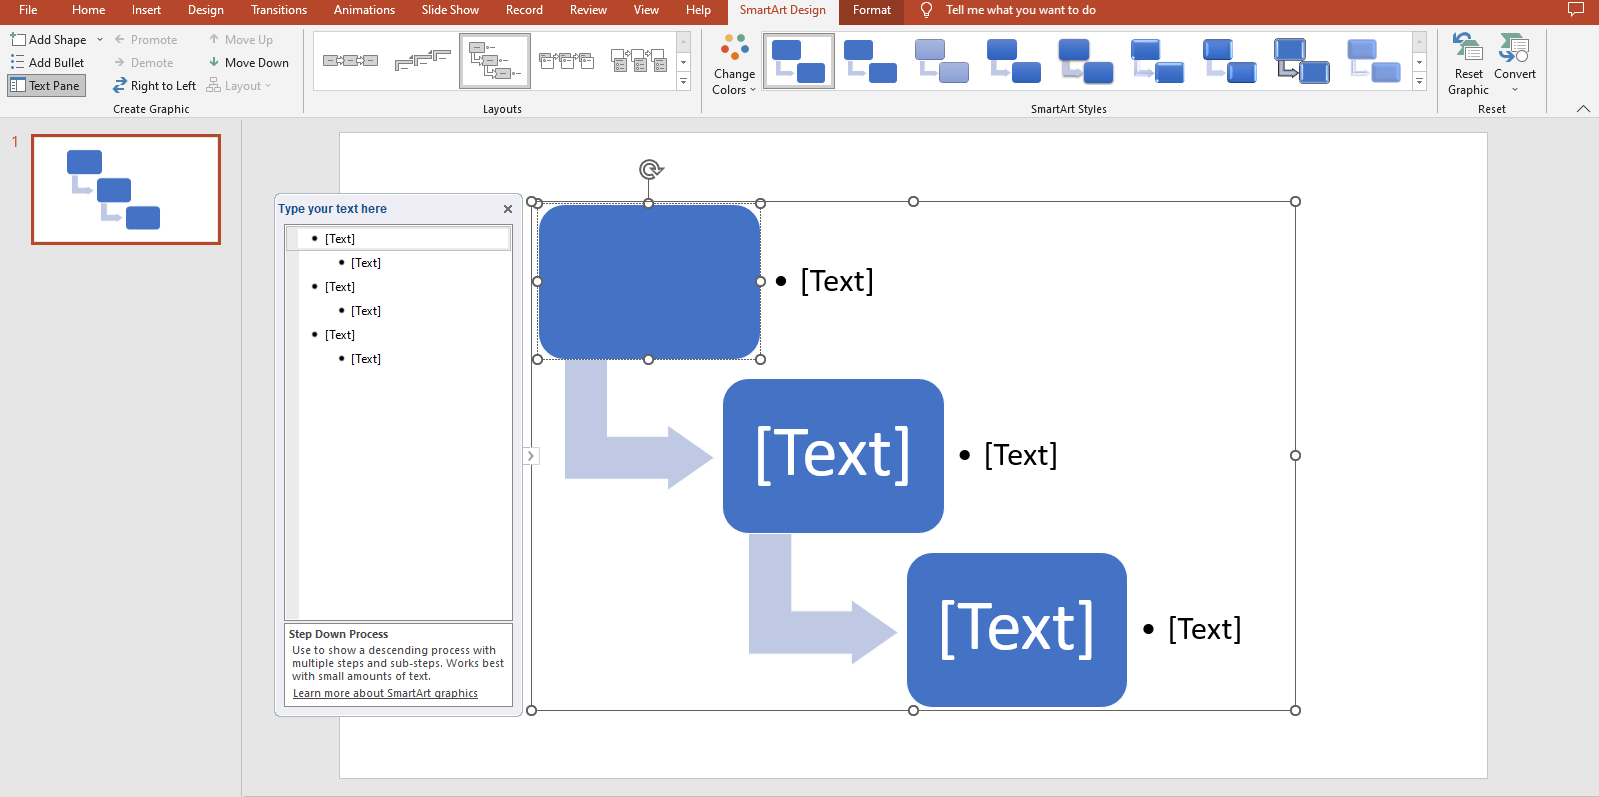
Step 3 - Customize the PowerPoint flowchart depending on your needs. You can change its color, insert text, and even add new shapes.
From Scratch
The next method to create a flowchart PowerPoint is to draw it from scratch. This method might be more time-consuming to complete compared to the previous one. However, it allows you to create a traditional flowchart that is easy to follow.
Here are the steps for drawing a PowerPoint flowchart from scratch:
Step 1 - Create a blank slide on a new project.
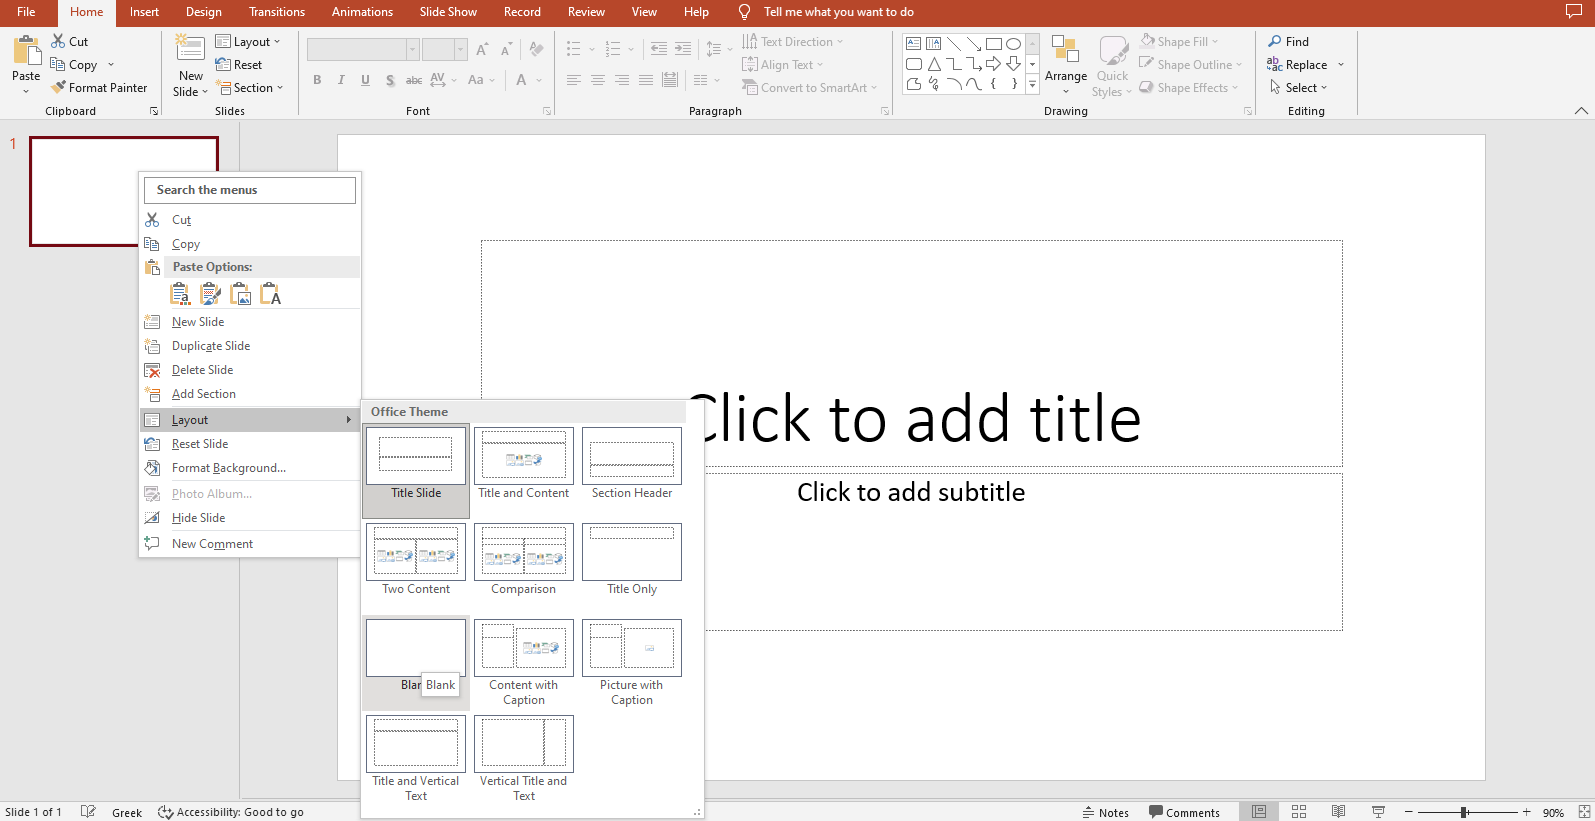
Step 2 - Add the shapes that you need to show the whole process.
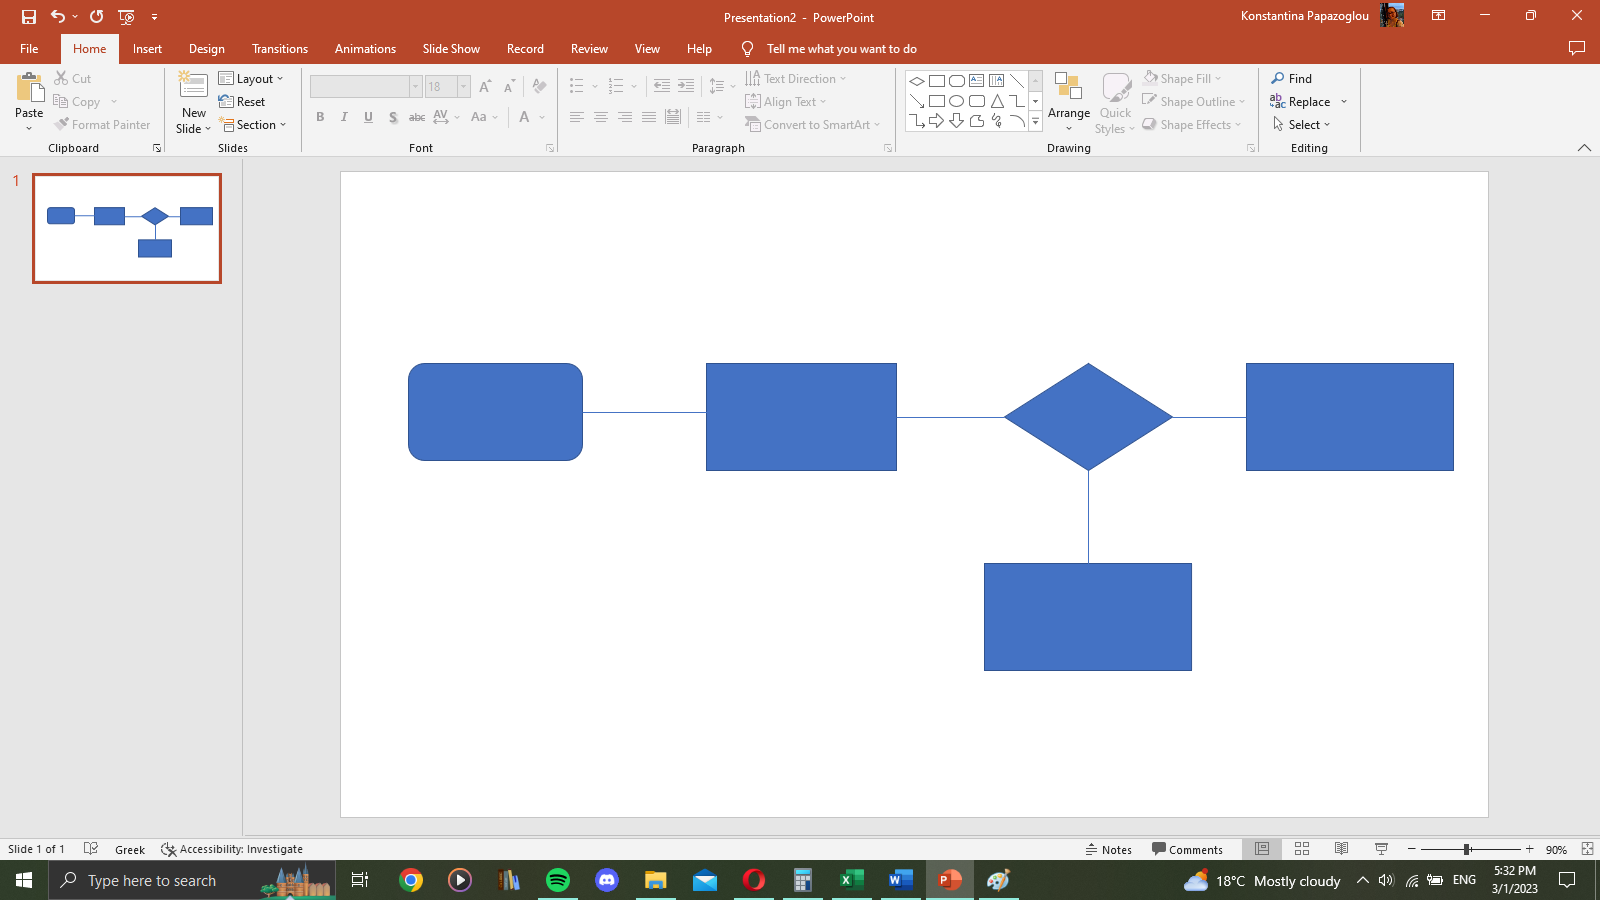
Step 3 - Connect the shapes with lines to showcase their relationships.
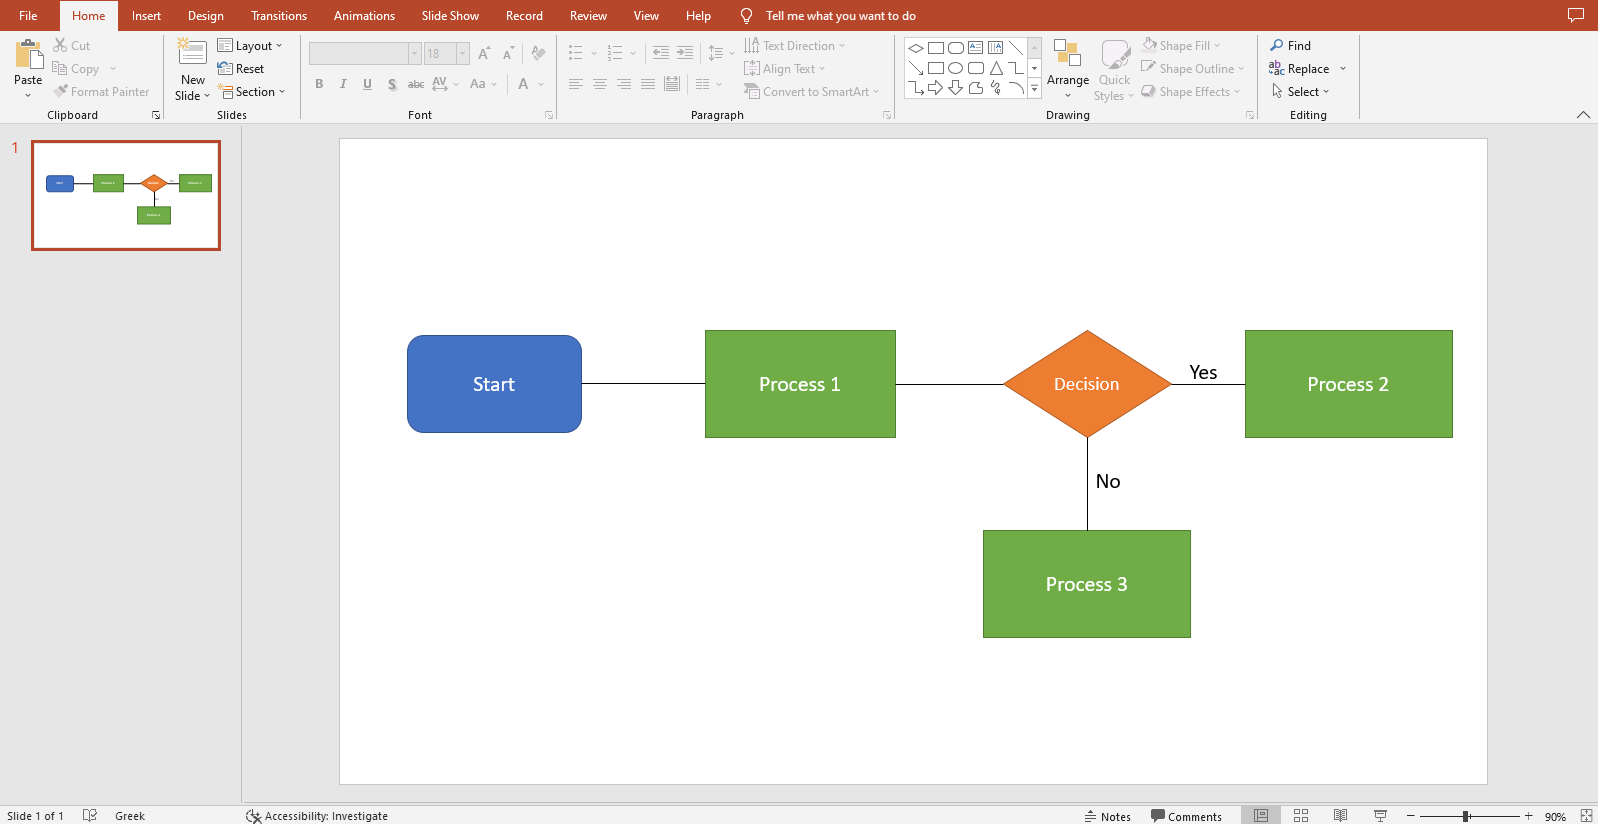
Step 4 - Customize the elements of your flowchart PowerPoint. You can change the color of your shapes and lines, add outlines, changes the fonts, and insert text. This will help you create a professional-looking PowerPoint flowchart.
Pros and Cons of PowerPoint Flowchart
The PowerPoint flowchart has become so popular with good reason. The element has multiple benefits that help teams. However, it also has some drawbacks that you need to keep in mind.
Create a Flowchart Online Using Boardmix
If you are concerned about the limitations you are facing when creating a flowchart in PowerPoint, you must discover an alternative. The best tool that you can use is Boardmix, which is a top-notch collaborative diagram maker in the market. In this app, you can create a PowerPoint flowchart, as well as numerous other diagrams that suit all of your needs within a project quickly and easily.

Boardmix has been developed to satisfy the collaborative needs of a team. For this reason, it has implemented link-sharing and real-time collaboration. More than one user can access different flowcharts and make all the necessary changes. And the great thing is that all these changes are immediately displayed to every user.
Furthermore, this is a web-based app that saves your projects in the cloud. Therefore, every member of your team can access them from any device and pick up the work from where he’d left it. This ensures that you won’t lose any progress due to system failure.
One of the greatest things about Boardmix is that it has a rich template library that allows you to create a flowchart in no time. The steps for drawing a flowchart in Boardmix are the following:
Step 1 – Login to your Boardmix account and select Flowchart from your home screen.

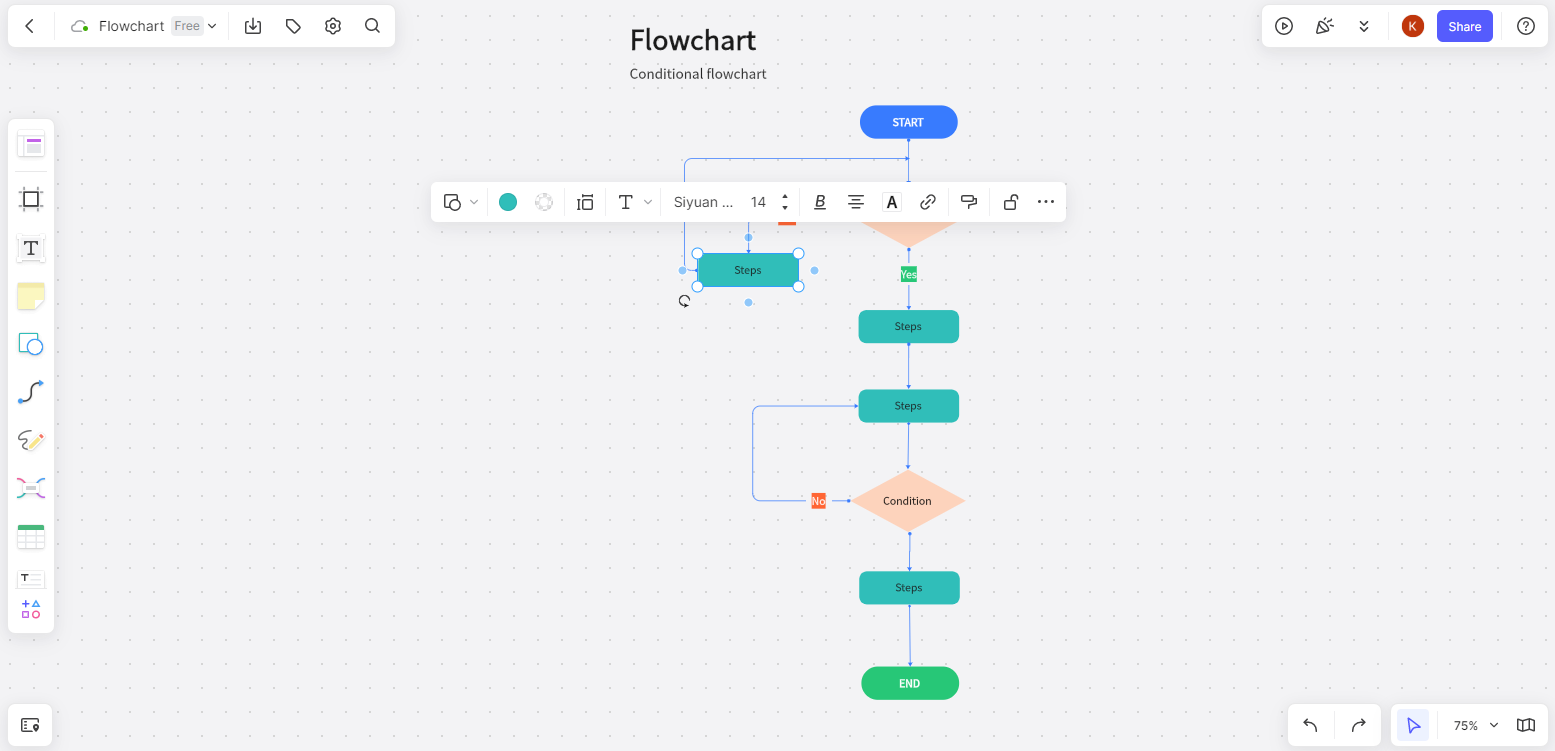
Step 2 – Add or remove shapes from the flowchart template, according to your system’s needs.
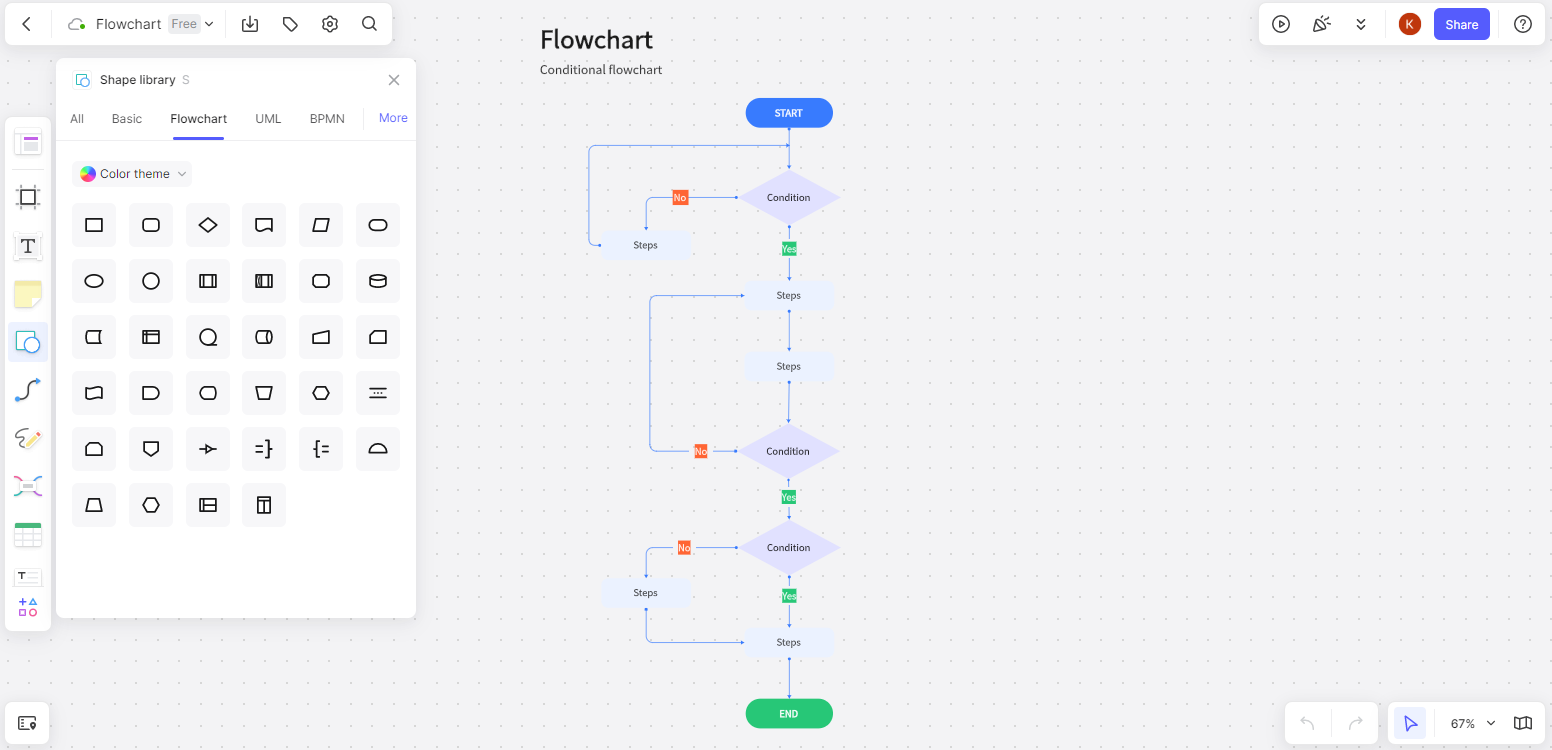
Step 3 – Customize your flowchart by changing the color palette and inserting the appropriate text. Your flowchart is ready!
The Bottom Line
A PowerPoint flowchart is a useful tool that you can add to your presentation to add clarity to your project. With Boardmix, you can now create visually pleasing charts that boost your team’s productivity. Sign up for the collaborative diagram maker to discover its top-notch features right now!


