A sequence diagram essentially shows how things interact with one another sequentially, or the order in which these interactions occur. A sequence diagram may also be referred to as event diagrams or event scenarios. Sequence diagrams show the actions taken by the components of a system in chronological sequence. They depict how items interact within the framework of a cooperation. Sequence Diagrams are time-focused, and they graphically depict the interaction's order by utilizing the vertical axis to illustrate the timing of when messages are transmitted.
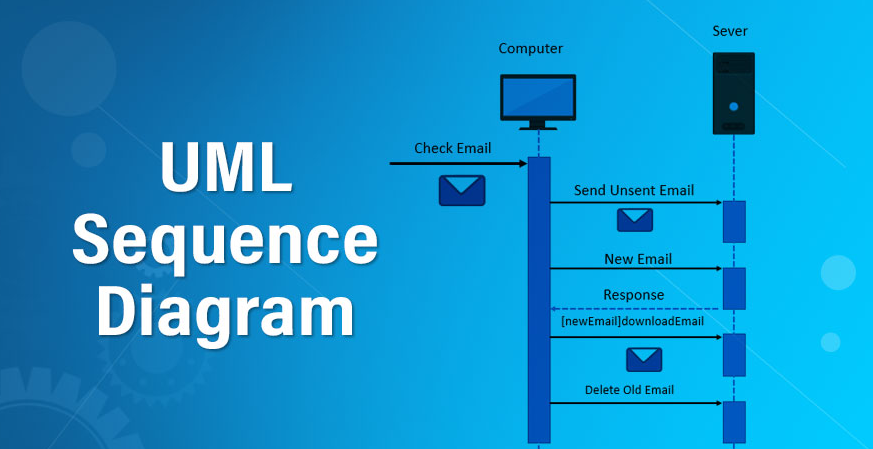
Source: Educba
Businesspeople and software engineers often use these diagrams to record and comprehend the requirements for new and current systems.
A sequence diagram shows an implementation of a scenario in the system. Lifelines in the system take part during the execution of a system. In a sequence diagram;
- A lifeline is represented by a vertical bar.
- Message flow between two or more objects is represented using a vertical dotted line which extends across the bottom of the page.
- Different types of messages and operators are used which are described above.
- Iteration and branching are also used.
When to Use Sequence Diagram Online
Sequence diagrams have numerous use cases and some are discussed below.
- Model high-level interaction between active objects in a system.
- Model the interaction between object instances within a collaboration that realizes a use case Model the interaction between objects within a collaboration that realizes an operation.
- Either model generic interactions (showing all possible paths through the interaction) or specific instances of a interaction (showing just one path through the interaction).
- Used to model and visualise the logic behind a sophisticated function, operation or procedure.
- Used to show details of UML use case diagrams.
- Used to understand the detailed functionality of current or future systems.
- Visualise how messages and tasks move between objects or components in a system.
Pros and Cons of Sequence Diagram Online
Components and Examples of Sequence Diagram Online
Components
A sequence diagram displays many concurrent processes or objects as parallel vertical lines (lifelines), and the messages that are passed between them as horizontal arrows, in the order that they take place. This enables the graphical definition of simple runtime situations.
A system sequence diagram should specify and show the following:
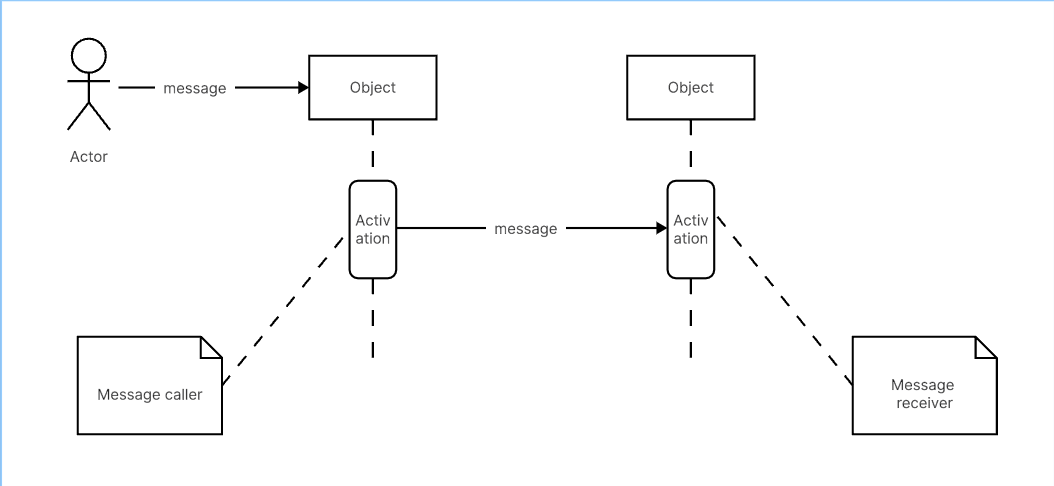
- External actors
- Messages (methods) invoked by these actors
- Return values (if any) associated with previous messages
- Indication of any loops or iteration area
Examples
Sequence Diagram for ATM Systems
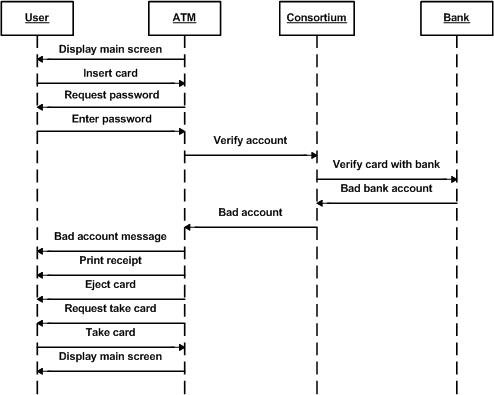
Source: Researchgate
Customers may use an ATM to access their bank accounts in a fully automated manner. By creating or examining a sequence diagram, you may look at this process's stages in a reasonable manner. The sequential sequencing of the interactions in the ATM system is shown in the example below.
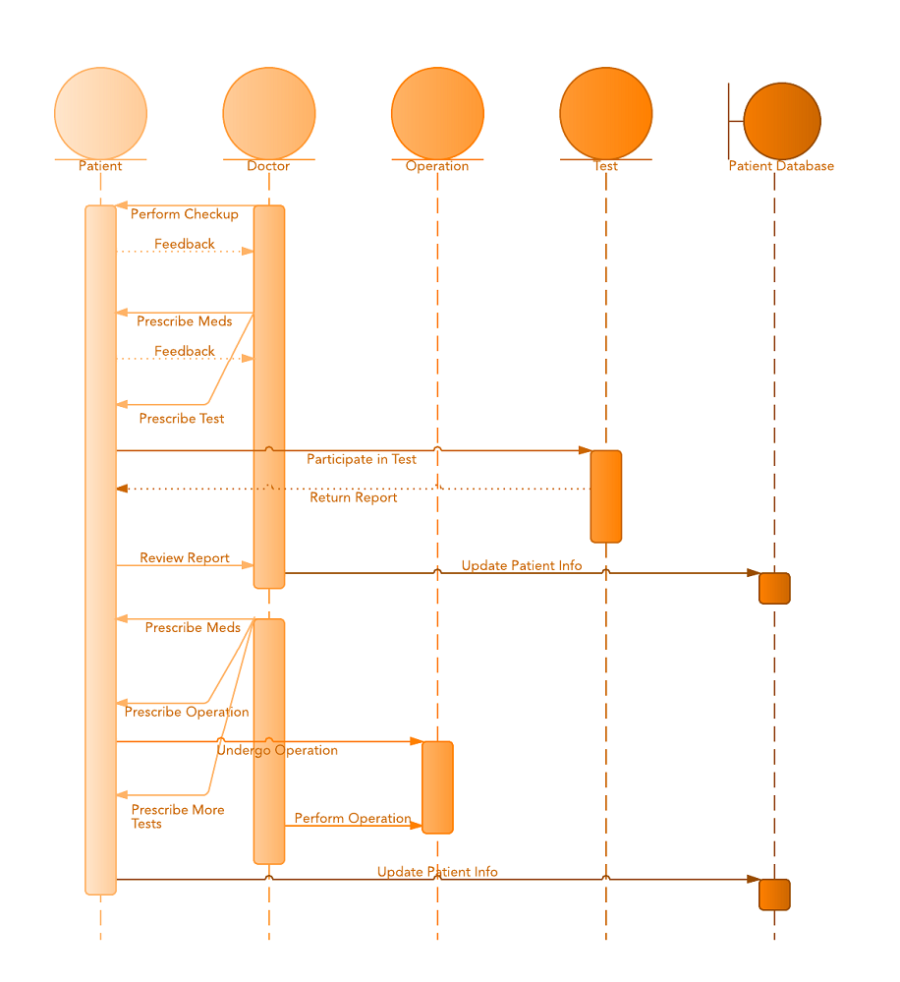
Sequence Diagram of a Hospital Management System
Source: Pinimg
Like other businesses, technology has dramatically revolutionized the world of medicine. A hospital information system, sometimes known as a hospital information system, aids medical professionals in managing all activities and information gathered at a hospital, such as examinations, prescriptions, appointments, and data about patients and their caregivers. The simplified representation of how the main processes interact with one another throughout time is shown in the figure below.
How to Draw a UML Sequence Diagram Online
All theories will be nothing without practice. After learning basic knowledge of the UML sequence diagram online, you can try to draw one by yourself.
Among various sequence diagram makers online, boadmix is definitely one of the best. It provides all your need to draw any kinds of diagrams. The whole process will be quick and easy as it presets many pre-made templates. What's more, it is a collaborative tool that enables users to work together online in real time.

Is it good? Let's see how to use it for drawing a sequence diagram online!
Add or Import Shapes
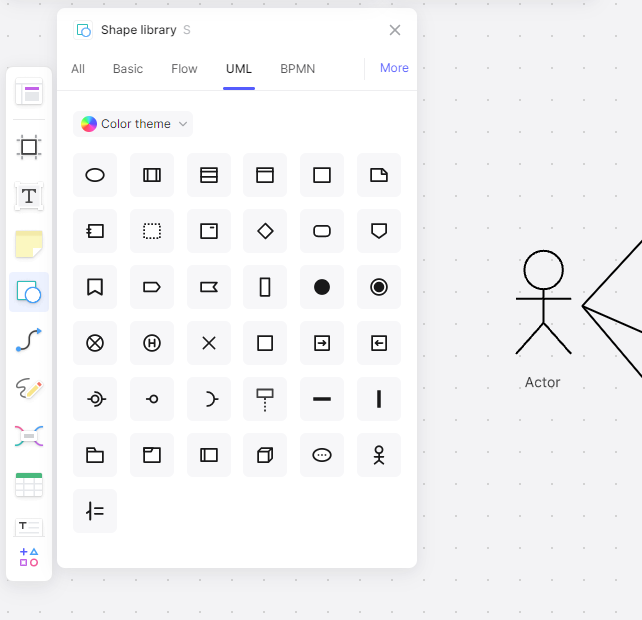
Boardmix has a shape library with all the standard shapes needed to create professional sequence diagrams. Click on "Shapes" in the Shape Library Manager to add UML shapes to your canvas.
Manually Build a Sequence Diagram
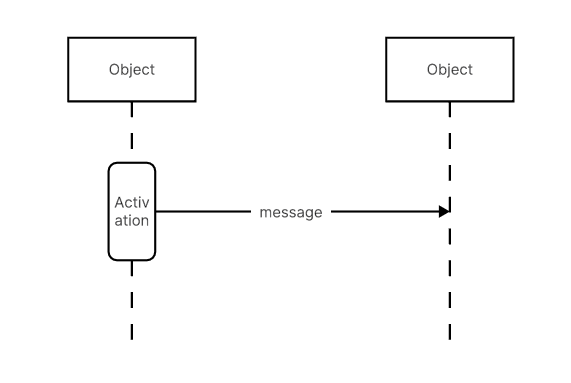
Add your shapes to the canvas with a simple drag-and-drop action. Add rectangles to the top of the canvas, one for each object, and label each rectangle with the name of the object. If the object is both external and internal to the system, you may choose to use an actor symbol instead of a rectangle. You can find this symbol in the use case diagram section of the toolbox.
Represent the flow of time in a sequence by clicking and dragging lines from the object shapes. Dotted lines will instantly appear, symbolizing lifelines. How long you make these lifelines depends on how many messages you must present in the sequence.
Add Text and Concepts to Your Sequence Diagram
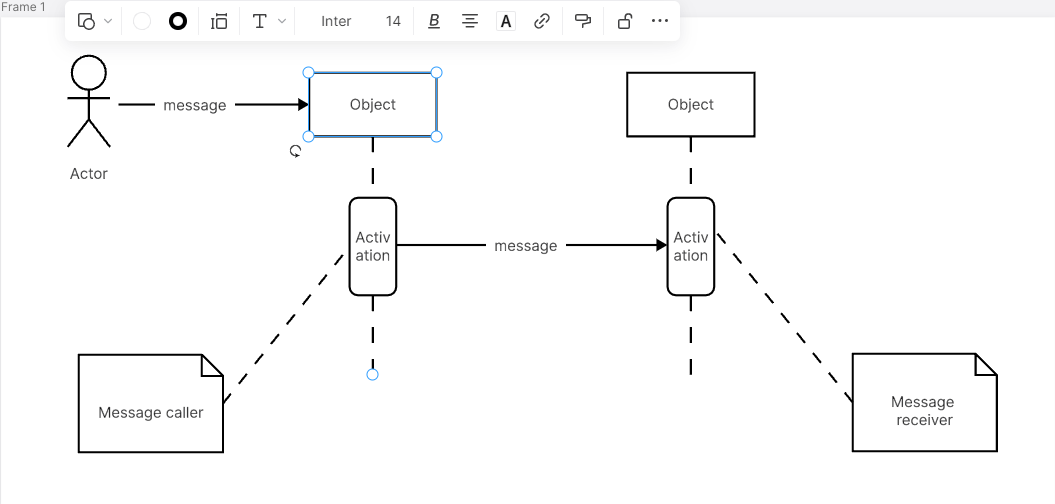
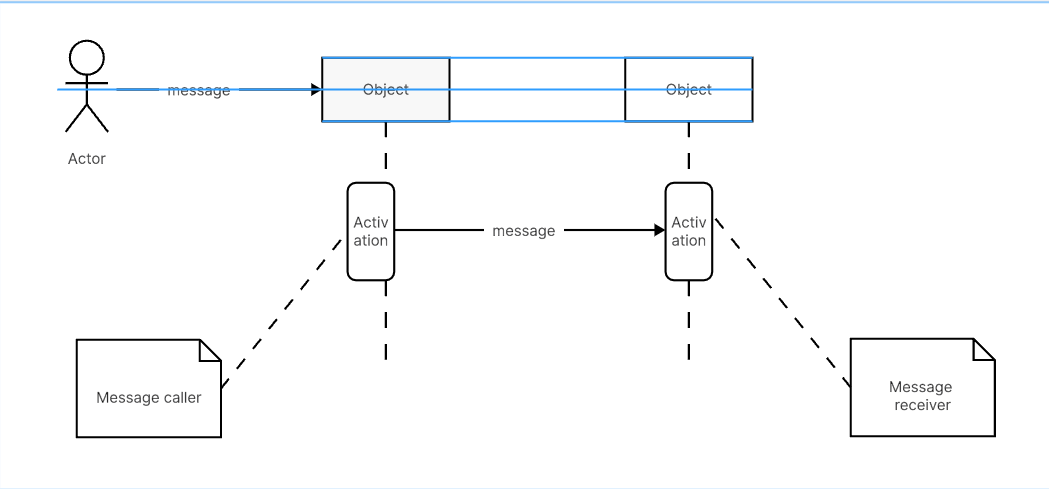
To create a message, draw out an activation box. The activation box is a long, thin rectangle. Drag it onto the dotted lifeline and adjust the size as necessary.
Once you have an activation box in place, click on the box and drag a message arrow out from it. You can label the message by clicking and typing.
Format Sequence Diagrams
Boardmix makes final formatting easy. Check that the logic is sound and that all the processes line up correctly. Although the lifelines don't show a specific timeframe, messages should always be listed in sequential order vertically.
Once you've personally reviewed the document, select and format the desired areas on the diagram. You can save time if you set your default styles before you get started with your own custom choice of fonts, line styles, and sizes.
Publish, Implement, and Share
Share and publish your finished sequence diagram from Boardmix to explain your systems clearly to others. Collaborative settings allow you to maintain full control over your diagram.
