

Every organization has a different set of processes that involve the use of multiple pieces of equipment and steps to accomplish goals. Sometimes the flow of these processes becomes complex and involves some time-wasting and less rewarding steps. This happens often during setting up a new process or when an existing process gets outdated. In such cases, it is necessary for organizations to analyze their processes and take out non-valuable activities. This is where the "Spaghetti Diagram" comes to the rescue. Therefore, let's take a closer look at what is spaghetti diagram, its benefits, and how to create one in this article.

Part 1. What is Spaghetti Diagram?
A spaghetti diagram is a process analysis diagram that provides a visual representation using flow lines to provide all the paths that an item/activity goes through in a process. In a spaghetti diagram, the flow lines represent the paths and the boxes represent the item/activity. So, the flow lines help in visualizing and identifying the redundancies in the process and letting the team find ways to optimize the flow of the process. For instance, the spaghetti chart can show a point where different flows overlap, resulting in some delays or congestion. Overall, the spaghetti diagram is a great way to pinpoint intersections or repetitive processes visually. Since the diagram looks like a spaghetti dish, that's why it's called the "Spaghetti diagram".
Part 2. What Are the Benefits of Spaghetti Diagram?
The spaghetti diagram is commonly used in the logistic, service, and manufacturing sectors. It helps in understanding the process, pinpointing the hurdles/redundant steps, and eliminating non-valuable steps to increase efficiency. Below are the main benefits of a spaghetti chart:
- It helps to visualize the complete process workflow from a single diagram.
- It helps to pinpoint repetitive, time-wasting, and non-valuable processes.
- It helps to reduce the time spend on moving non-valuable items from one place to another.
- It helps to reduce the time spend on moving non-valuable items from one place to another.
- It improves the productivity of workers.
- It helps to optimize a process, eventually leading to significant cost reductions.
Part 3. 3 Best Spaghetti Diagram Examples
A spaghetti diagram can be used to present a specific process, development methodology, manufacturing process, workplace operations, and similar others. Below are the 3 examples of a spaghetti diagram:
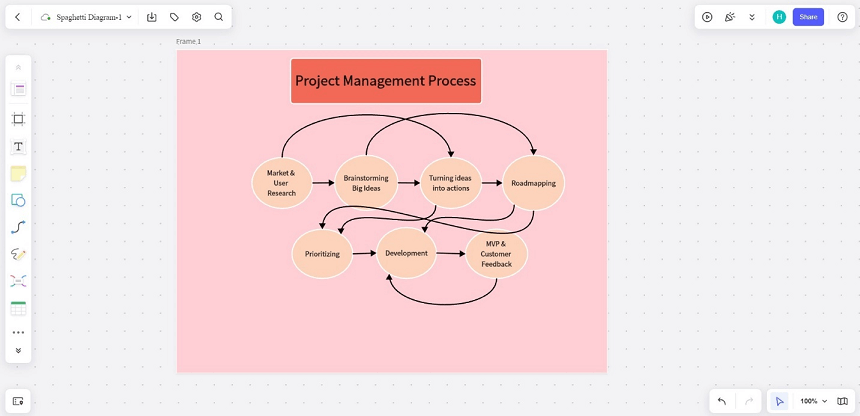
1. Project Management Process
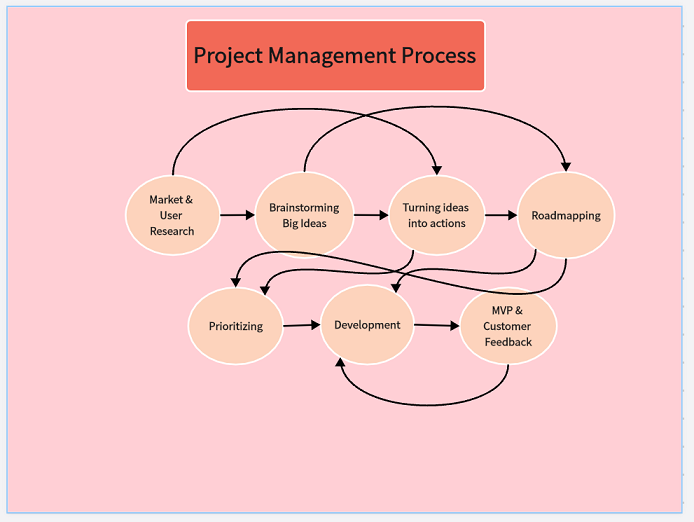
The above diagram is a project management process that involves 7 steps. Teams can follow the steps in a flow, starting from market & user research and brainstorming big ideas all the way to development and MVP release. However, teams can skip some steps to optimize their workflow, which is very well presented in the spaghetti diagram. For instance, the team after doing market & user research can directly head to turning ideas into actions.
2. Project Report
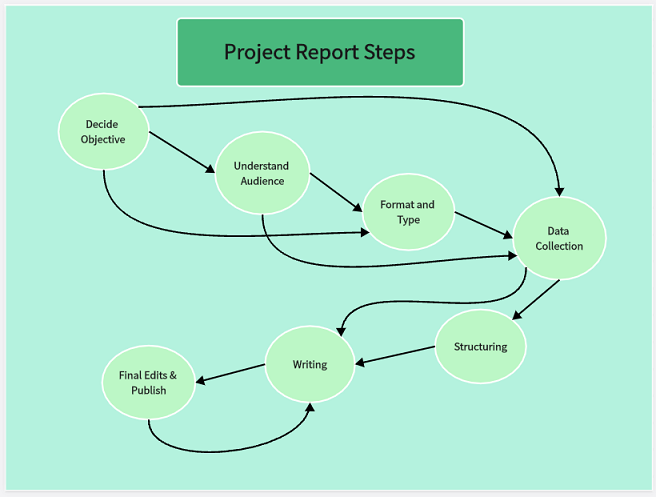
A project report is often demanded after completing a project, so it is crucial to follow all the core steps to deliver a comprehensive and valuable report to the stakeholders. The above spaghetti diagram provides a perfect glimpse of all the steps involved in creating a project report. Moreover, it also provides some steps that teams can skip to reduce the time and deliver the reports faster.
3. App Development Stages
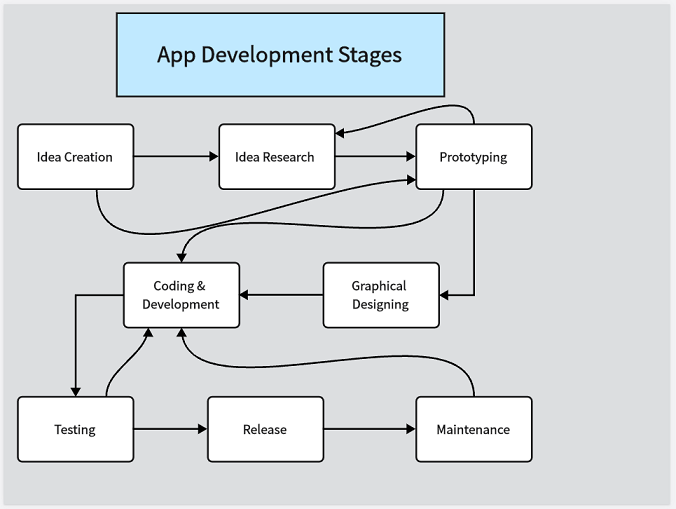
App development is not an easy task and requires the contribution of multiple colleagues. Moreover, app development is not a straightforward process. You often have to switch back to the previous stage if you find some loopholes. For example, you prototyped the app idea after doing the research, but you find some missing elements in the app. So, you will head back to the research stage to fix those issues. All these stages and reverse flows are very well explained in the above spaghetti diagram.
Part 4. How to Create Your Own Spaghetti Diagram
There are multiple tools that can help you create a spaghetti diagram, but the best and recommended one is Boardmix.
![]()
Boardmix is a web-based collaborative whiteboard that provides a simple and feature-rich toolkit for creating spaghetti and other kinds of diagrams. Its whiteboard canvas is equipped with all the needed functionalities/elements to create a spaghetti chart. For example, you can drag and drop shapes, add different styles of flow lines, change the colors of boxes and lines, add notes, and do all sets of other customizations easily with simple clicks.
Boardmix also empowers you to share the whiteboard with other colleagues and get to work on the spaghetti diagram in real-time. Moreover, it allows exporting the spaghetti diagram in various formats, such as .svg, .jpg, .pdf, .png, etc. Follow the below steps to create a spaghetti diagram with Boardmix:
Step 1. Sign up to Boardmix.
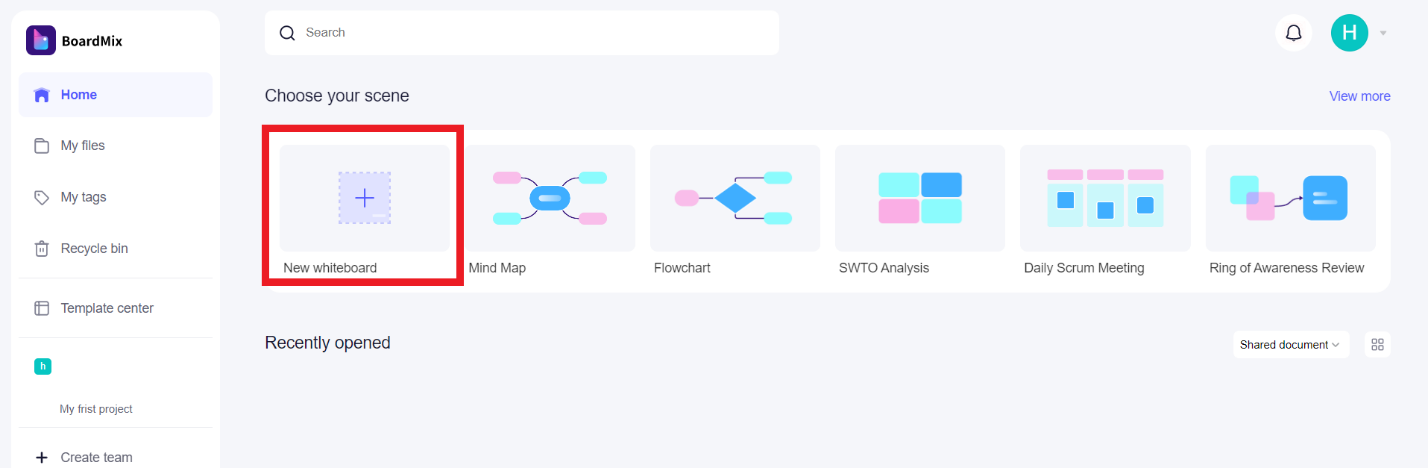
Step 2. When you are in the main dashboard, click "New whiteboard".
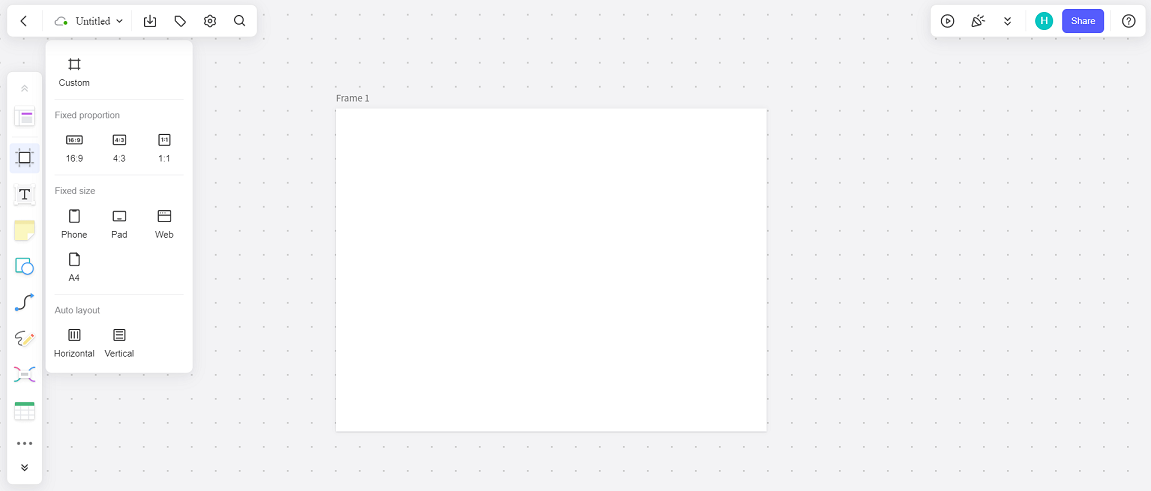
Step 3. Once the whiteboard opens, click the "Frame" icon from the left sidebar. Afterward, select its size parameter and then drag the mouse on the whiteboard to set the frame.
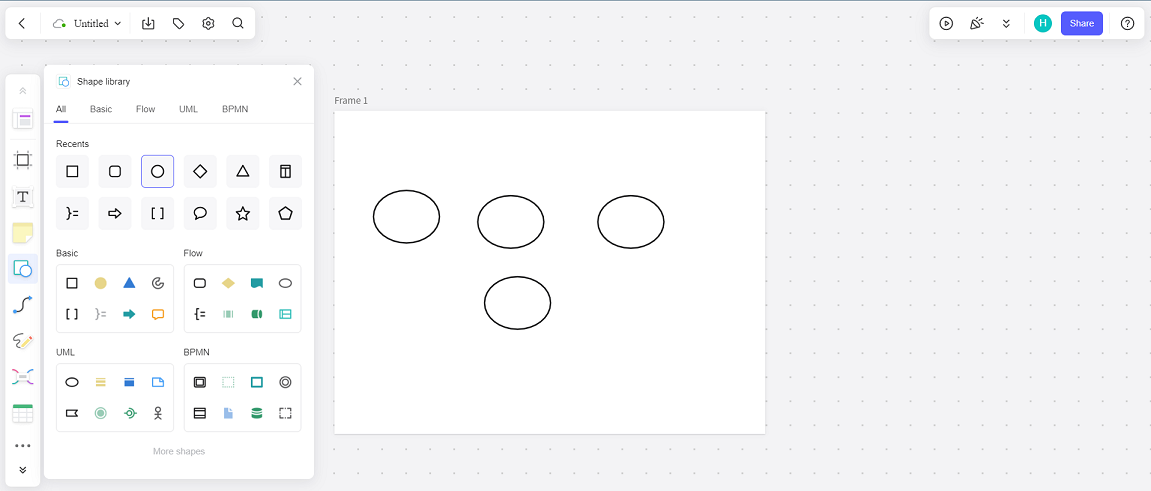
Step 4. Now you have to add boxes that represent the process/items. To do that, click the "Shape" icon from the left sidebar, pick the shape, and drag and drop that shape inside the frame. Keep adding the shapes until you have added all the needed ones.
Step 5. You have to now connect flow lines. To do that, click the connection line icon from the left sidebar, pick the line you want to use, and then connect two boxes with that line by pressing and holding the left mouse key to set the path.
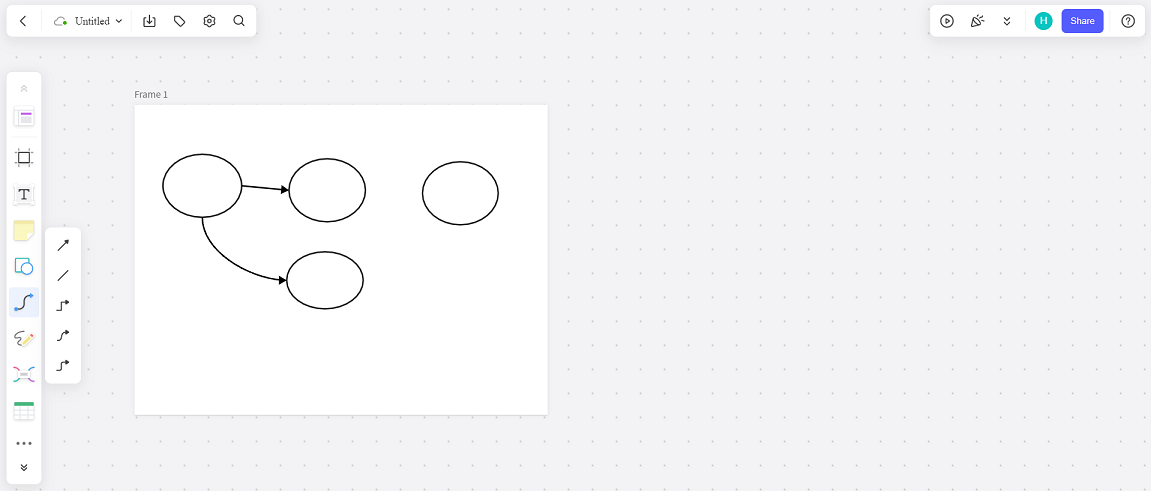
Step 6. Keep adding lines until all the boxes are connected with the flow lines. You can also color the frame and shapes for enhanced visualization. Once done, you have completed the spaghetti diagram.
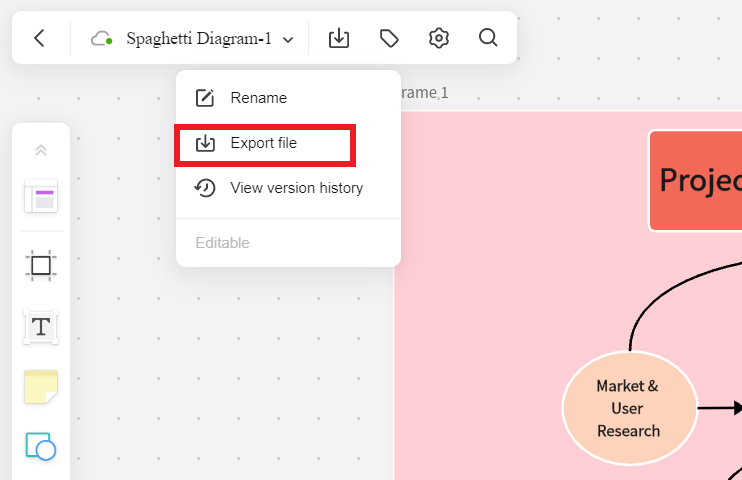
Step 7. You can even export the spaghetti chart by clicking the drop-down menu from the top left corner and then clicking "Export file".
That's it! This way, you can easily and instantly create a spaghetti diagram using the web-based whiteboard offered by Boardmix.
Conclusion
A spaghetti diagram is really handy to address processes having complex workflows. It helps to easily visualize and identify loopholes in the process and make it turn into an optimized and efficient one. So, if you are also looking to use a spaghetti chart, then Boardmix provides the best way to do so. Its intuitive web-based interface, drag-and-drop elements, and instant real-time collaboration make it really easy and instant to create simple to complex spaghetti diagrams. So, try out Boardmix right away and create your first spaghetti diagram.


