

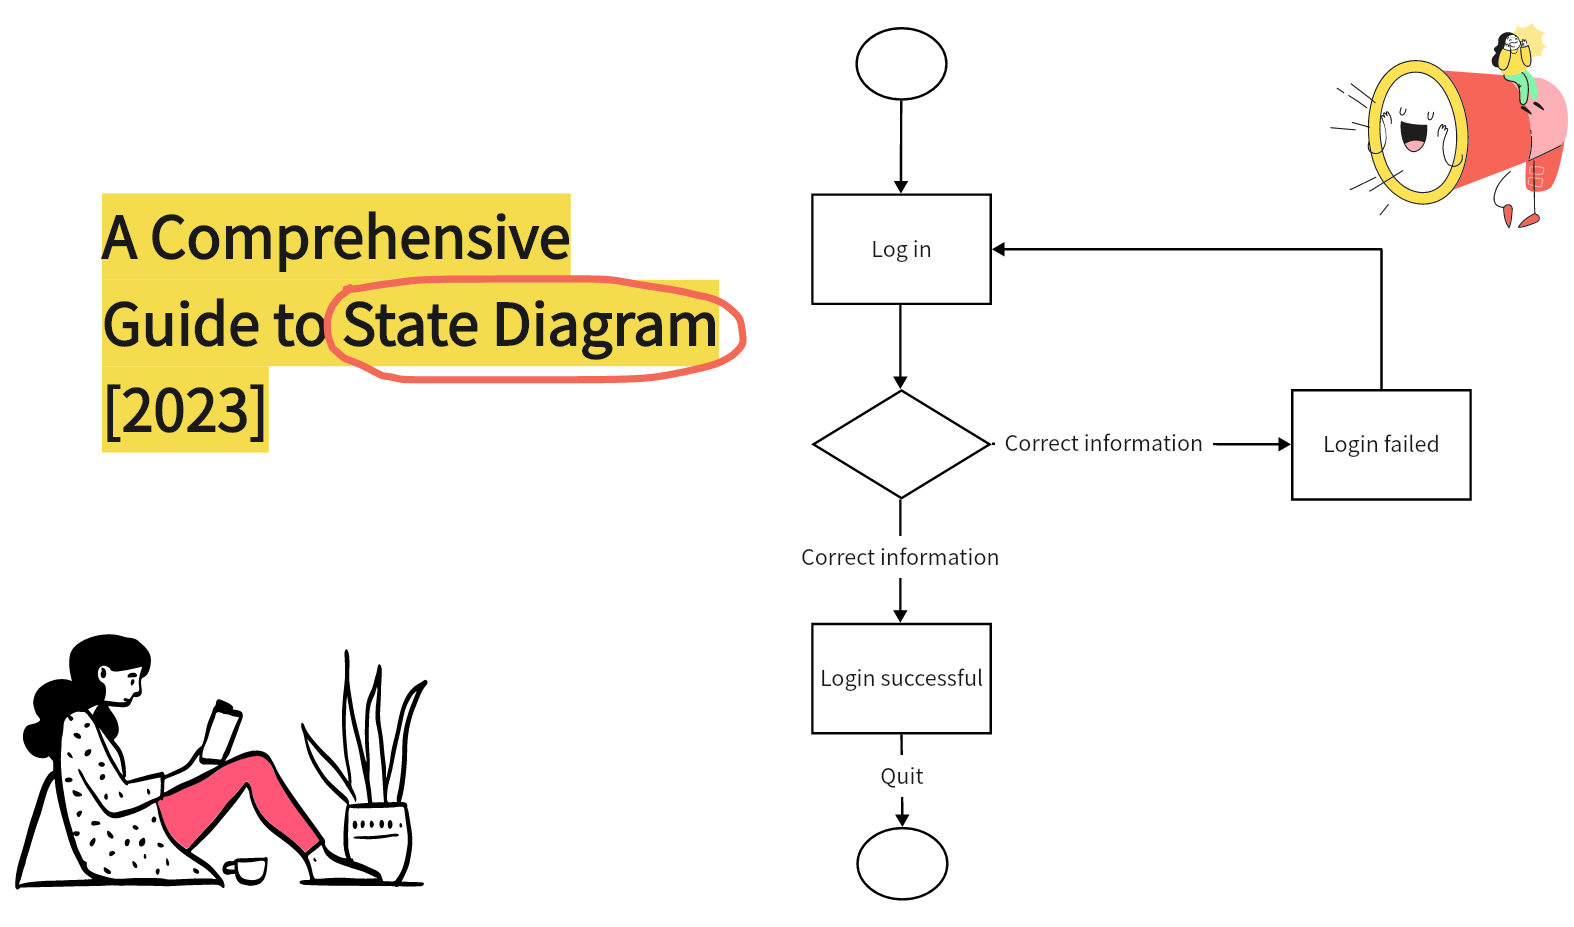
A state diagram is a type of Unified Modeling Language diagram that represents the behavioral state of your system. At first, you might find it intimidating. However, with the right state diagram online tool, you can take advantage of its many benefits.
In reality, a state diagram describes the system you are developing in a number of states, along with other transitions, events, and activities. This way, a state diagram online can create an abstract explanation of the system’s expected behavior. For this reason, it is widely used for system modeling.
If you are curious about the state diagram, below you will find all the relevant information about it. Then, you can learn how to incorporate a state diagram online into your project.
What Is the State Diagram Used for
A state diagram has become an essential tool for many teams because it excels at creating an easy-to-follow illustration of the system’s states. In essence, you can use the state diagram online for these purposes:
Visualize the System’s Life Cycle
One of the main reasons that a state diagram is widely used is to create a comprehensive visualization of the system’s whole life cycle. This practically means that you can have an illustration of every state that your system will go through for as long as it runs. This is very useful to understand and predict its behavior in each state.
Highlight the Events that Influence the System
You already know that your system isn’t in a vacuum. This means that there are events and external elements that directly influence its behavior. In a state diagram online, you can take a more proactive approach and highlight all the possible factors that can play a part in a behavioral change.
Research the System’s Responsiveness
Another amazing use of the state diagram is to create a representation of the system’s responsiveness. This is the reason why a state diagram online is often used in dynamic systems since it leads to a better understanding of the system, regardless of its complexity.
Notations and Symbols of State Diagrams
In order to understand the state diagram, you must learn the specific notations used in it. Once you gain a basic knowledge of the symbol in a state diagram online, you can interpret it or even draw one of your own.
The notations used in a state diagram are the following:
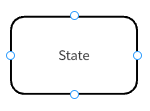
- State – this symbol represents a particular state in the system’s life cycle, which is the most important notation in a state diagram online. You can add a state to your diagram by creating a rectangular shape with rounded corners.
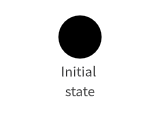
- Initial State – as its name suggests, the initial state in a state diagram is the first state of your system. It is noted as a filled circle.
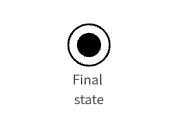
- Final State – another self-explanatory symbol is the final state, or terminator state, which indicates the last possible state in the state diagram online. It is represented by a circle that includes a second filled circle.
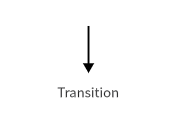
- Transition – this element represents the events that lead to a new state in the state diagram. It is notated by an arrow.
- Self-Transition – there are cases where a state isn’t affected by the event. In this case, you can use a self-transition by including an arrow that leads back to the state.
- Forks and Joins – as you draw your system in the state diagram online, you might find several states that lead to a particular state. Moreover, you might find that a single state is divided into multiple ones. You can show all these relationships with forks and joins.
State Diagram Vs. Activity Diagram
Taking a look at what a state diagram does, you might wonder how it’s any different from the activity diagram. The truth is that these two types of diagrams have some similarities, even though their main focus is vastly different.
Similarities
- They are both behavioral diagrams – in their essence, both the activity and the state diagram online are used to show a system’s behavior. This is the reason why they are both used in modeling.
- They visualize the system’s life cycle – with both diagrams, you can easily create a visualization of the system’s life cycle. This way, you can have an overview that you can refer to whenever you need it.
Differences
- They are focused on different elements – as we have already mentioned, a state diagram has a different focus compared to the activity diagram. In reality, an activity diagram focuses on the activities that trigger the system’s changes, and the state diagram online focuses on the different states that the system enters because of the event. To make things easier to understand, you can imagine that the activities in the activity diagram are that transitions in a state diagram.
- They include different details – in a state diagram online, you can view what triggers a new state in a system, while in an activity diagram, you can’t. On the other hand, on an activity diagram, you can include more details on the activities and events taking place.
How to Draw a State Diagram Online
If you know the state diagram notations and have the right tool available, you can create one in no time. Boardmix is an online collaborative diagram maker that brings you all the tools you need to create effective diagrams in a matter of minutes. Namely, it gives you access to a great library of templates and premade elements that you can drag and drop into your project. And what’s even greater about it is that you can invite your team members so that you can all work on the state diagram online in real time.

Draw a State Diagram Using Boardmix
The steps for creating a state diagram using Boardmix are the following:
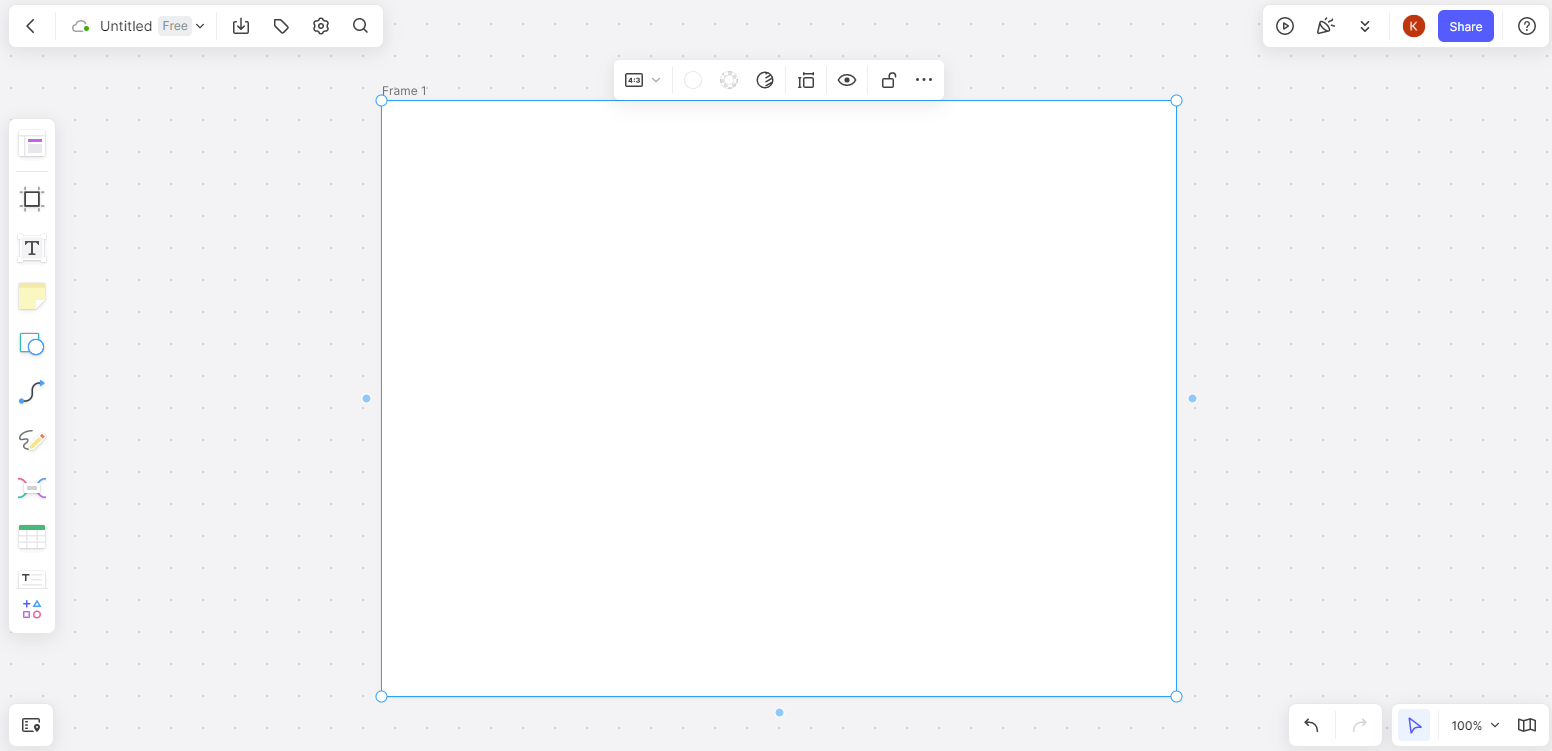
Step 1 – Create an account or log in to your existing one. Then, create a blank frame.
Step 2 – Click on the Shape icon that you will find on the toolbar at the side of your screen. There, you can find all sorts of diagram symbols and notations.
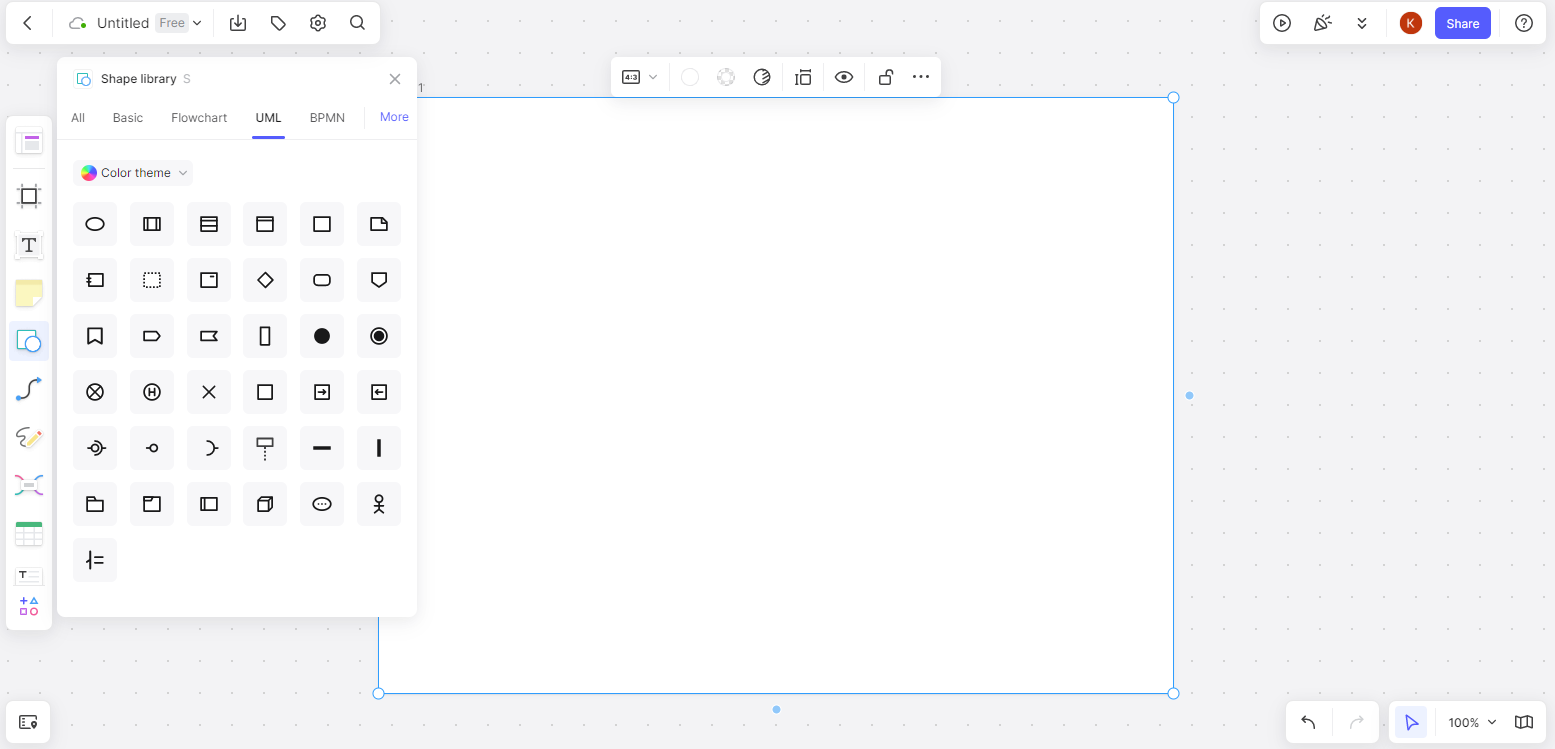
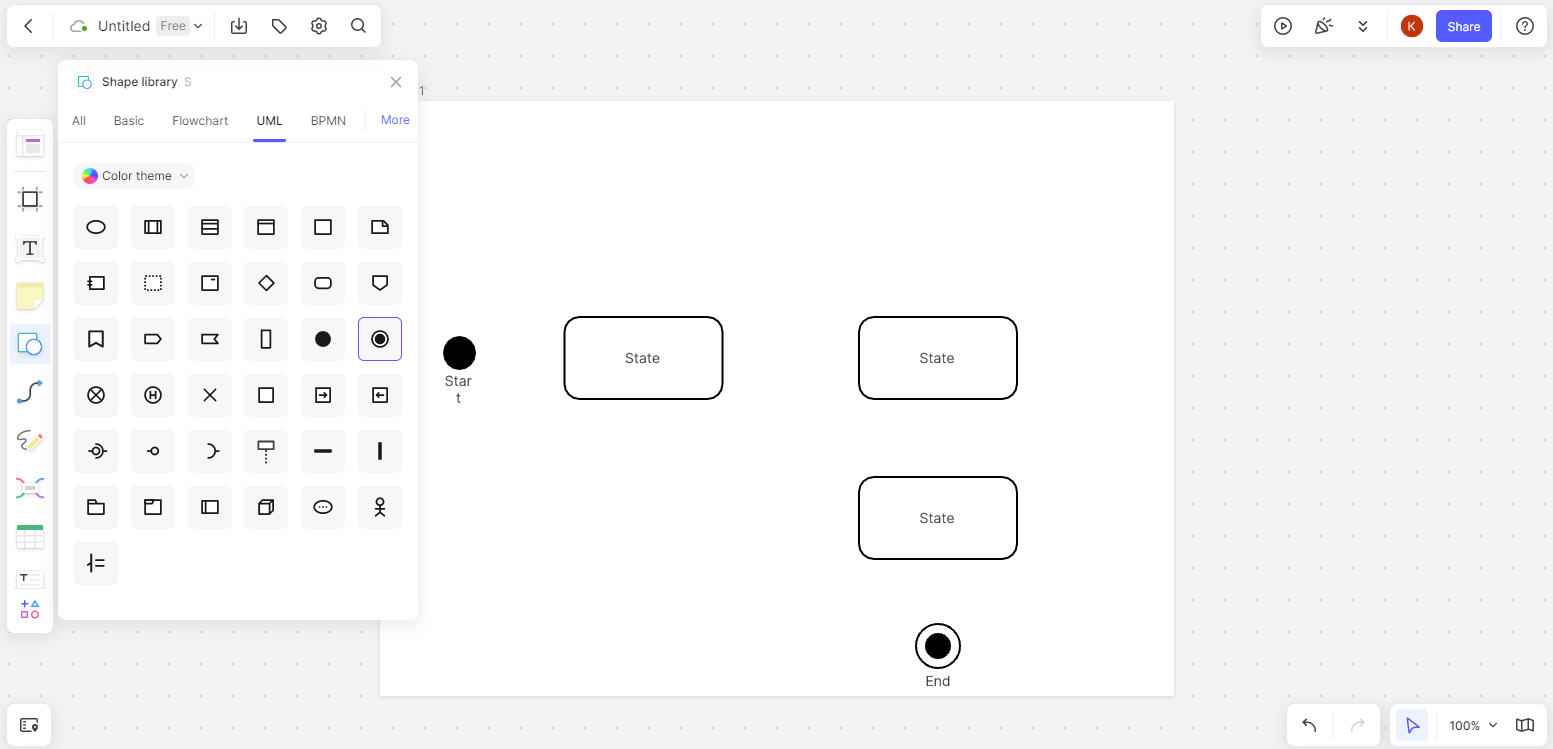
Step 3 – Select the shapes and symbols that you need in your diagram.
Step 4 – Draw the transitions between the shapes to indicate the events in your diagram. You can do that by clicking the Connection lines icon from the toolbar.
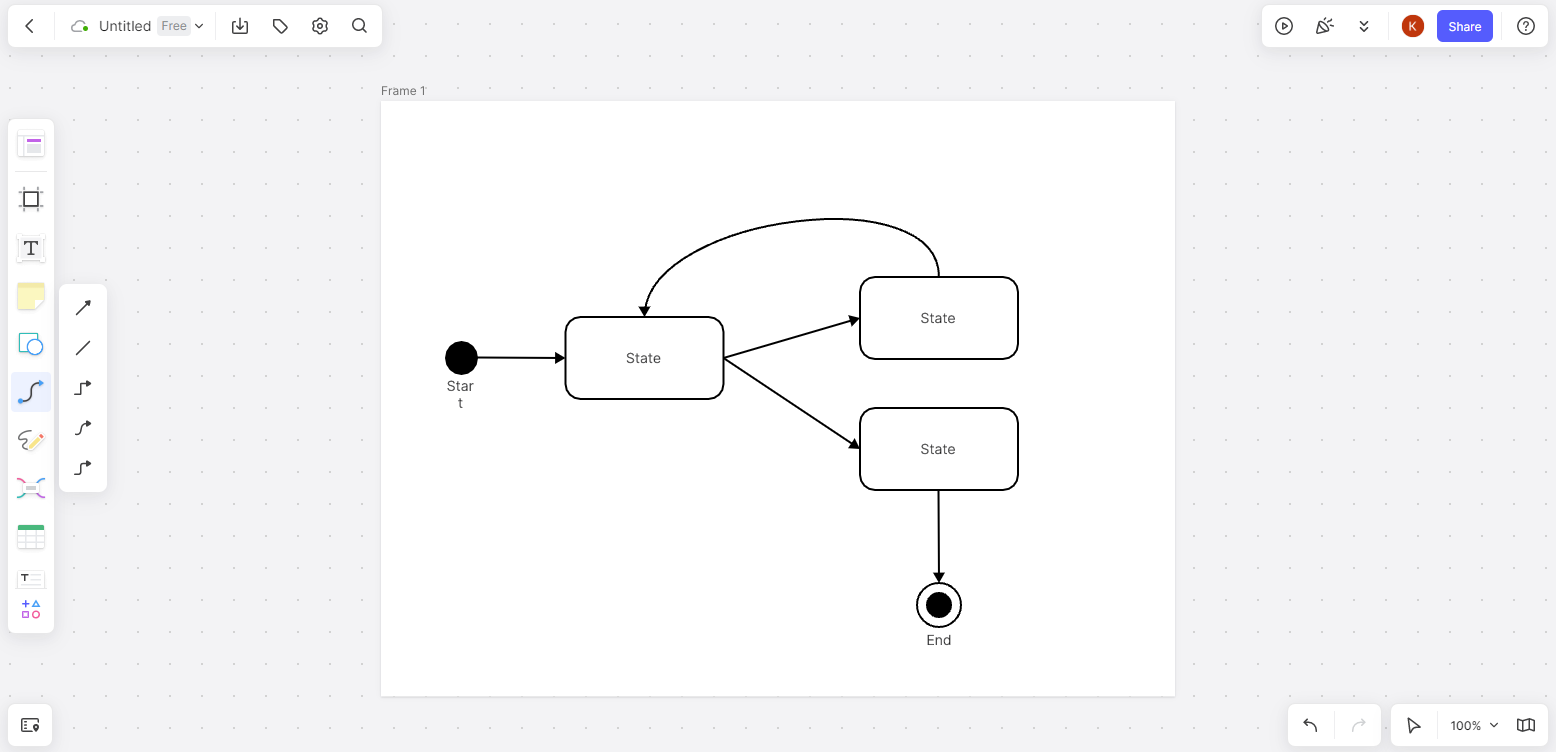
Step 5 – Notate each symbol by writing what state it indicated.
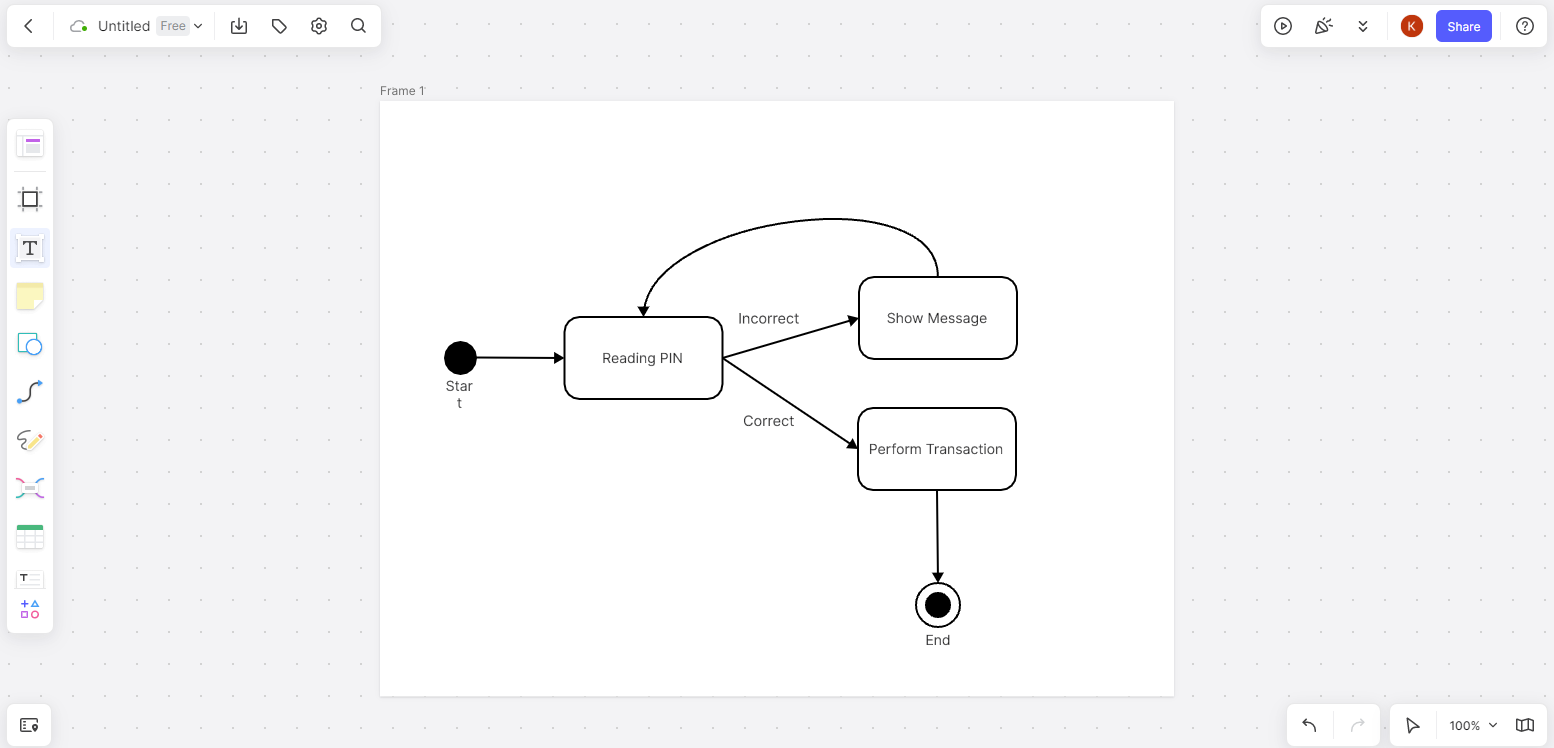
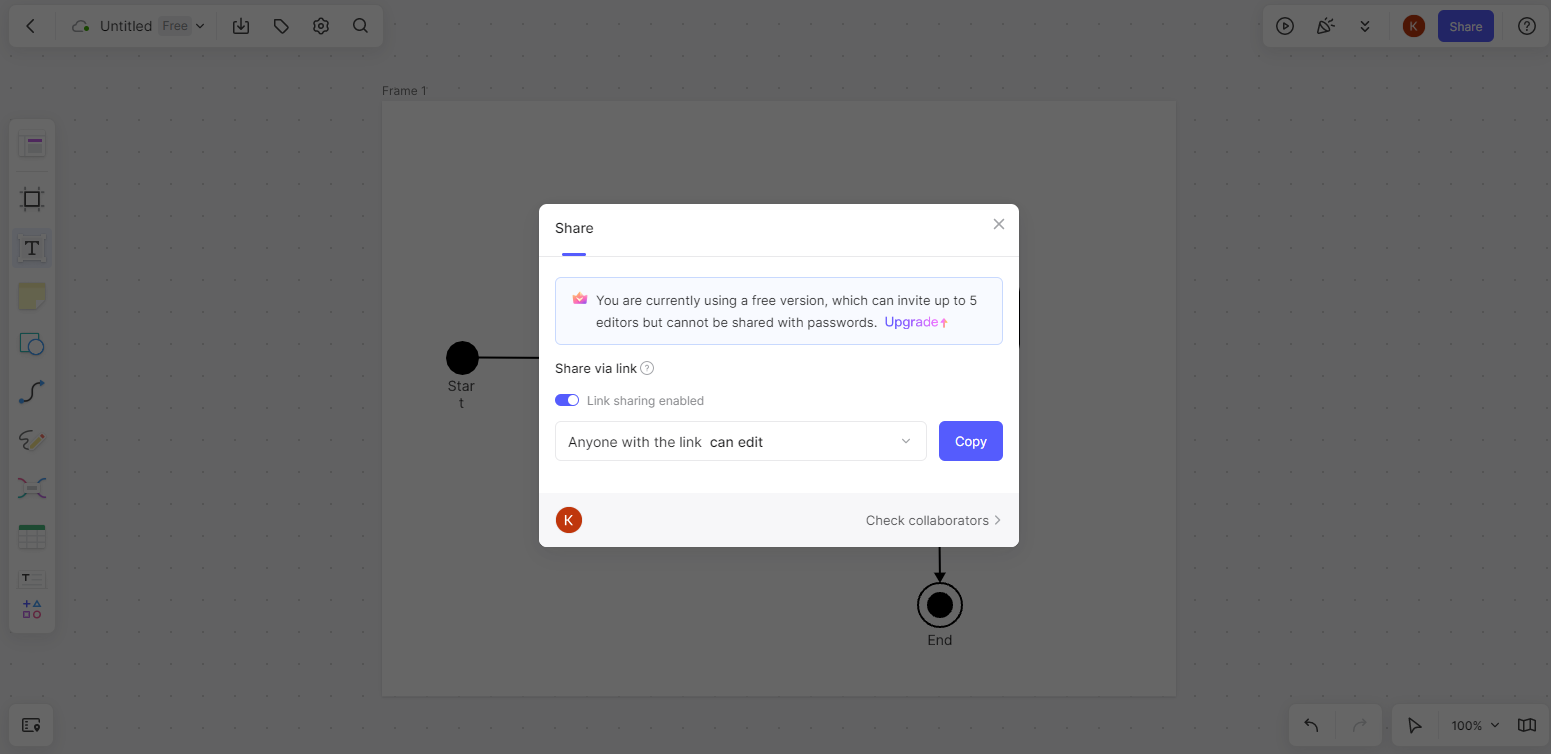
Step 6 – Share your diagram with your colleagues.
Wrapping Up
A state diagram online is a tool that will make your project flow easier and faster. With Boardmix, you can now create efficient diagrams that your whole team has access to. This way, you can highlight every state that your system is going through. At the same time, the collaboration of your team can identify potential issues, a thing that will boost your team’s overall productivity.


