

If you want your team to get a clear picture of a complex idea in a short amount of time, a system diagram can help! Keep reading to discover everything you need to know about system diagrams.
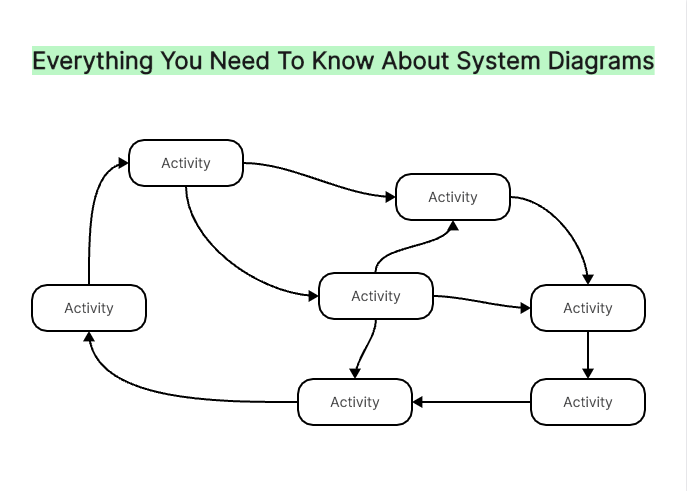
What Is a System Diagram
A system diagram is a visual representation of a system, showing the relationships and interactions between the components of the system. You can use this diagram to understand, design, analyze, and document a process.
System diagrams typically show the components of a process, including the hardware, software, databases, and people involved, as well as the communication pathways between them. They also show how information is exchanged between the components and how they interact with each other.
You can use a system diagram for many different purposes, like understanding a system's architecture, creating system designs, troubleshooting problems, and creating user documentation.
System diagrams can be created using several different tools and techniques, including flowcharts, UML diagrams, and even whiteboard diagrams. You can also use these diagrams to show how a system is organized, how it works, and how it is expected to perform.
Which Situations Need a System Diagram
Whether you're examining a physical system, a social system, or an organizational system, system diagrams can help. For example, these diagrams are great for analyzing the structure of a company, the functioning of a machine, the flow of information in a computer program, or the dynamics of a network of people.
You can also use them to analyze the interactions between different components in a system, such as the relationships between departments in an organization or the flow of energy from one element of a machine to another. They are also useful in identifying potential problems or areas of improvement in a system.
Many people use system diagrams to identify the most efficient way to complete a task. By mapping out the relationships between components, it can be easier to identify the most efficient path to completion. This can be especially useful when optimizing an organization's workflow or troubleshooting a machine.
These charts are also fantastic for planning and designing new systems, as they can help visualize the relationships between components and identify any potential problems.
Components and Examples of System Diagrams
Components
A system diagram comprises various components representing different parts of a system, allowing you to see a simplified view of a system. These components include:
- The purpose: what you are trying to visualize on your diagram.
- The system boundary: this is usually a rectangle that separates the use cases that are internal from the external ones.
- Inputs: the components that provide the data, information, or materials that enter the system.
- Outputs: the components that produce the results of the process.
- Subsystems: the components that perform operations on the inputs to transform them into outputs.
- Feedback loops: causes output from one part, eventually influencing input to the same part.
- Information sources: provide the data, information, or materials that are required by the system.
- Storage devices: stores the data, information, or materials the system needs.
The system diagram can show the flow of data, information, or materials through these components. Understanding the components and their relationships makes it possible to identify potential system weaknesses and make corrections to improve efficiency. You can also use the system diagram to identify areas where additional resources or components may be needed.
Examples
System diagrams are typically created to draw attention to the external factors that must be considered when developing a complex system. No matter how you set up your system diagram, this can be a great tool to ensure that everyone is on the same page and clear about the objectives and responsibilities of each part. The system diagrams below show the internal and external entities that could impact or interfere with the system.
Example1: Hotel Reservation System
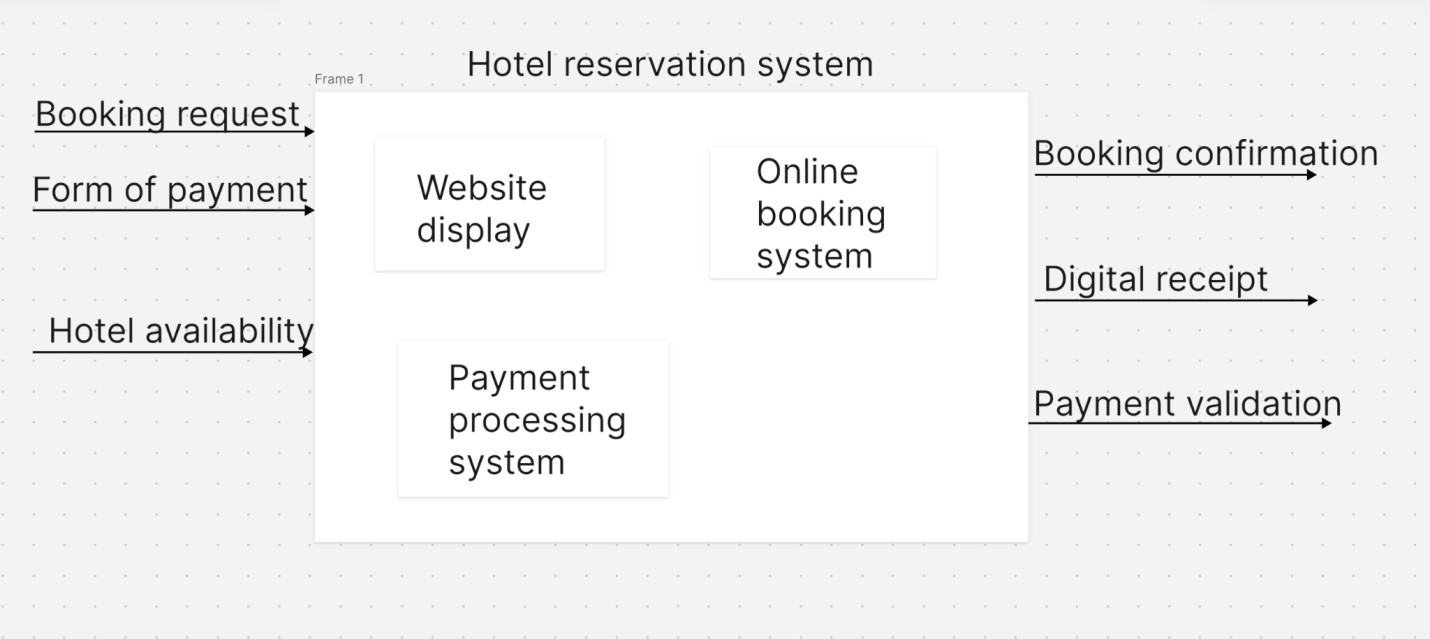
Developing an online sales system can feel overwhelming and complicated, but a system diagram is perfect for conceptualizing big ideas such as this one.
The example below shows the requirements of an online system for hotel reservations. This system stores and distributes hotel information, enabling hotel managers to manage sales and online marketing digitally. Through this system, hotel personnel is aware that it is their responsibility to upload the room rates, and room availability, and accept online payments.
Inside the box, you’ll see the components of this system that will transform this idea into a reality. The hotel will need to make sure they have an efficient website display, online booking, and a secure payment processing system.
This diagram can allow hotel staff to visualize the necessary components while creating this system. This “big picture” will help the hotel ensure that they hire the right developers and have a common goal in mind, which is essential while developing an online sales platform.
Example2: Sales Order System
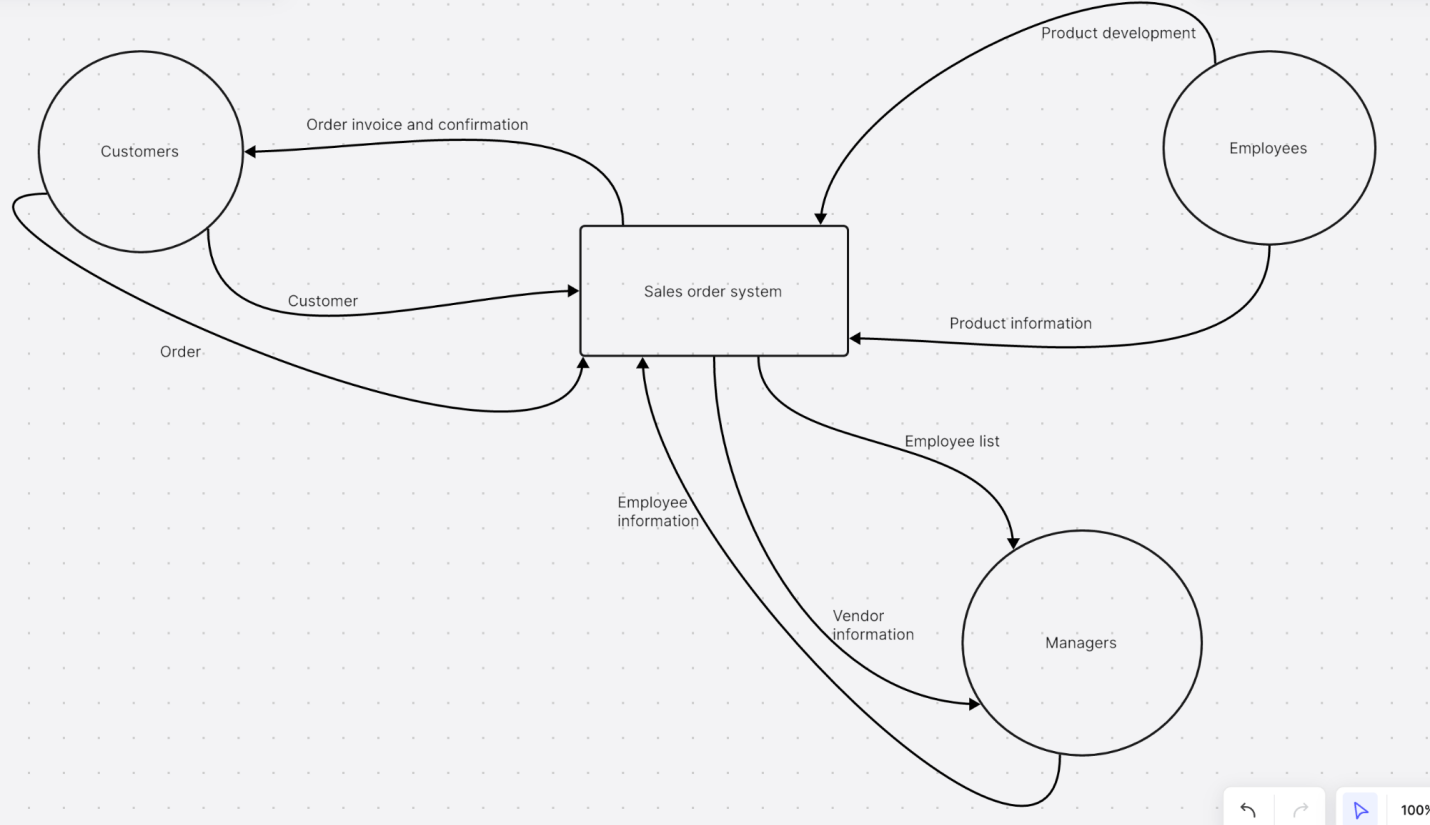
The example below visualizes a bird's view of a company’s ordering system. As you can see from the diagram, this system relies heavily on input from managers, employees, and customers. While many system diagrams are in the shape of a box, the organization of this flow chart makes it a little easier to see the input and output of everyone involved.
This kind of example would likely be created at the beginning of the project to determine the scope, goals, and what each person is responsible for.
This sales system starts with the employees developing products and then putting that information into the system so customers can access that information while shopping. The customer then inputs their order, with the system sending them an invoice and order confirmation.
Managers receive information on the employee in charge of that customer’s service experience and vendor information for that particular product. Managers also put in each employee’s information so the system can assign an employee to each order.
How to Draw a System Diagram
With Boardmix system diagram maker, creating a system diagram is easier than ever! Check out the steps below to learn how it works.

-Gather your team and identify the components of the system and their relationships.
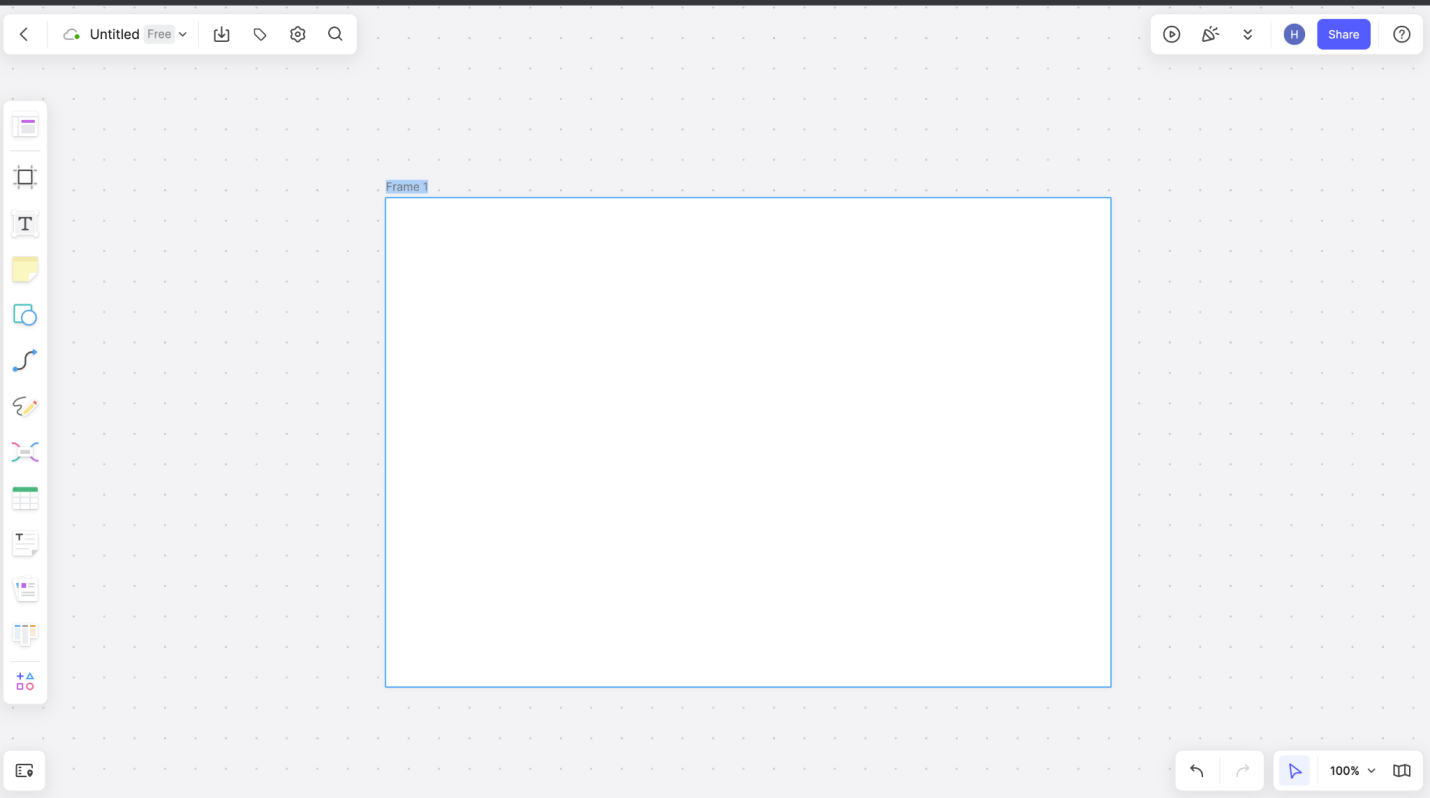
-Draw a large box in the middle of the blank whiteboard – this will be your system boundary. You can insert this box by clicking the frame button on the left side of the screen.
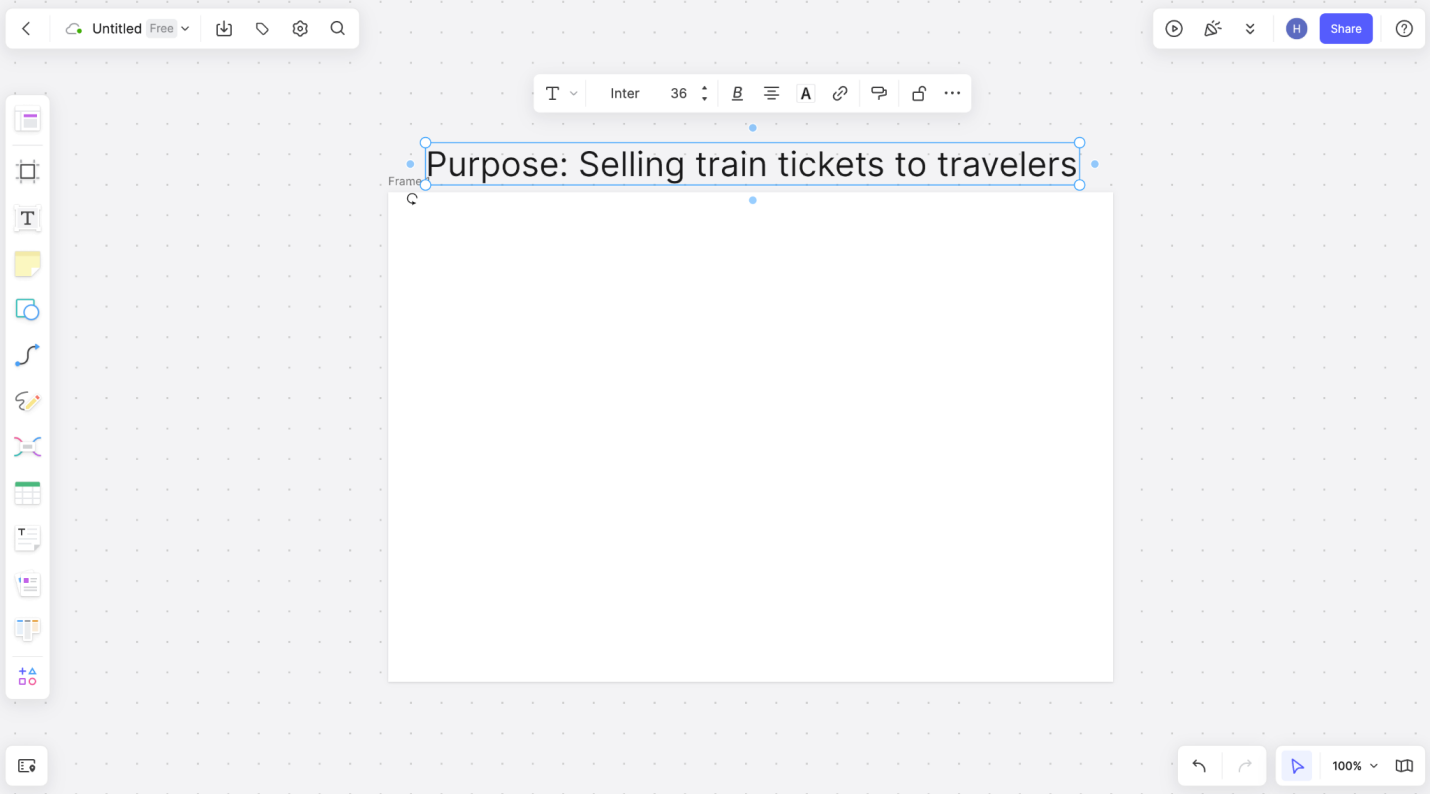
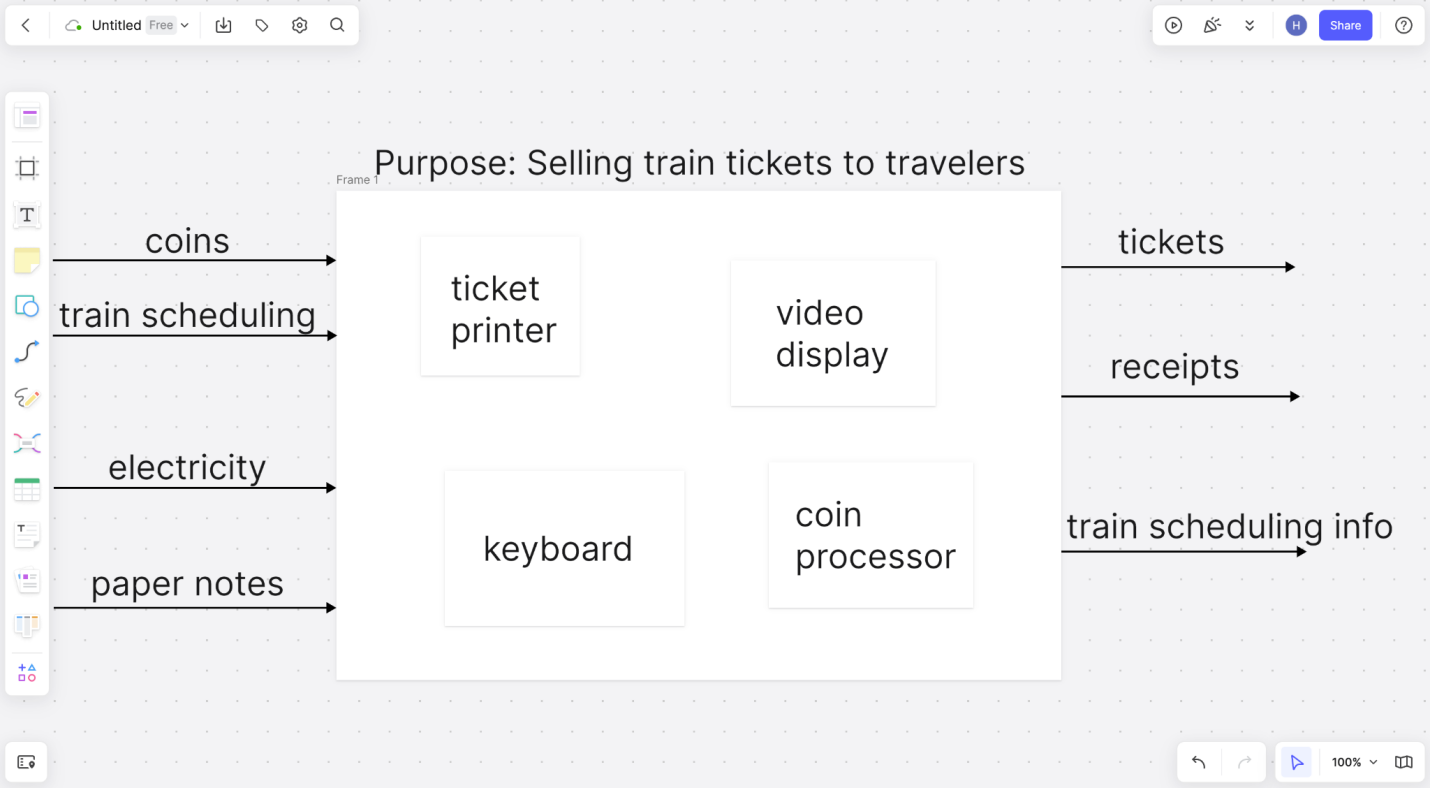
 -Define the main purpose with your team with one brief sentence, and write this above the box. You can insert a text box by clicking on the text button on the left side of the screen.
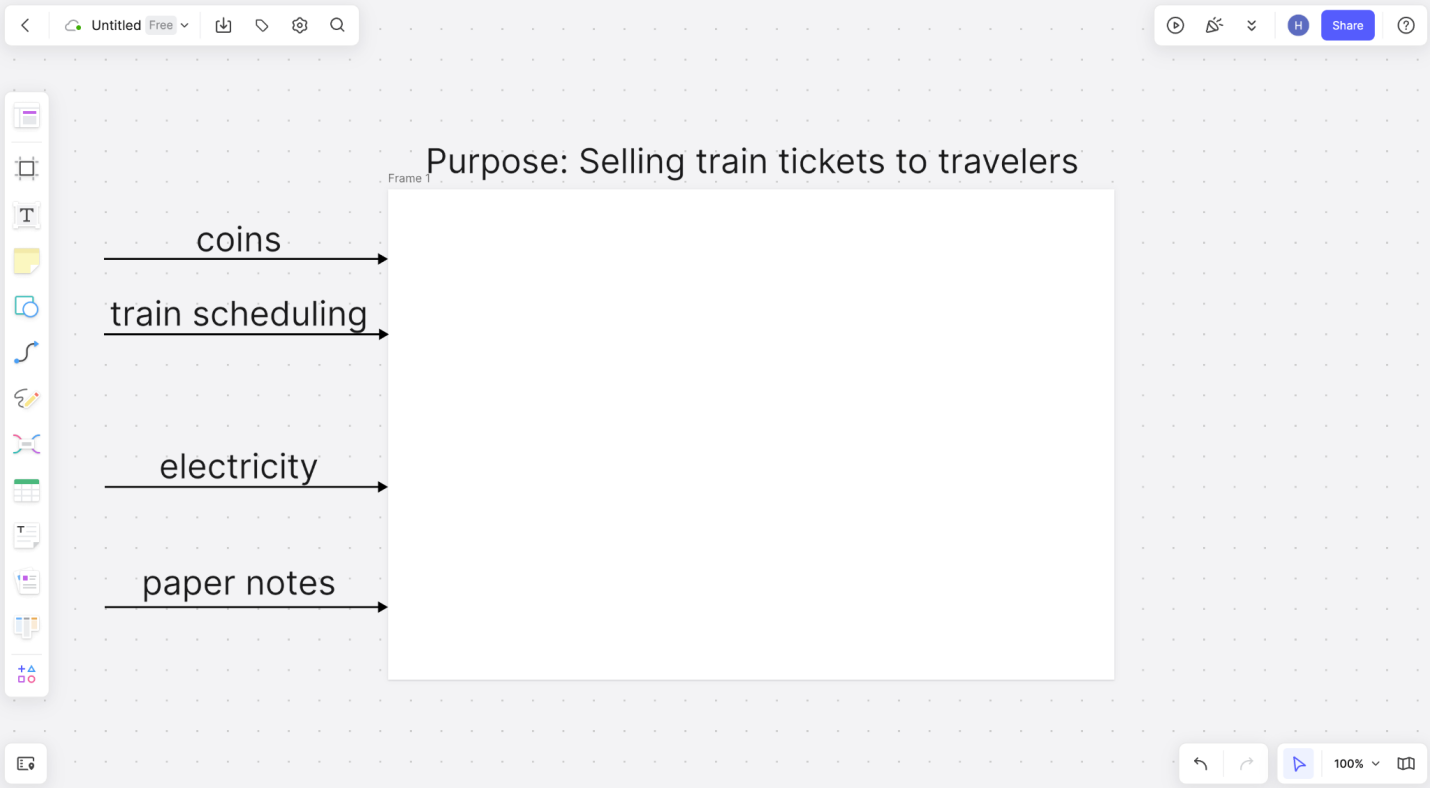
-Define the inputs that the system will receive from external factors. You can represent these inputs with arrows, which you can insert via the connection line on the left side of the screen. Be sure to label these by using the text box.
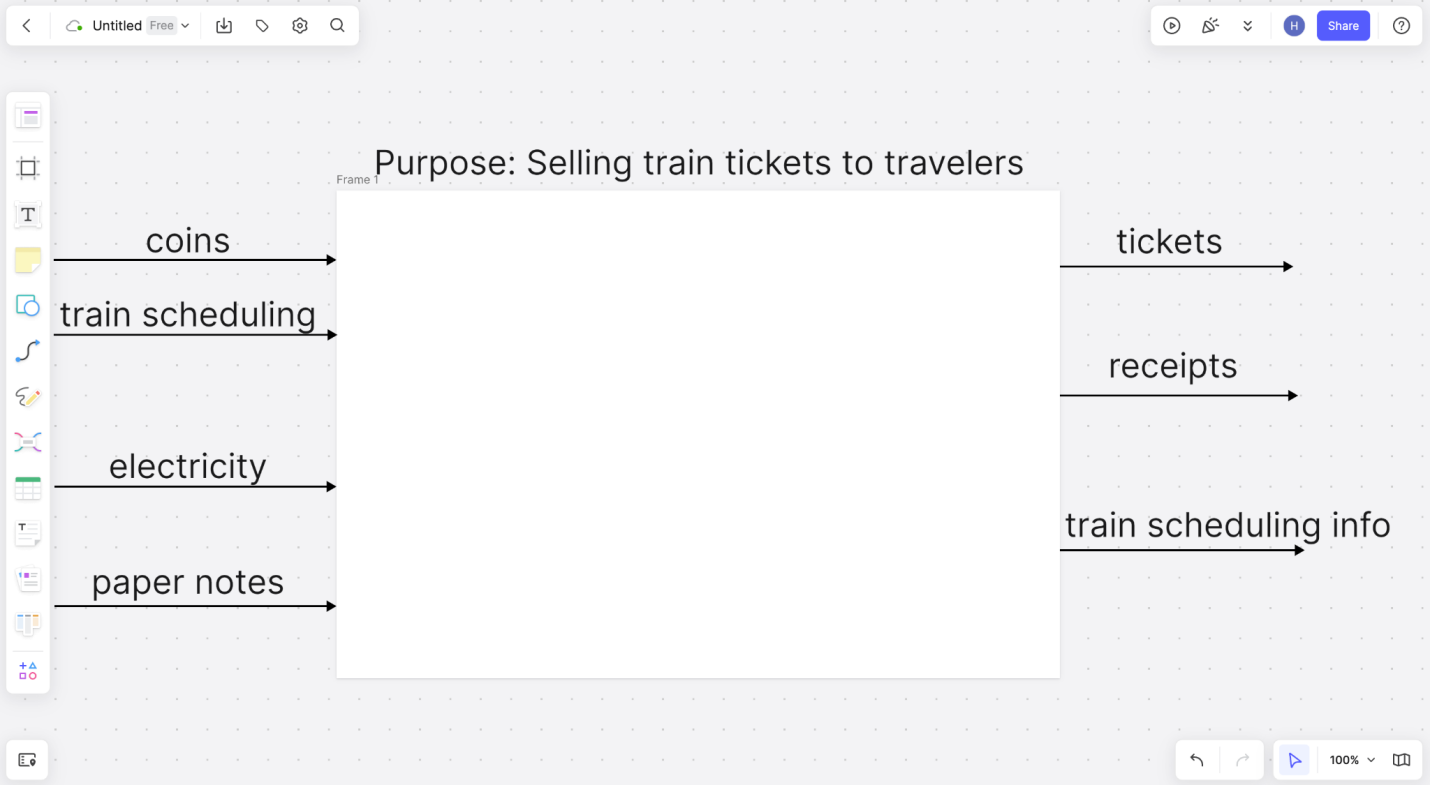
 -Define the outputs that the system will provide. You can represent the outputs with arrows on the other side of the box, found on the connection line button on the left side of the screen. Label these by using the text box.
 -Determine the subsystems within the boundary – this usually includes process inputs. You can insert these by clicking the frame button, then labeling them by using the text box.
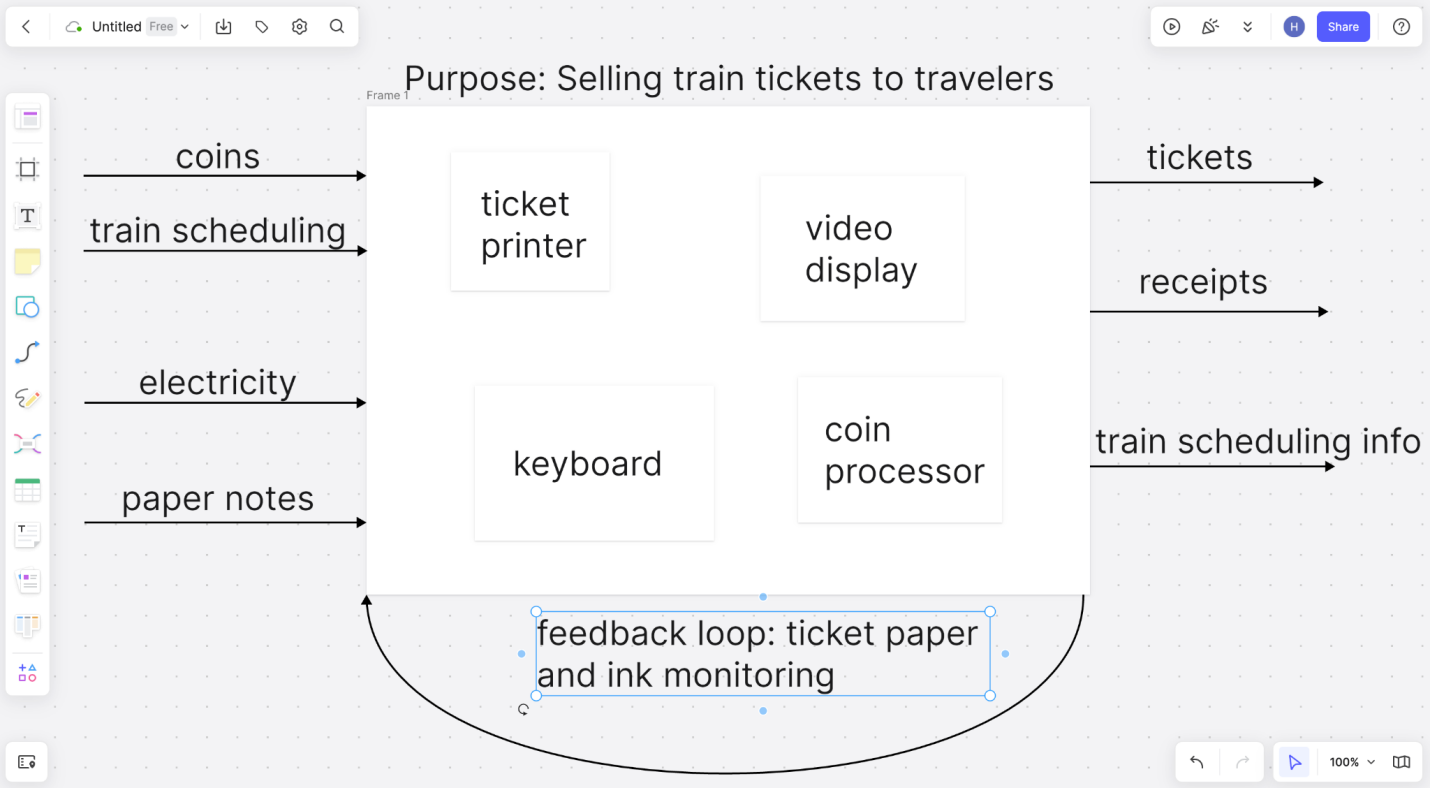
-Determine the feedback loops the system has in place and how it responds to changes in its environment. Insert this curved arrow at the bottom by using the connection line feature, then label it by using a text box.
It's that simple! To create stunning and powerful system diagrams, check out Boardmix today!


