

A value stream mapping is important for organizations that are following a lean approach in their operations and looking to maximize customer satisfaction and retention.
Moreover, it is an essential component that helps in minimizing waste and utilize scarce resources efficiently. Hence, several teams would like to get insight and devise an effective strategy by creating a value stream map. However, drawing a value stream map can be intimidating if you do not know what tools to use.
So, in this blog, you will know how to do value stream mapping in excel and also explore a bonus tool that can help you draw value stream maps with ease. Let’s get right to it then.
Part 1. What is Value Stream Mapping
Value stream mapping or VSM for short is basically a tool that consists of a flowchart illustrating various steps in the process. This tool is denoted as the lean approach of reducing waste or redundant processes and making operations efficient to provide better customer value.
The lean approach was first practiced by Toyota Motor Company after they implemented the practice in their manufacturing process and soon inspired other industries worldwide.
The value stream map can optimize the value of both products and services and helps organizations to understand their business capabilities and work around to achieve customer satisfaction.
There are two types of value stream maps—current state and future state. The current state typically determines how the process currently looks like. When it comes to the future state, it mainly focuses on how the process will look after a few iterations.
Usually, teams conduct a three-day event known as the Kaizen Kick-Off to determine the current state and develop future iterations. They usually plan it by
- Determining the process family.
- Drawing the current state value stream map.
- Assessing the need for improvements.
- Drawing the future state value stream map.
- Finally, developing iterative plans to reach that future state.
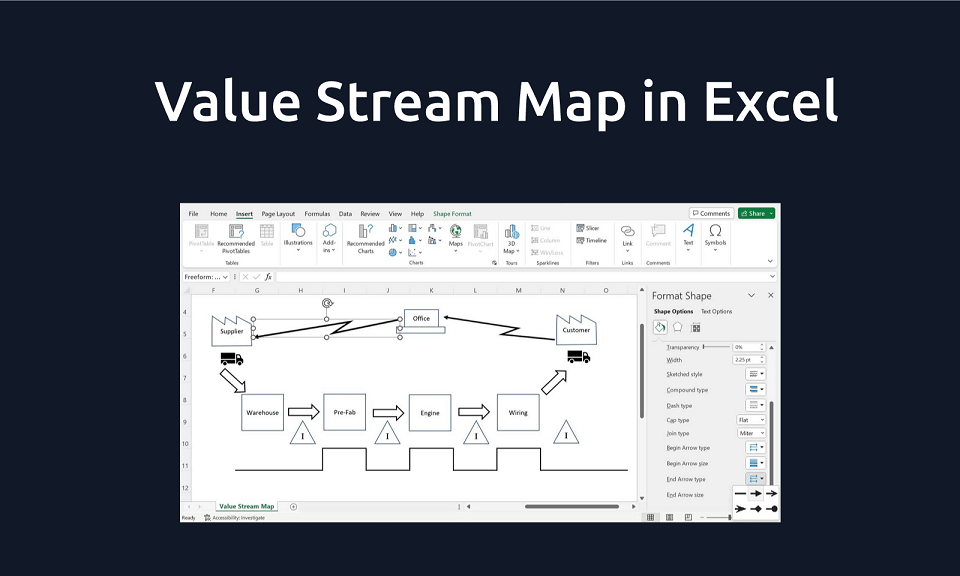
Part 2. How to Draw Value Stream Map in Excel
That’s for all the theoretical knowledge regarding value stream maps. Let’s get right into it and see how you can create a simple value stream map in Microsoft Excel.
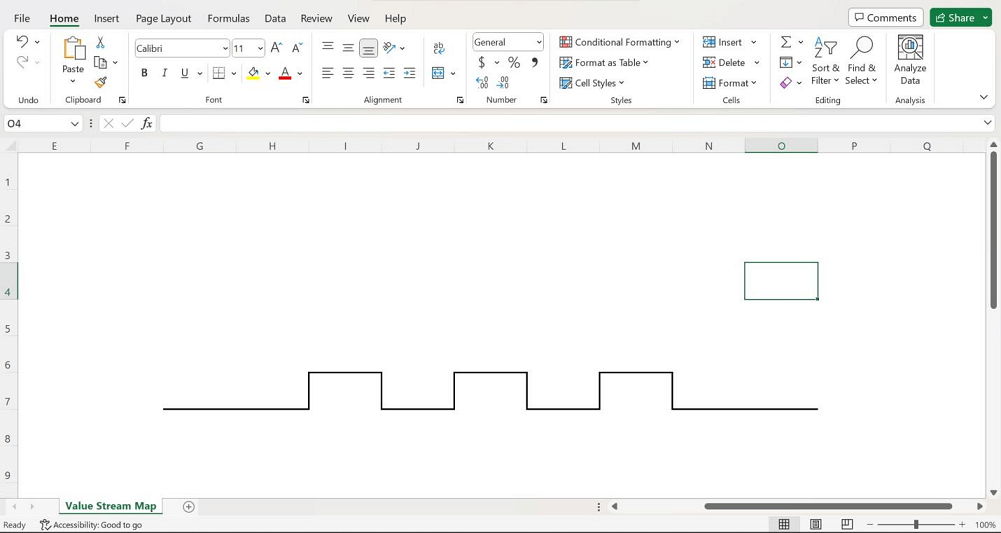
Step 1. Open a new spreadsheet file and head over to the Page Layout tab under the Gridlines column, tick off the view option so that there are no gridlines in your spreadsheet and you get a blank page.
Step 2. Adjust the column width and row height by selecting the entire spreadsheet and right-clicking in appropriate sections and adjusting the dimensions accordingly for seamless drawing.
Step 3. For adding value-added and non-value-added time illustrations, simply head over to the Borders section and insert borders to make your crests and troughs. You can change the weight of the line to make it bold.
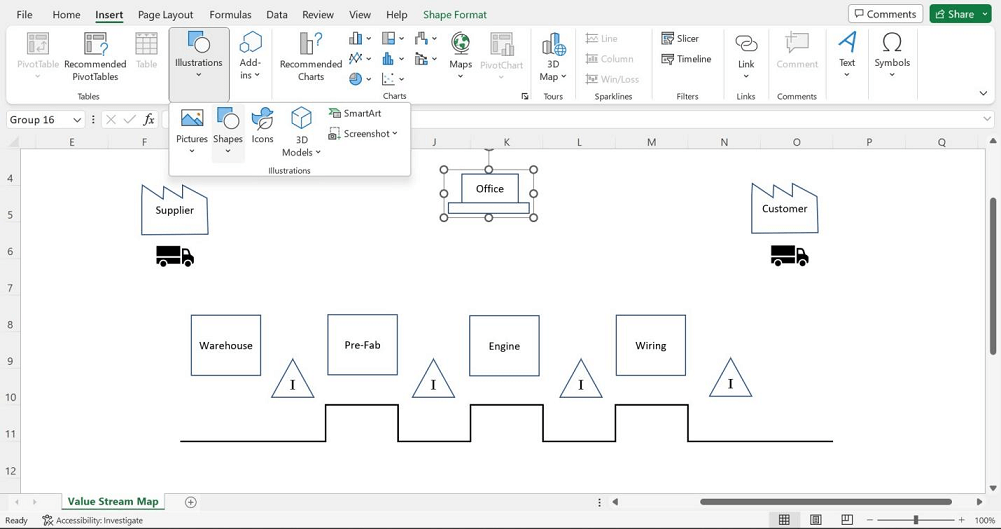
Step 4. Next, let us add some shapes for our value stream map. Head over to the Insert tab and under illustrations, we are going to use shapes. For processes, you can use a simple rectangle box and place it in the spreadsheet. You can format the color and also enter the text labeling the process.
For representing suppliers and customers, the shape is quite different so use the Freeform: Shape option under shapes and you can draw that icon freely. You can do this for all other shapes that relate to your value stream map requirements.
For representing inventory, you can simply add a triangle shape to the spreadsheet and label it with the letter I. And for a truck icon, you can go under Illustrations and click on Icons and search for a truck icon to place in the spreadsheet.
Step 5. Finally, we only have to add some directional flows to the value stream map. For the electronic flow arrow, you can use the Freeform: Shape tool again. Freely draw a zig-zag type of line and modify the line by editing its weight and color. Then, right-click and go to format shape. Under the format shape box, you get an option to add an end arrow to make it illustrate a proper electronic flow.
For a regular flow, you only need to insert a regular Block Arrow which you will find under the shapes section. Explore the tools and insert many directional arrows as you want for your value stream map.
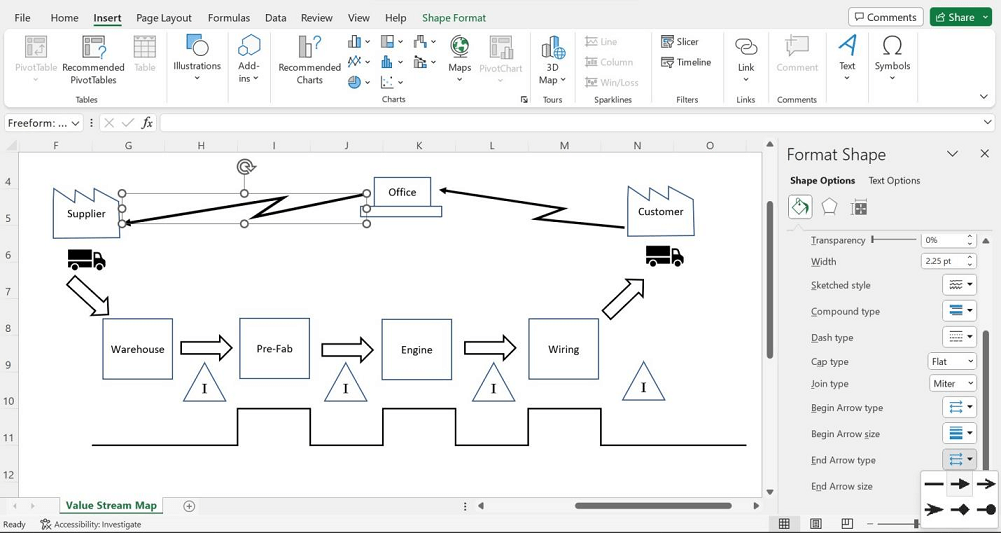
And there you have it. You can create a value stream map manually in Excel by using its tools. However, there are a couple of disadvantages to using this method. First and foremost, it is time-consuming and can take a lot of time—especially if you are using this method for the first time.
And second, some of the representations aren’t accurate enough because of the Excel spreadsheet’s fixed width and height dimensions and also the lack of indicators to measure them.
So, is there an alternate tool that can save you time? Yes, of course. Check it below.
Part 3. How to Easily Create Value Stream Map with Templates
Boardmix is an interactive whiteboard tool that enhances team collaboration and solves users’ diagramming needs.
![]()
Boardmix offers
- Free templates that can be inserted and manipulated to meet your value stream mapping requirements.
- An easy-to-use interface with simple shapes, erasers, icons, etc., to create your value stream map from scratch.
- Real-time support as it saves any changes made to the canvas automatically and avoids losing any progress made.
- Options to export your value stream map templates in .png, .jpg, .pdf, .svg, and even.bdx (Boardmix file).
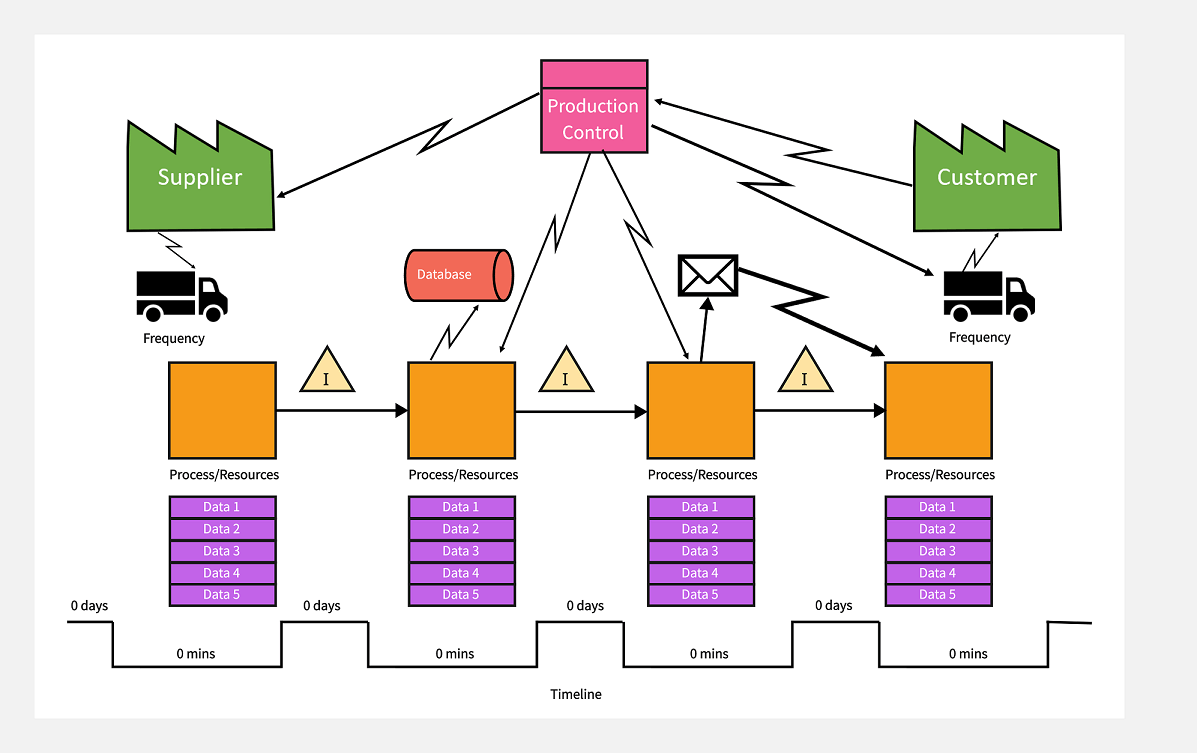
Below is a value stream map template prepared in Boardmix. It illustrates the necessary components such as supplier, customer, production control, processes, and other extra icons such as database and communication.
Making Value Stream Map Templates in Boardmix
Boardmix offers various shapes for value stream mapping so users can comfortably add, drag them around the canvas, and make an extensive value stream map based on their industry.


