

Fishbone diagram analysis is typically done by hand, using whiteboards or paper to create charts and brainstorming sessions. Despite its effectiveness, this approach is quite labor-intensive and time-consuming because it frequently depends so much on the knowledge and experience of the collaborating analysts. By combining fishbone diagram analysis with artificial intelligence, Boardmix adds a new level of insight into identifying the underlying causes of issues. Follow this tutorial to learn how to use AI fishbone diagram root cause analysis.
What is a Fishbone Diagram and How Does it Work?
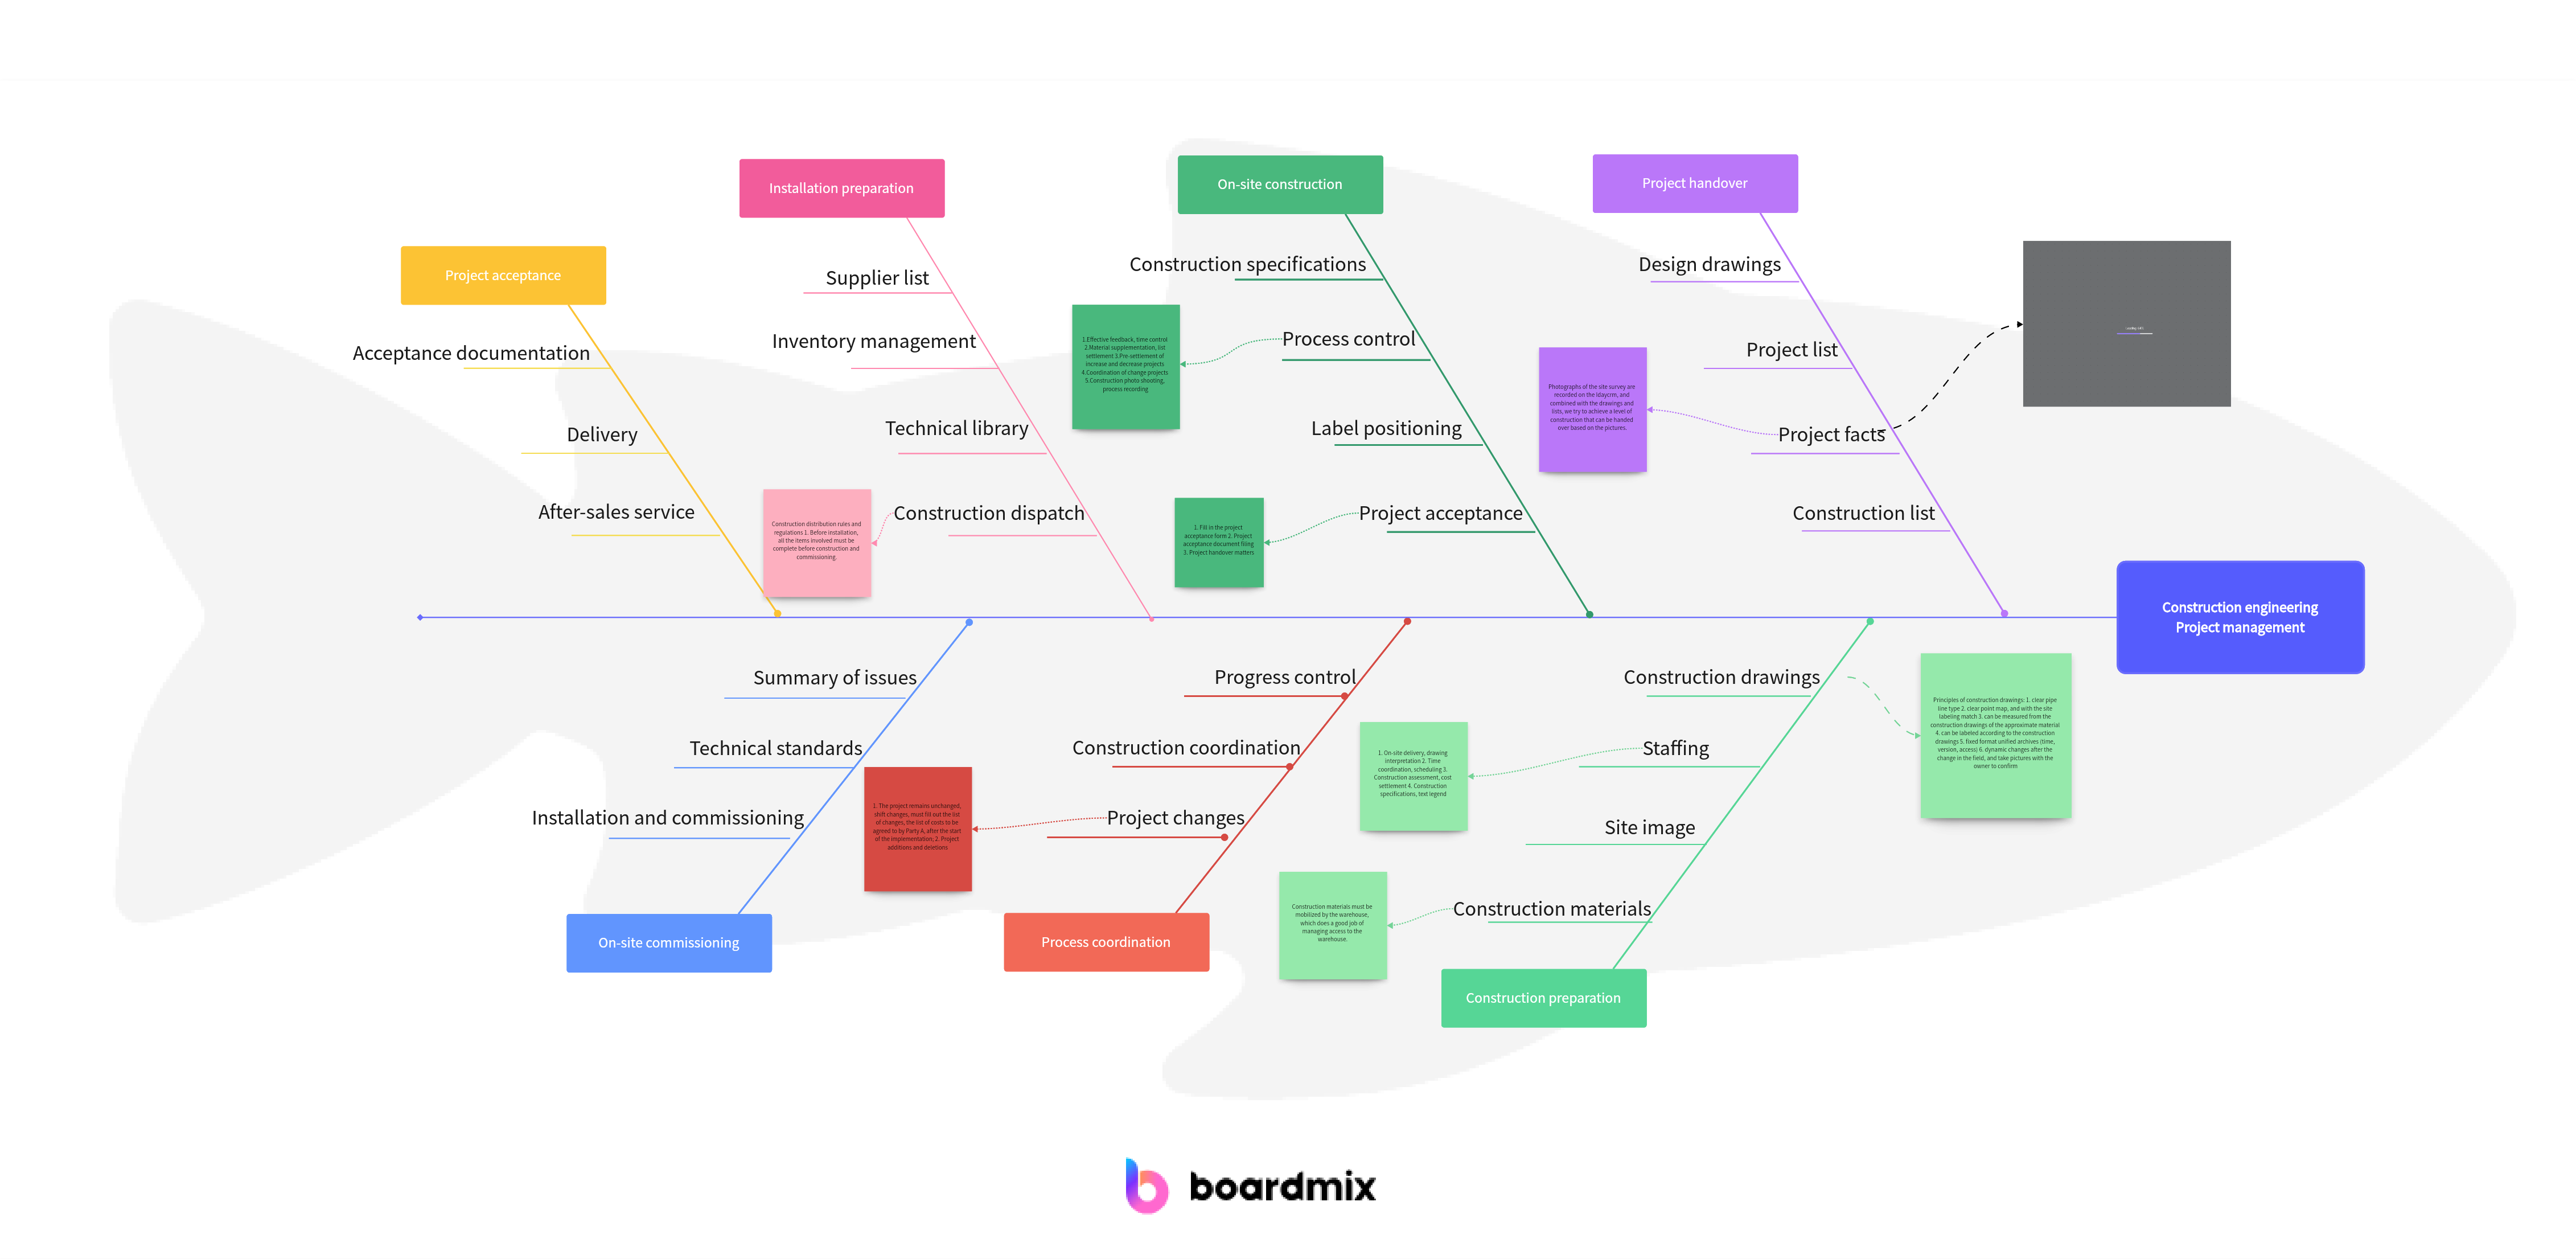
The fishbone diagram, sometimes referred to as the Ishikawa diagram, is a visual aid that facilitates decision-making by organizing and identifying alternative sources of an issue in order to determine its underlying cause. The technique gets its name because it looks like a fishbone. The issue is symbolized by the fish head, and the bones that protrude from the fishbone stand for different contributing factors or causes: the long bones indicate potential primary causes (i.e., categories), and the short bones indicate potential contributing components and specific causes. Additionally, It is important to remember that every category has a number of sub-reasons that can be examined using the "5 Why Analysis" technique.
Benefits of AI Fishbone Analysis for Root Cause
Businesses can use the fishbone analysis method to methodically dissect any issue. But finishing a fishbone diagram analysis takes a lot of work and resources, including assembling all the necessary staff for brainstorming sessions and meeting exacting visualization requirements. These issues can be resolved using AI.
Determine the root cause automatically
AI can automatically produce a list of "possible causes" depending on the user's input data or background, assisting users in identifying the underlying cause from a global viewpoint and preventing the absence of important elements.
Causal analysis based on data
Large databases may be swiftly analyzed by AI algorithms, which can also spot issues and correlations and prevent human mistake while analyzing problems.
Composition is no longer done from scratch
With just one click, AI can provide a draft fishbone diagram structure, enabling users to add details and ask more questions, thus speeding up the fishbone diagram's root cause analysis process.
Work together with additional analytical tools
For instance, users may easily link SMART goals, 5 Whys analysis, and AI fishbone diagram on Boardmix. For instance, the problem statement can be accurately stated utilizing the SMART goals before identifying the primary issue.
Steps to Make AI Fishbone Diagram Root Cause Analysis
Step1: Login to Boardmix
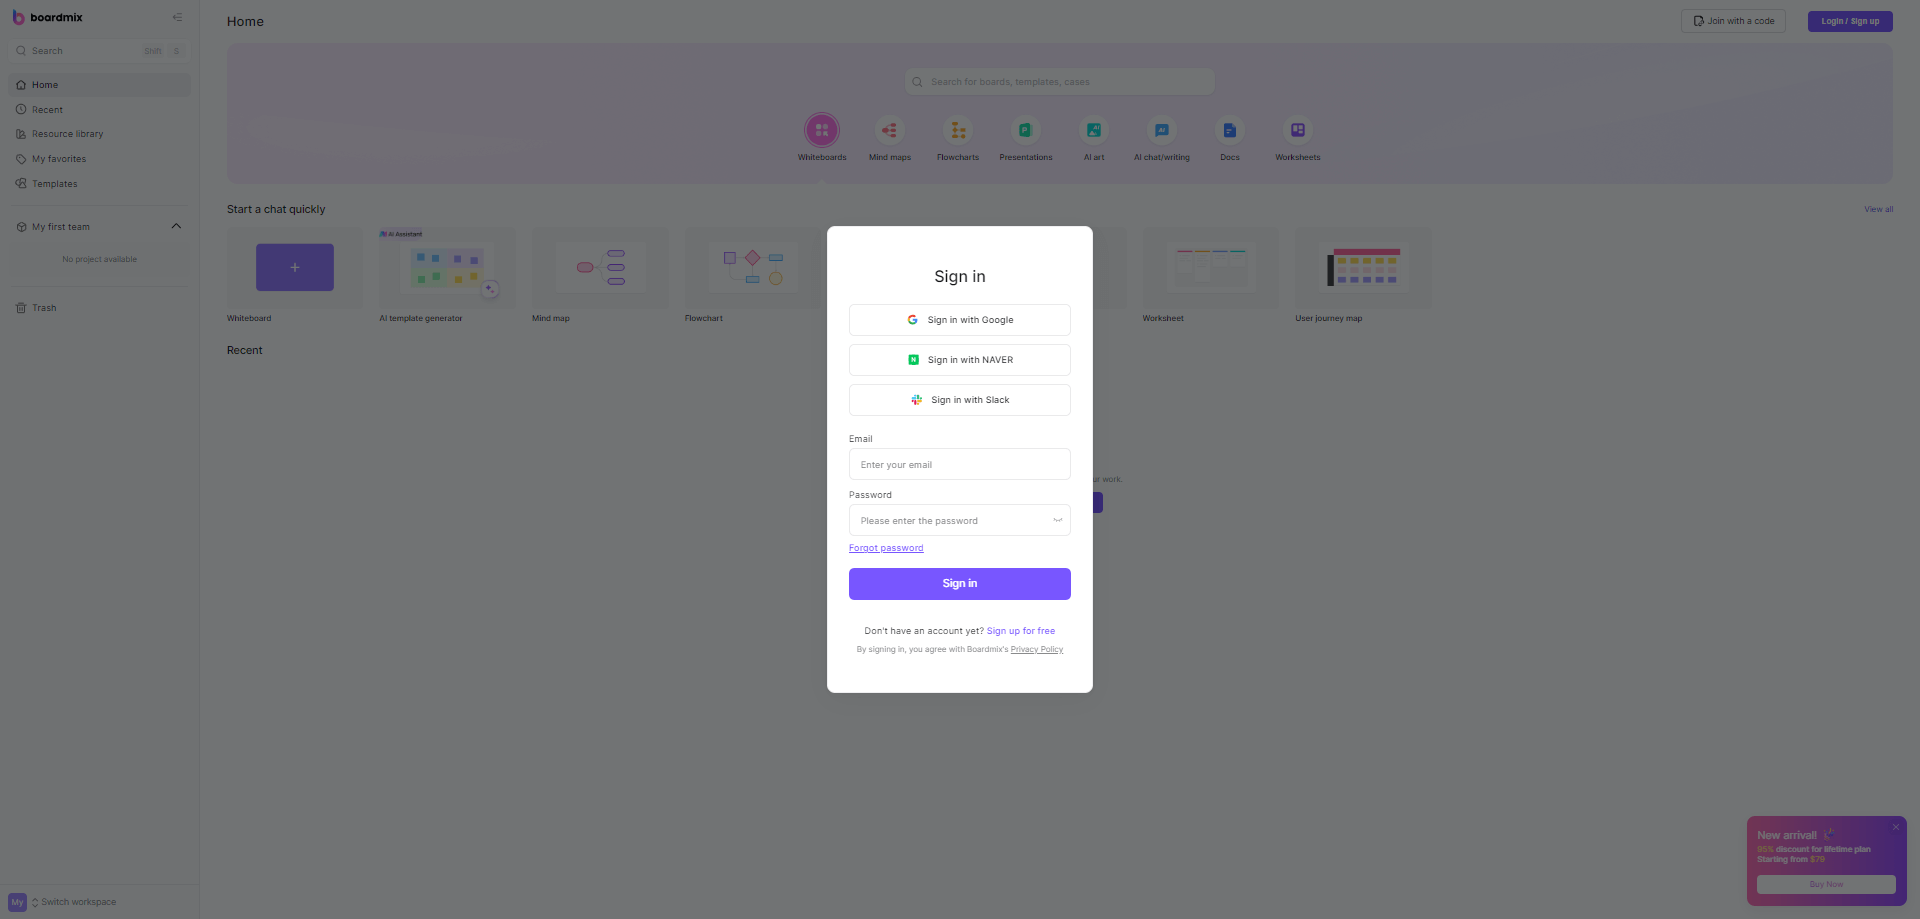
Boardmix, an AI-driven multiplayer online whiteboard, supports one-stop AI services, can generate AI fishbone analysis with one click, and has a vast library of fishbone diagram templates.
Step2: Preliminary preparation
Together with your team, use AI SMART goals to accurately describe the problem statement. Don't discuss the problem in words that are focused on finding a solution.
For example:
👉"The customer service department has a high employee turnover rate"
💡 Tip: You can begin by entering a straightforward query in Boardmix, such as "analyze reasons for high staff turnover."
Step3: Start to AI fishbone analysis
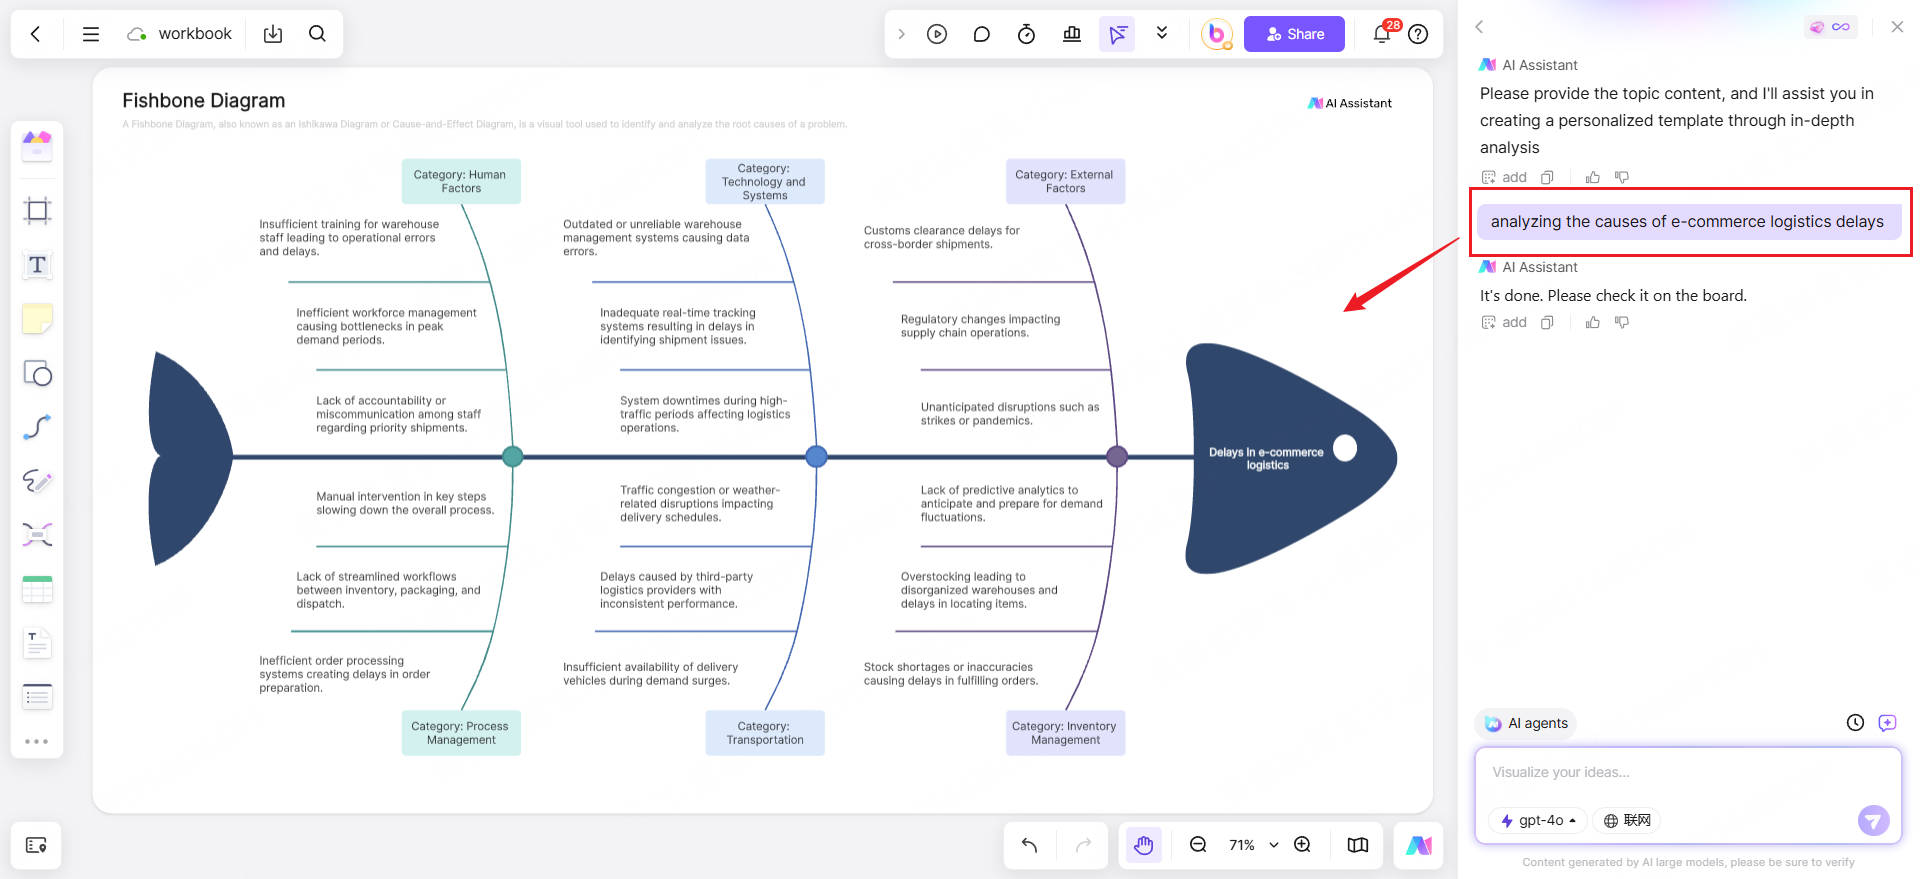
Make a new board and give Boardmix AI a task, such analyzing the causes of e-commerce logistics delays. Then, wait a little while for the analysis to finish. As you can see, Boardmix has divided the primary problems into six groups: technology, external variables, process management, inventory, transportation, and human factors. It has also examined the sub-causes and added them to the branches.
Step 4: Enhance the findings of fishbone analysis
Use the following strategies to reduce the root cause range:
- Utilize current data to support each argument.
- Allow AI to rank potential underlying causes according on context or past performance.
- Ask "why?" repeatedly until enough information is revealed for each cause that has been found.
When the cause is sufficiently clear, the analysis is guaranteed to be successful and assist the company in taking the necessary actions to avoid future occurrences of the same problems.
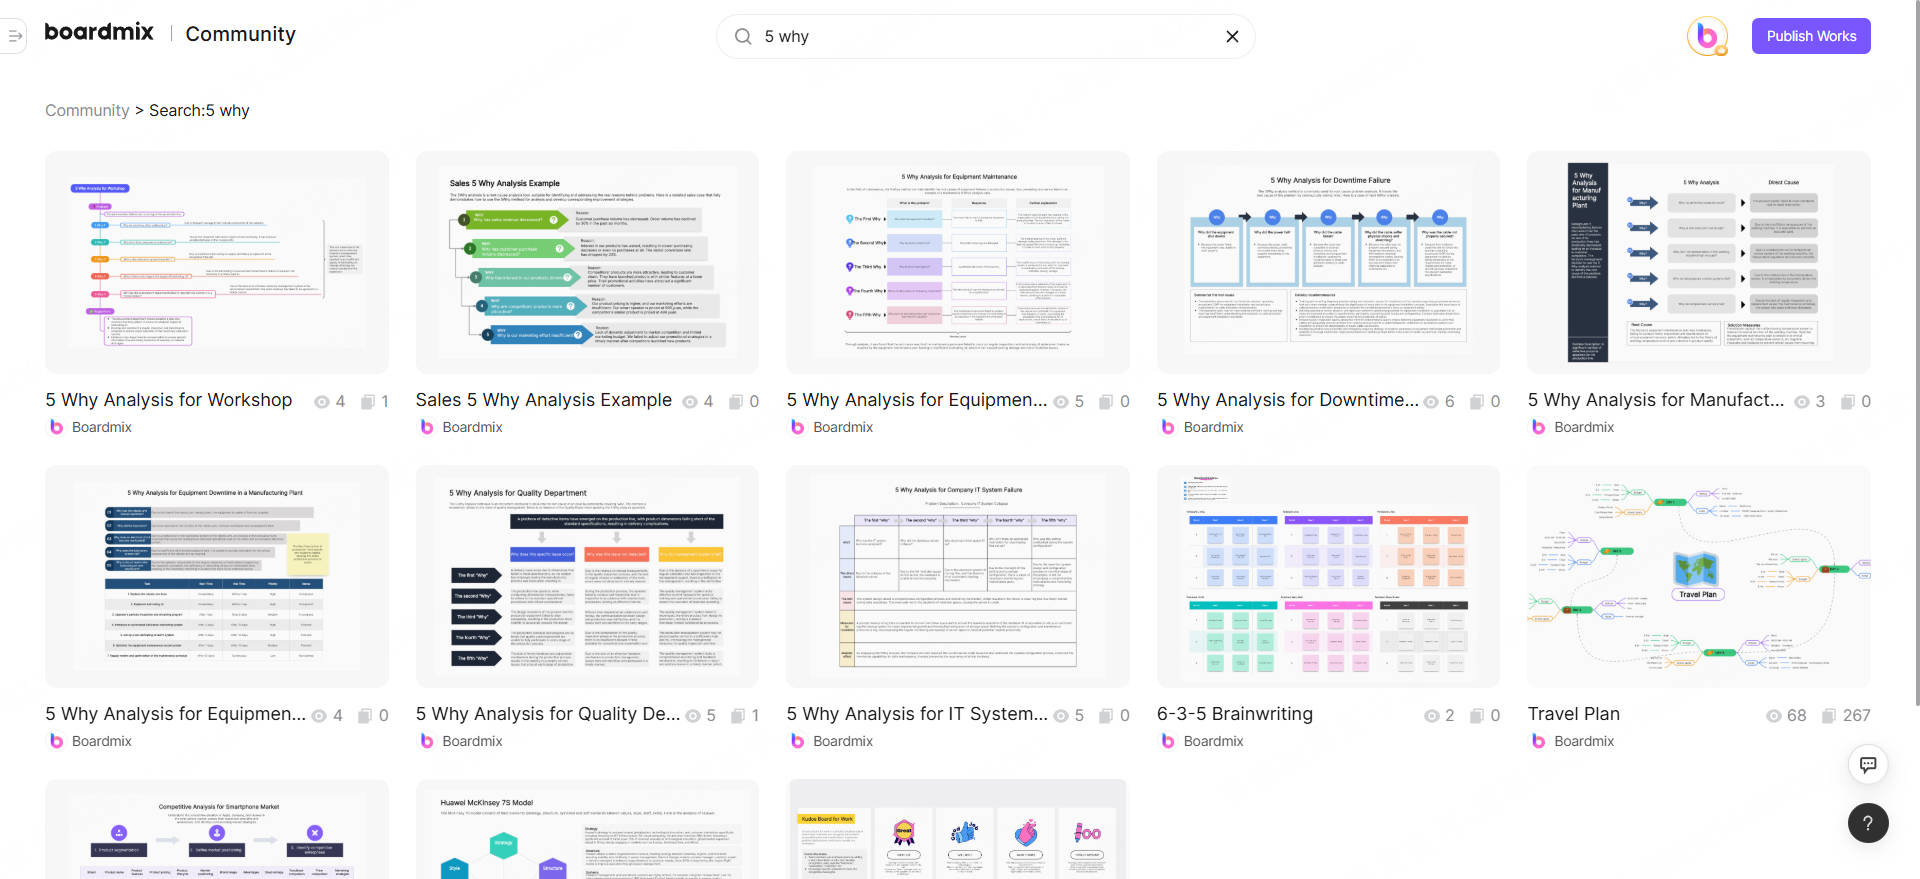
💡 Tip: You and your team can continue to delve into the specifics by using the 5 Whys analysis when you come across a bottleneck. To get many template references, simply search for "5 Whys analysis" in the community template library.
Step5: Share and monitor
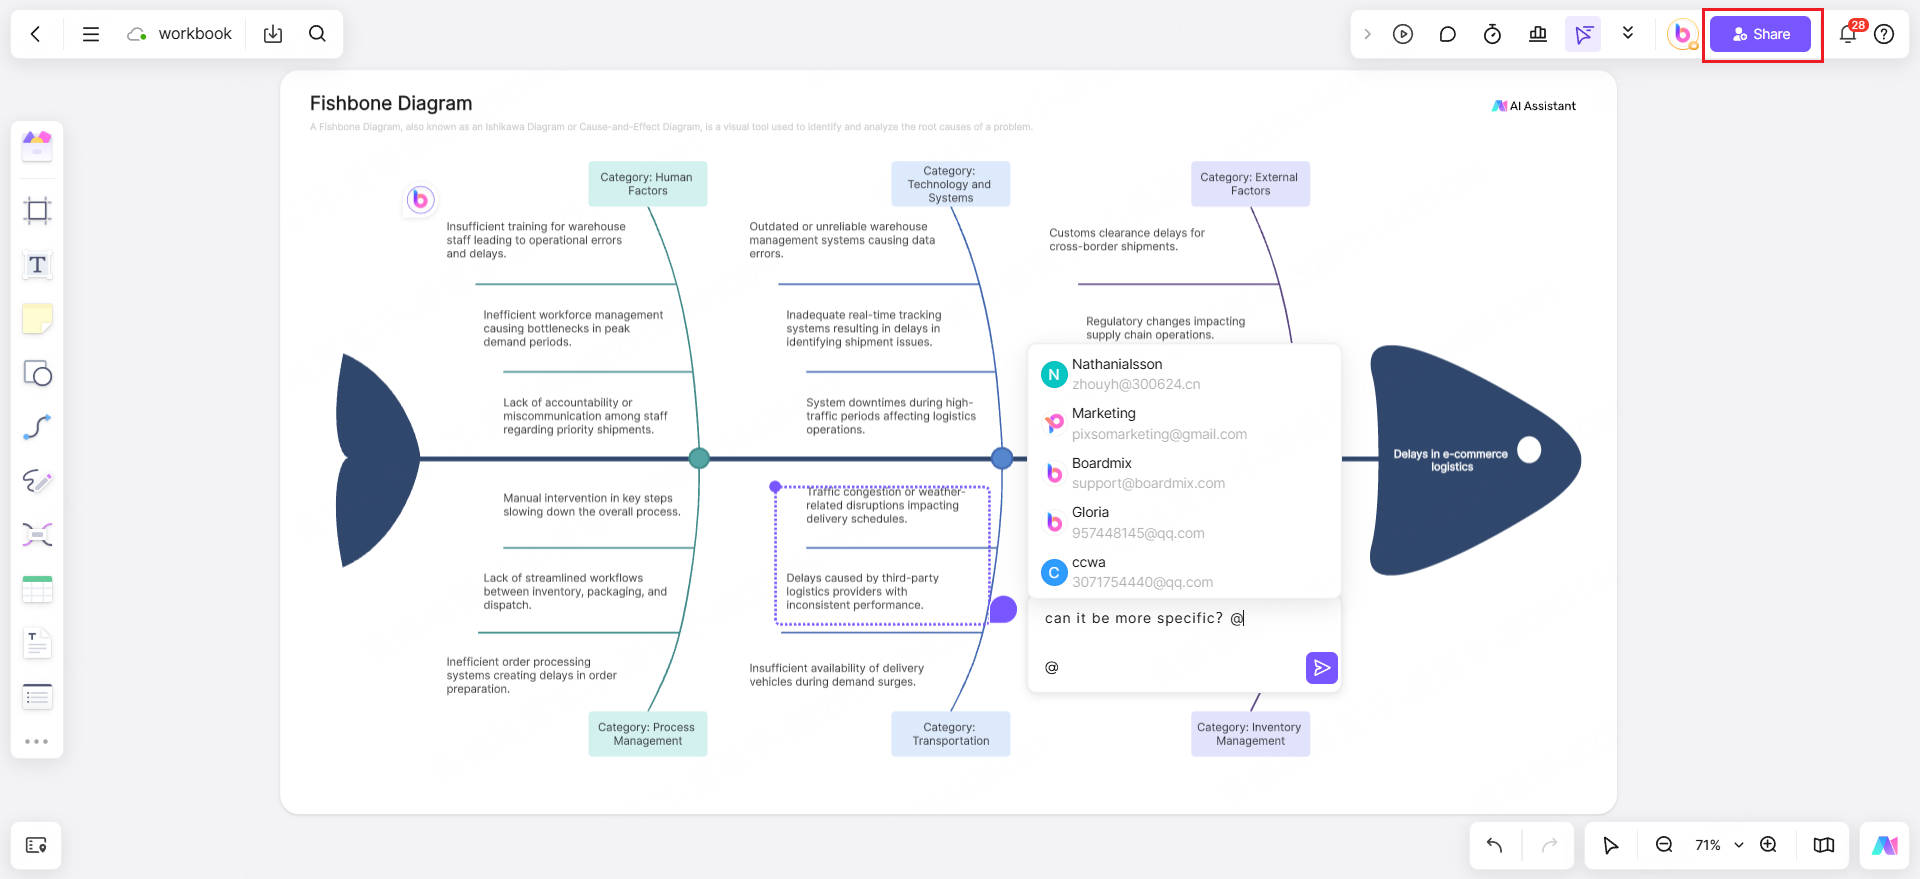
Share the fishbone diagram with the relevant team members and invite them to mark the specific issues they think are more detailed on the diagram. Eliminating the chance that the issue may repeat is the next stage. Corrective measures are only the first step; you and your team must regularly assess and track the problem to make sure that the enhancements are lasting and that no new issues are causing it.
2 Examples of AI Fishbone Analysis Applications
Example 1: Root Cause Analysis in Hospital
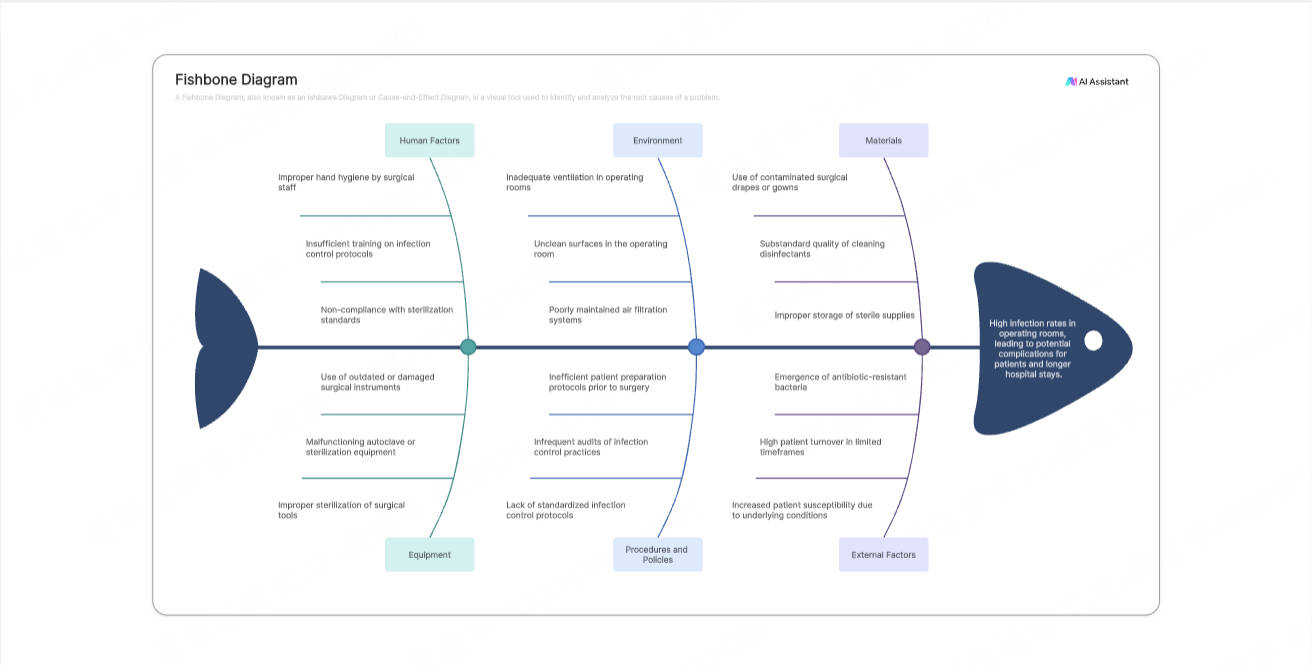
The operating room's sterility is essential to the hospital's infection control system. This is a significant stride in patient protection as well as a direct threat to physician safety. There could be several aspects to the possible causes of this problem, such as but not restricted to:
- The surgical instruments are not thoroughly cleaned and disinfected.
- Operating room staff members do not strictly enforce hand hygiene and clothing rules.
- Poor air quality is a result of the air purification system's erratic operation.
- The patient did not adequately prepare for the procedure.
By identifying the primary causes of the elevated infection rate, the AI fishbone diagram root cause analysis assists hospital administrators in developing efficient improvement strategies that lower infection risks and improve medical safety and quality.
Example 2: Root Cause Analysis for Automotive Line Shutdown

Production line downtime is a particularly difficult problem in the manufacturing sector, and the fishbone diagram aids in identifying any issues with the production process. AI assists in identifying production problems and preventing their recurrence by examining categories such the machines themselves, workers, environment, material delivery, and rules and regulations.
✍It is vital to use AI fishbone analysis if your factory is already dealing with the following issues.
✨The cause is unknown and it keeps happening.
✨The influence's reach has grown.
✨Unreliable emergency response.
Conclusion
An essential tool in the toolbox for problem avoidance and root cause analysis is the fishbone diagram. It is frequently employed in the process of solving problems. It is not a novel idea; in contemporary businesses, it continues to be the go-to option for problem-solving. Consequently, increasing efficiency is the fishbone diagram's most crucial entry barrier. Using the fishbone diagram, Boardmix, an AI whiteboard designed to foster teamwork, can automatically identify the underlying causes of problems in businesses, eliminating the need for lengthy brainstorming sessions and enabling root cause analysis to be done online.


