

Whether you're a student, a business professional, or someone simply looking to manage their tasks more effectively, visual tools can significantly enhance your productivity and understanding. One such powerful tool is the cluster diagram. This comprehensive guide will delve into what a cluster diagram is, why it is widely used, and, most importantly, how to create one online using Boardmix, with detailed examples to illustrate its practical applications.
What is a Cluster Diagram?
A cluster diagram is a powerful visual tool used to organize and represent information in a structured and hierarchical way. At its core, a cluster diagram helps break down complex concepts into smaller, more manageable parts, creating a web of ideas that are interconnected and easily comprehensible. This form of diagram is particularly useful for brainstorming, note-taking, and planning, as it allows for the visualization of relationships between different pieces of information.
In a typical cluster diagram, a central idea or theme is placed at the center of the diagram. From this central point, related ideas and subtopics branch out, forming clusters of information. Each cluster can further branch out into more specific details, creating a detailed and organized map of the entire concept. This visual representation not only aids in understanding the connections between different ideas but also enhances memory retention and facilitates more effective communication.
Why People Use a Cluster Diagram
Enhancing Brainstorming Sessions
Cluster diagrams are often used in brainstorming sessions to generate and organize ideas quickly. By visually mapping out ideas, participants can see the connections between different thoughts, which can lead to new insights and creative solutions. The ability to see the entire structure of ideas at a glance helps teams stay focused and ensures that no valuable input is overlooked.
Simplifying Complex Information
When dealing with complex information, a cluster diagram can break down the content into more digestible parts. This makes it easier to understand and remember. For instance, students can use cluster diagrams to study complex subjects by organizing notes and highlighting key concepts. Similarly, professionals can use them to simplify project plans, ensuring that every aspect of a project is covered and understood.
Improving Communication
Cluster diagrams enhance communication by providing a clear visual representation of ideas. In business settings, they can be used to present strategies, plans, or data in a way that is easy for stakeholders to grasp. The visual format makes it easier to explain complicated relationships and processes, ensuring that everyone involved has a clear understanding.
Facilitating Decision-Making
By organizing information visually, cluster diagrams can help in decision-making processes. They allow decision-makers to see all relevant information at once, compare different options, and understand the potential outcomes of each choice. This comprehensive view supports more informed and effective decisions.
Organizing and Visualizing Complex Ideas and Information
Cluster diagrams excel in breaking down complex ideas into manageable parts, making it easier to see the big picture and the finer details simultaneously. For example:
Academic Research: Researchers can organize their literature review, hypotheses, methodologies, and data into a cohesive visual format.
Business Strategies: Companies can outline their goals, market analysis, competitive strategies, and financial plans in a single diagram.
Enhancing Team Collaboration
In team settings, cluster diagrams serve as an excellent tool for fostering collaboration. Here’s how:
Real-Time Collaboration: Tools like Boardmix allow team members to contribute simultaneously, making the process dynamic and inclusive.
Unified Vision: A visual representation of ideas ensures that all team members are on the same page, reducing misunderstandings and miscommunications.
Tracking Progress: Cluster diagrams can be updated in real-time, providing a live status update on different aspects of a project.
How to Create a Cluster Diagram Online with Boardmix
Creating a cluster diagram online is straightforward, especially with the right digital whiteboard software. Boardmix, a leading digital whiteboard tool, offers robust features for creating detailed and interactive cluster diagrams. Below is a step-by-step guide on how to create a cluster diagram using Boardmix, along with examples to illustrate its practical applications.
Step-by-Step Guide to Creating a Cluster Diagram with Boardmix
Step 1: Set Up Your Boardmix Account

First, sign up for a Boardmix account if you don't already have one. Boardmix offers various plans, including a free version that provides access to essential features.
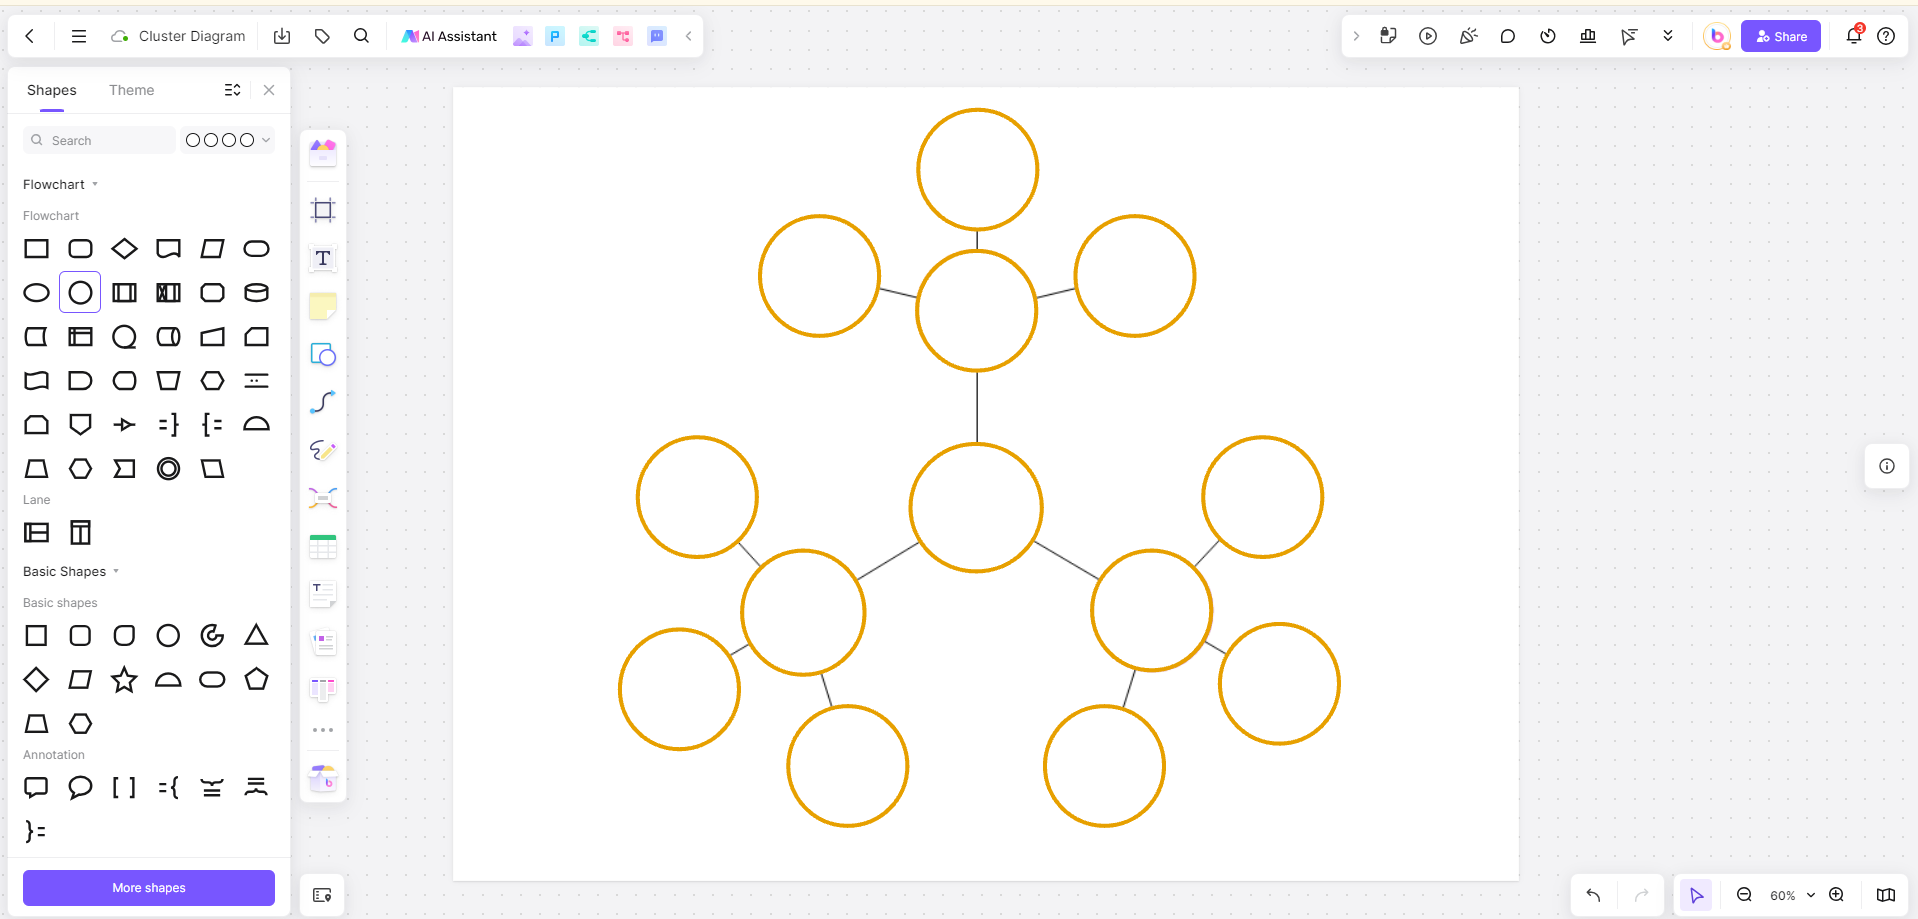
Step 2: Choose a Template or Start from Scratch
Boardmix provides a range of templates to get you started. You can select a cluster map template from the template library, which can save time and ensure a professional layout. Boardmix provides diversified templates for users to choose, you can choose the template that best meets your needs according to the actual requirements. If you prefer to start from scratch, choose a blank canvas.
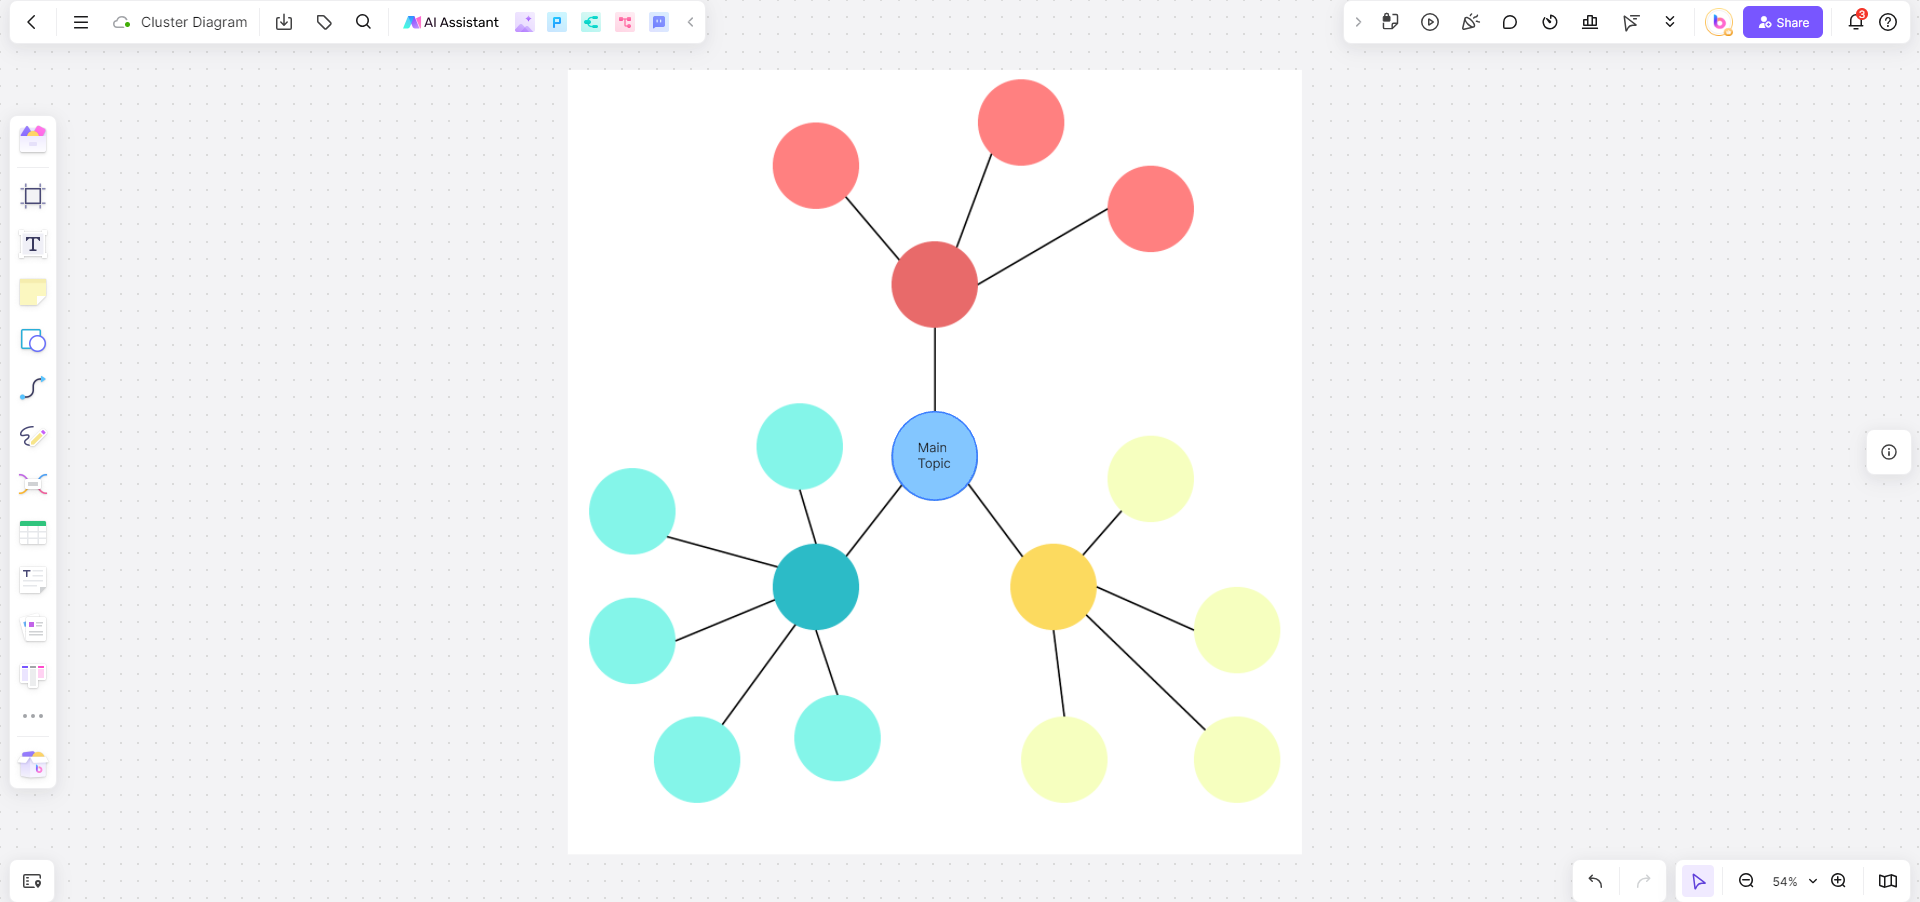
Step 3: Define Your Central Idea
Begin by placing your central idea or theme in the center of the board. This will be the starting point from which all other ideas will branch out. Use Boardmix's text and shape tools to create a visually appealing central node.
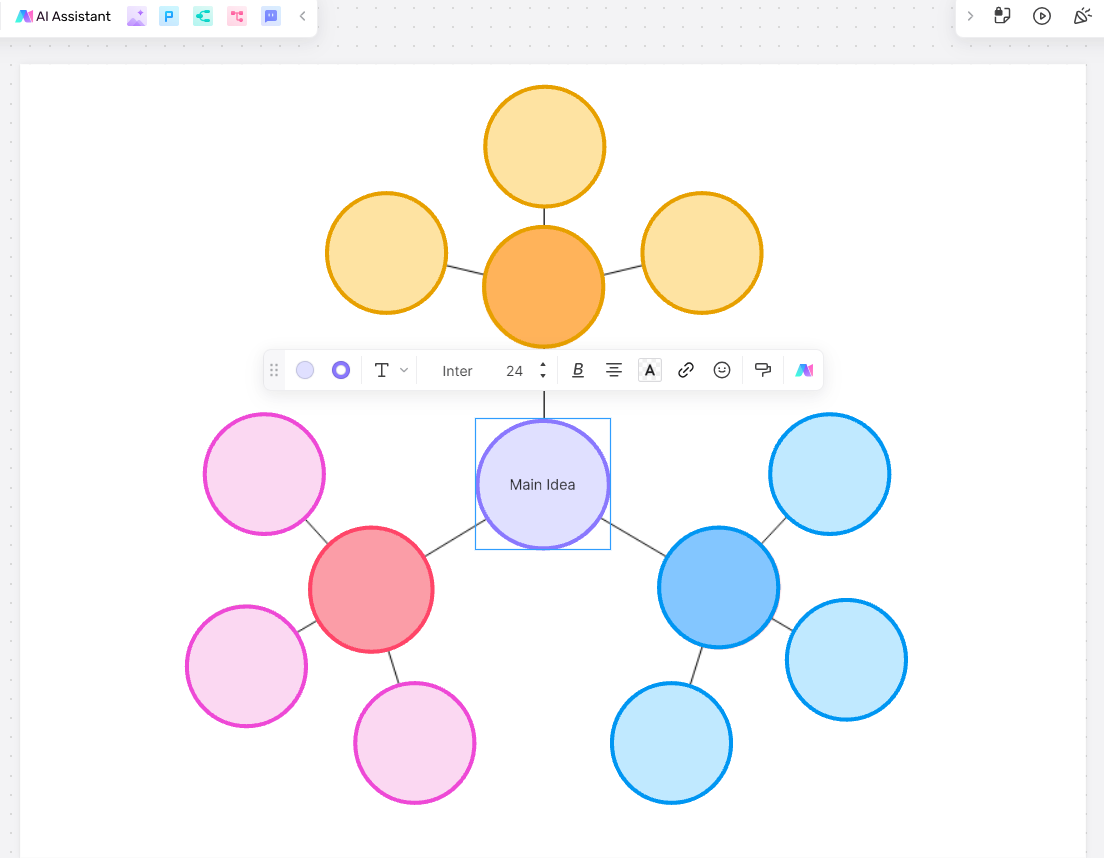
Step 4: Add Branches and Clusters
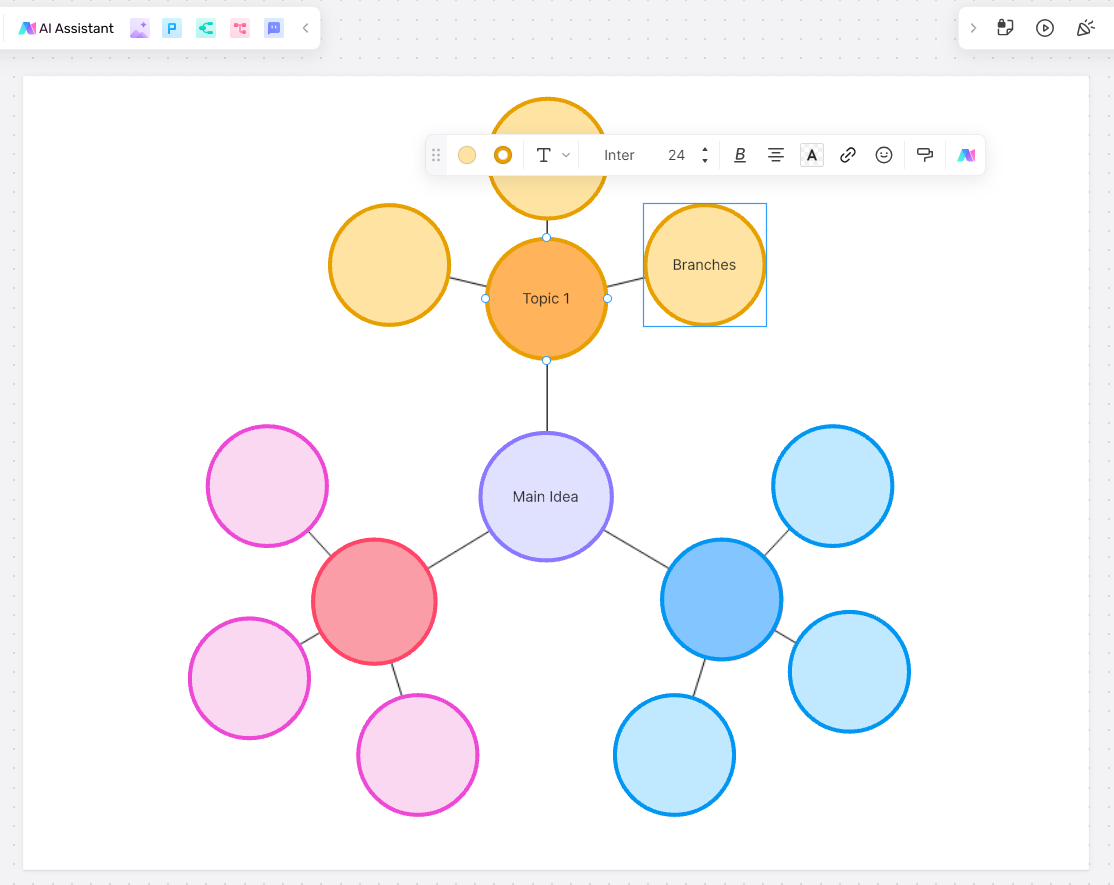
From the central idea, start adding branches for related subtopics. Use lines or arrows to connect these branches to the central node. Each branch represents a major category or subtopic related to your central theme. Continue to add clusters of information by branching out from each subtopic, creating a web of connected ideas.
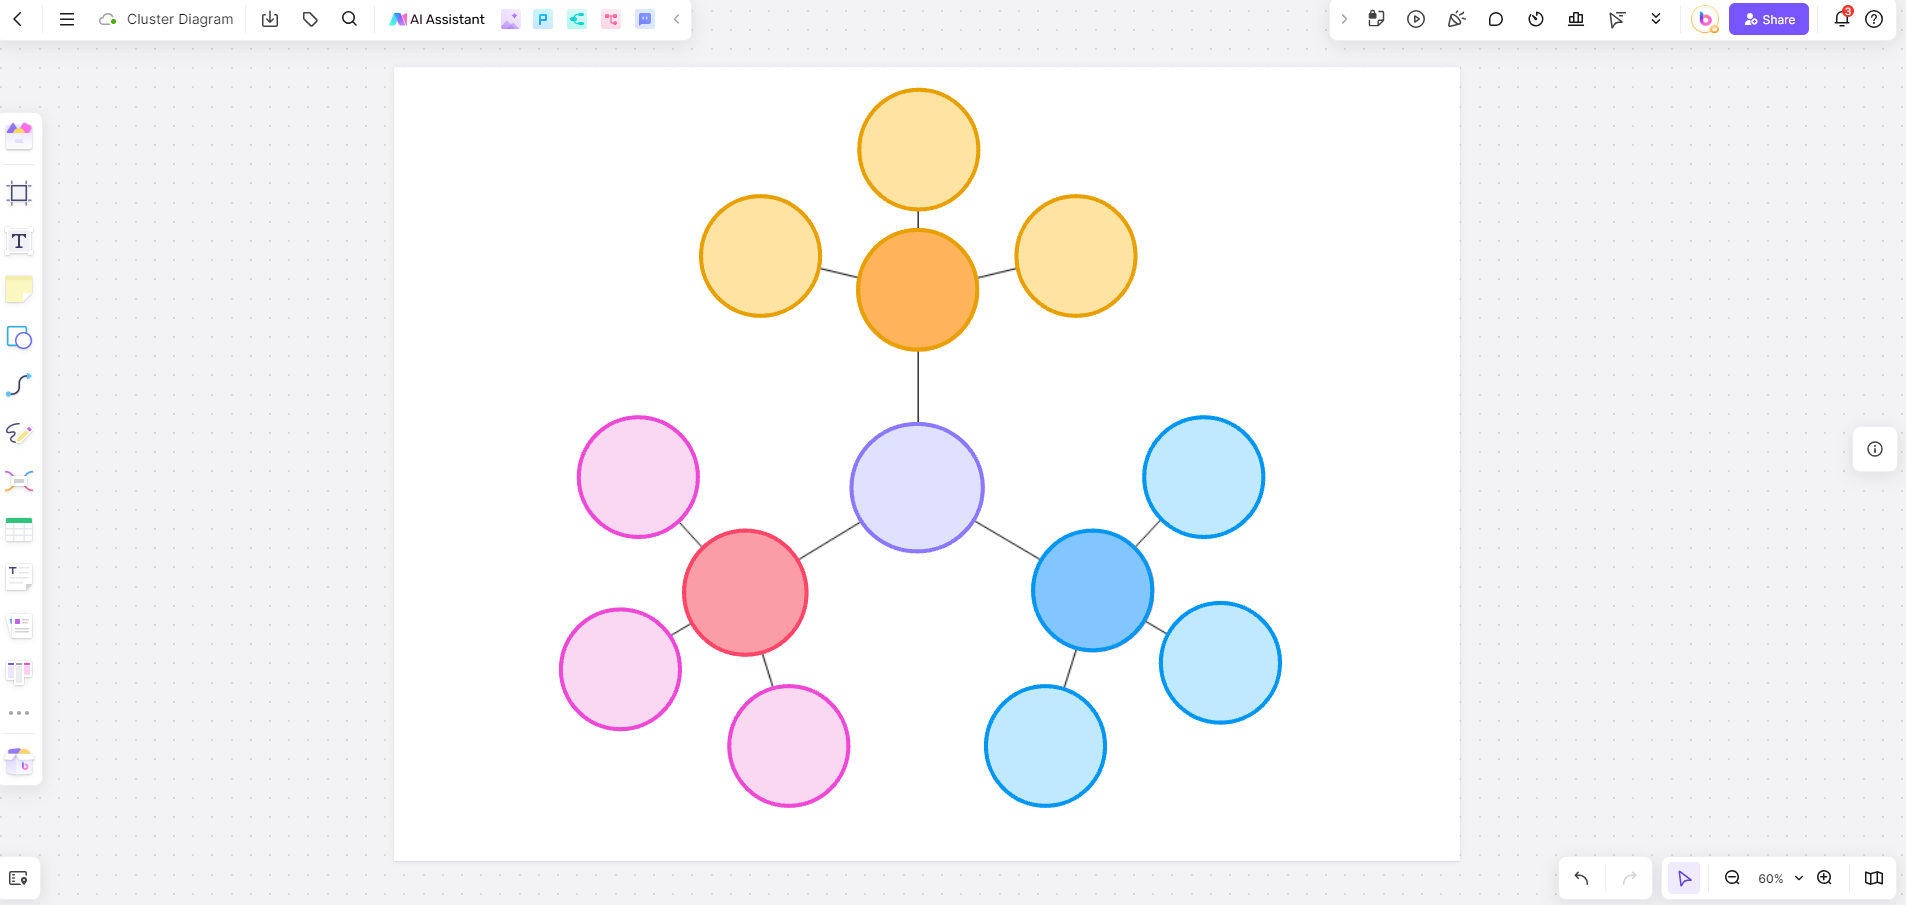
Step 5: Customize and Organize
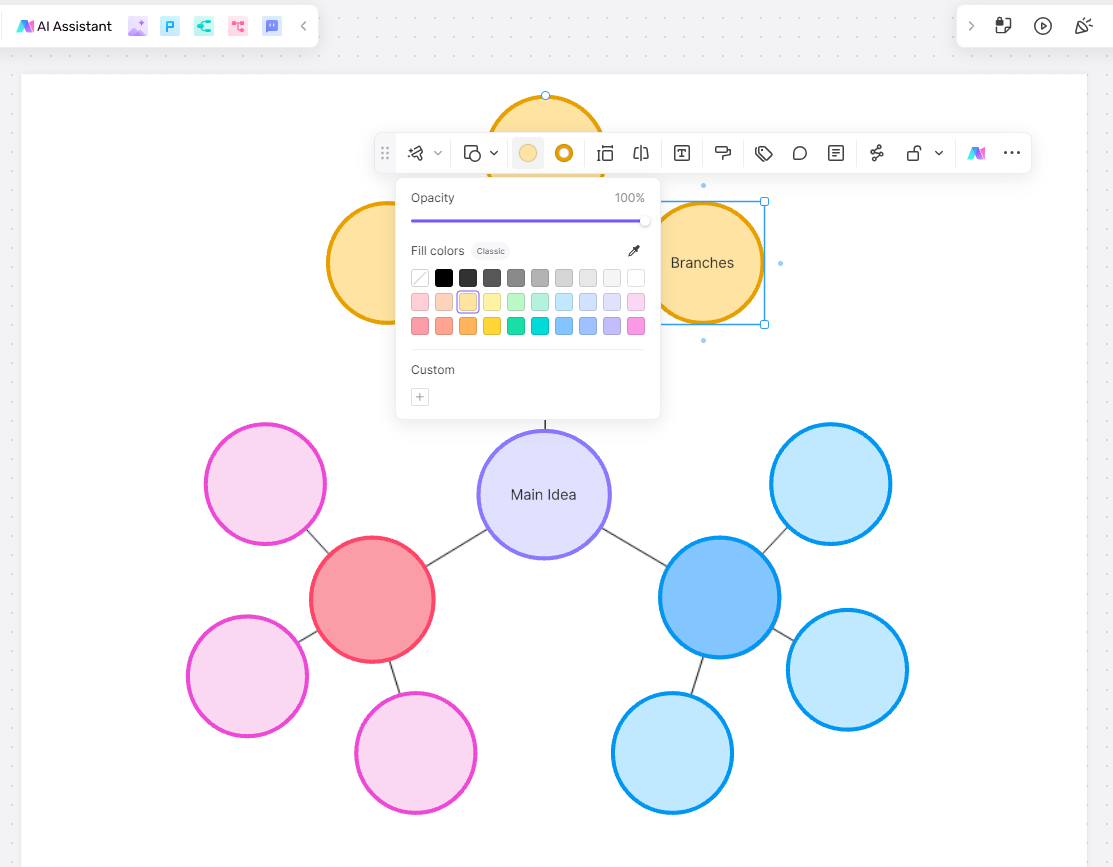
Boardmix allows you to customize your cluster diagram by changing colors, shapes, and fonts. Use different colors to differentiate between main categories and subtopics, making the diagram easier to read. You can also rearrange elements to ensure the layout is clear and logical.
Step 6: Collaborate and Share
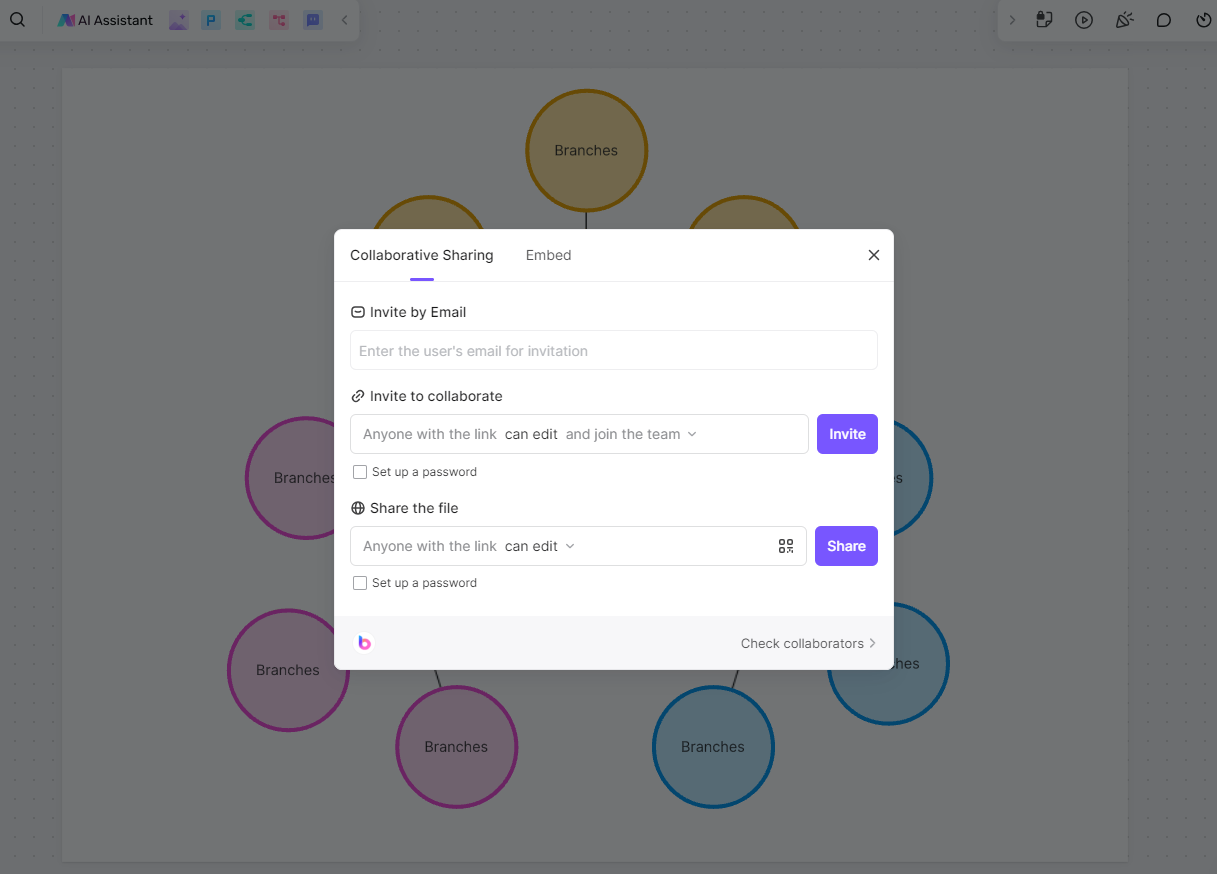
One of the key advantages of using Boardmix is its collaboration features. Invite team members to join your board and contribute to the cluster diagram in real-time. You can also share the diagram with stakeholders by exporting it as a PDF or image file, or by providing a shareable link.
Examples of Cluster Diagram Created with Boardmix
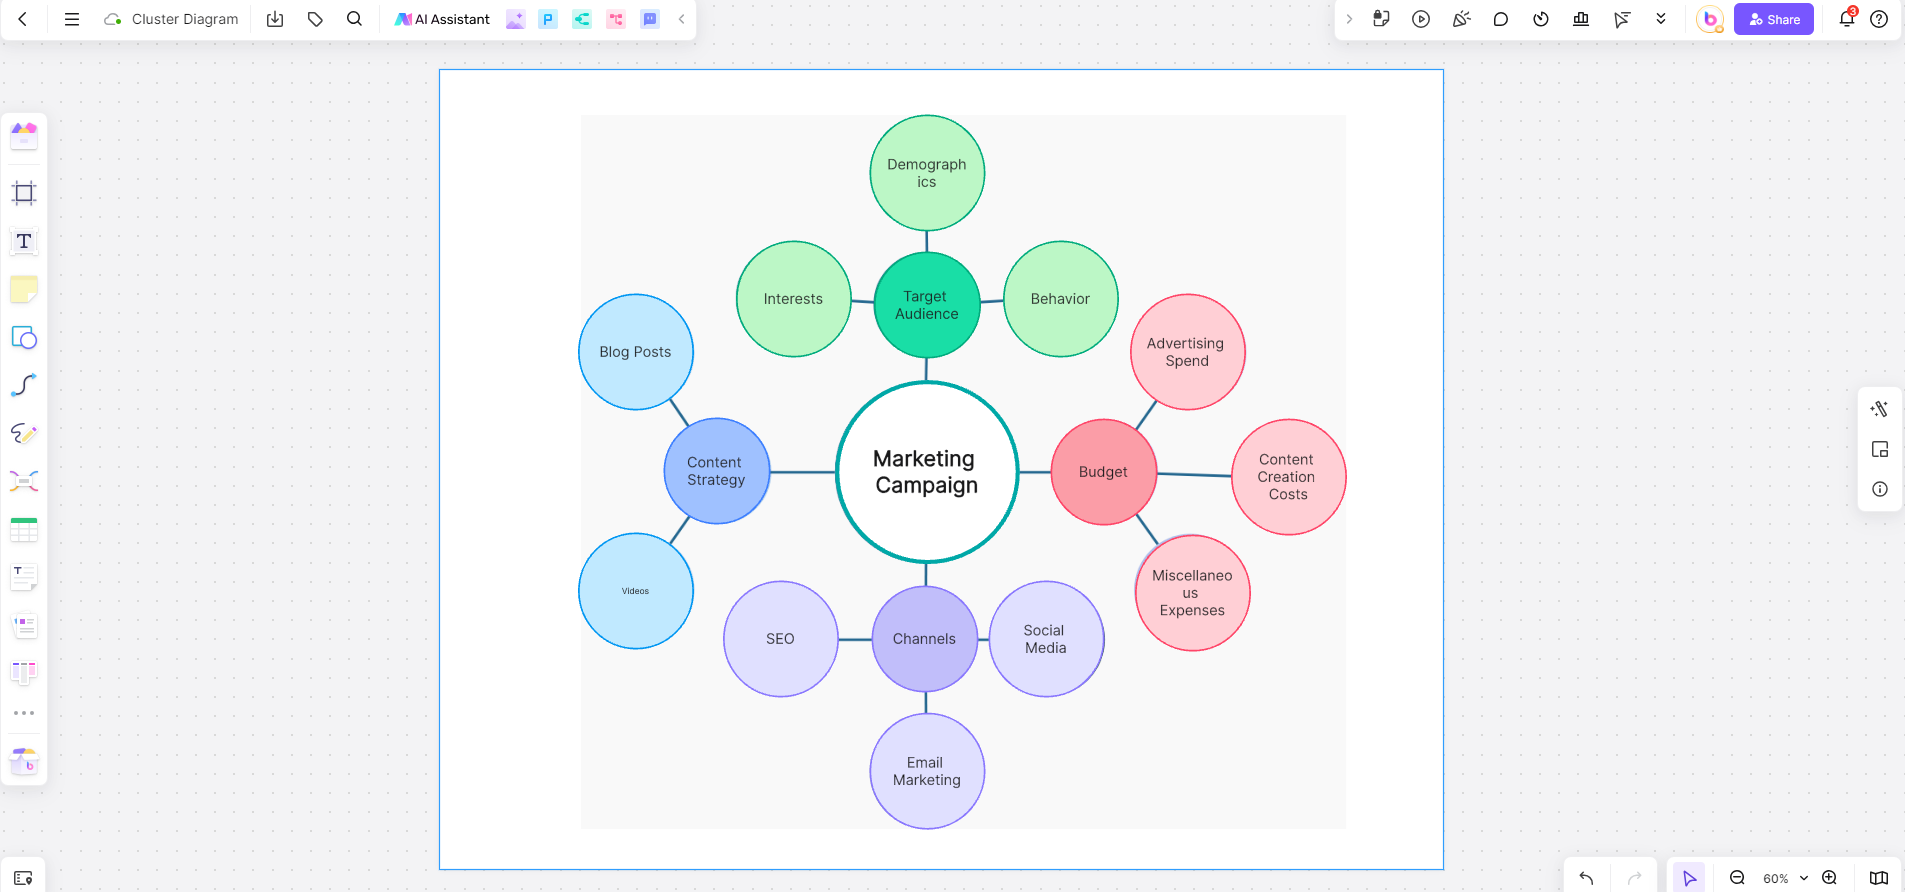
Let's consider an example of creating a cluster diagram for planning a marketing campaign. The central idea is "Marketing Campaign" placed in the center of the diagram. From this central node, you can create branches for major components such as "Target Audience," "Budget," "Channels," and "Content Strategy."
Target Audience
The "Target Audience" branch can be broken down into several clusters:
Demographics: This includes age, gender, income level, education, etc.
Interests: Hobbies, preferences, and lifestyle choices.
Behavior: Purchasing habits, brand loyalty, and online activity.
By organizing the target audience into these clusters, you can develop a more precise and effective marketing strategy that caters to the specific needs and characteristics of your audience.
Budget
The "Budget" branch can include clusters such as:
Advertising Spend: Allocation for online and offline advertising.
Content Creation Costs: Expenses for creating videos, blog posts, graphics, etc.
Miscellaneous Expenses: Additional costs like software subscriptions, promotional materials, and contingencies.
This breakdown helps in planning and controlling the financial aspects of the campaign, ensuring that resources are used efficiently.
Channels
The "Channels" branch encompasses various marketing platforms:
Social Media: Platforms like Facebook, Instagram, Twitter, and LinkedIn.
Email Marketing: Campaigns targeting specific customer segments.
SEO: Strategies to improve search engine rankings.
PPC: Pay-per-click advertising on platforms like Google Ads and Bing Ads.
By categorizing the channels, you can plan and execute a multi-faceted approach that maximizes reach and engagement.
Content Strategy
The "Content Strategy" branch can include different types of content:
Blog Posts: Regular articles on relevant topics.
Videos: Informative and promotional videos.
Infographics: Visual representations of data and information.
Case Studies: Detailed analyses of successful campaigns or customer experiences.
Organizing the content strategy in this manner ensures that all forms of content are considered and integrated into the overall campaign plan.
Example 2: Project Management
In project management, a cluster diagram can help in planning and organizing tasks, resources, and timelines. For a software development project, the central idea could be "Software Development Project." Branches could include "Requirements," "Design," "Development," "Testing," and "Deployment." Each of these branches can further break down into specific tasks and sub-tasks, providing a comprehensive overview of the entire project.
Example 3: Academic Research
For academic research, a cluster diagram can help organize literature reviews, research questions, and methodologies. The central idea could be the research topic, with branches for "Literature Review," "Research Questions," "Methodology," "Data Collection," and "Analysis." Each branch can include clusters of relevant sources, key findings, and hypotheses, aiding in the systematic organization of the research process.
Example 4: Event Planning
In event planning, a cluster diagram can help coordinate various aspects of the event. The central idea could be "Annual Conference." Branches could include "Venue," "Speakers," "Agenda," "Marketing," and "Logistics." Each branch can further break down into detailed tasks such as booking venues, contacting speakers, creating marketing materials, and arranging transportation and accommodation.
By using Boardmix's tools, you can color-code each category, add icons, and ensure the layout is easy to understand. The ability to see all components of the marketing campaign in a single, organized visual map helps in planning and executing the campaign more effectively.
Conclusion
With digital whiteboard software like Boardmix, creating cluster diagrams online has never been easier. Boardmix provides intuitive tools and templates that allow users to create detailed and professional cluster diagrams quickly. Whether you are planning a marketing campaign, studying for exams, or presenting a business strategy, Boardmix can help you create effective cluster diagrams that make information more accessible and understandable.
By following the steps outlined in this guide and utilizing Boardmix’s features, you can create impressive cluster diagrams that enhance your productivity and communication. Embrace the power of cluster diagrams and digital whiteboard software to take your visual organization to the next level.


