

In today's technology-driven world, visual representation of complex systems is crucial for understanding, communication, and decision-making. Diagrams of systems serve as powerful tools to illustrate the relationships and components within various systems, whether they are related to information technology, business processes, or engineering. This article will explore what a diagram of system is, provide examples of system diagrams, and highlight Boardmix as a top-notch online tool for creating system diagrams.
What Is a Diagram of System?
A diagram of system is a visual representation that maps out the components, processes, and interactions within a system. These diagrams are essential for breaking down complex systems into understandable elements, facilitating analysis, troubleshooting, and communication. System diagrams can vary widely in complexity and style, depending on the nature of the system being represented and the specific needs of the audience.
Typically, a system diagram includes nodes representing components or entities and lines or arrows indicating the relationships or flows between these components. These diagrams help stakeholders visualize the structure and dynamics of the system, identify potential issues, and communicate solutions effectively.
Examples of Diagram of System
System diagrams are utilized across various fields to illustrate different types of systems. Here are three common examples of system diagrams:
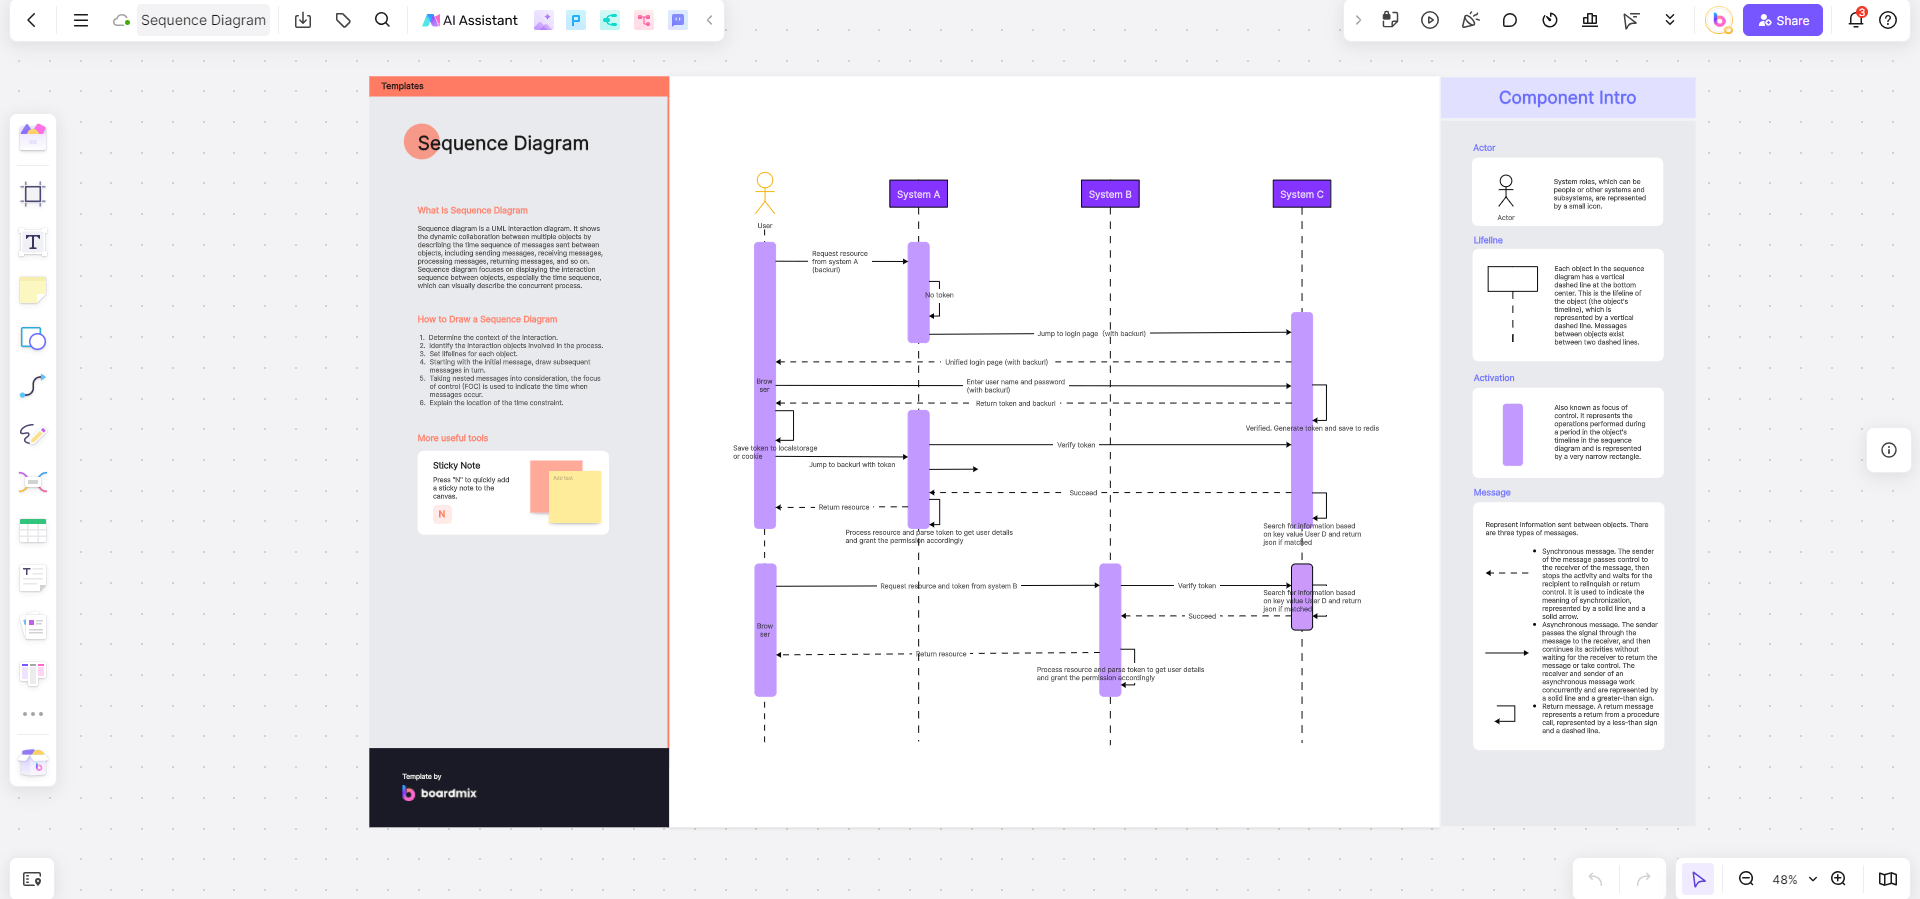
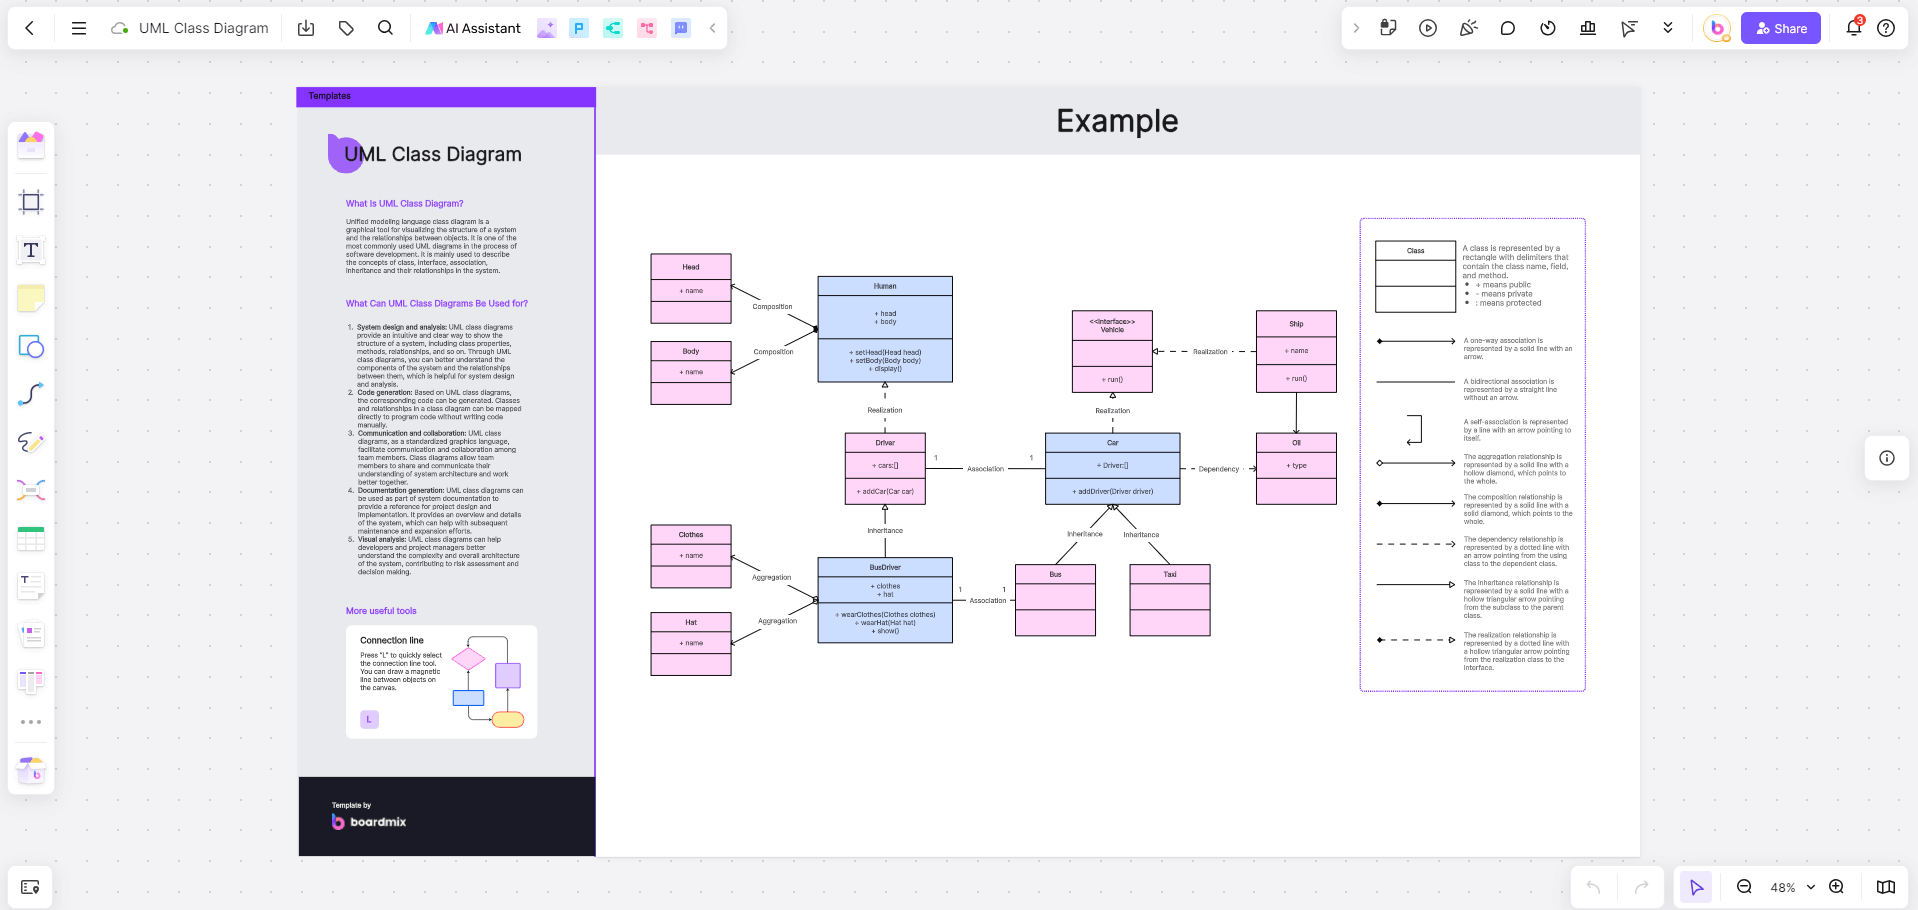
IT System Diagram
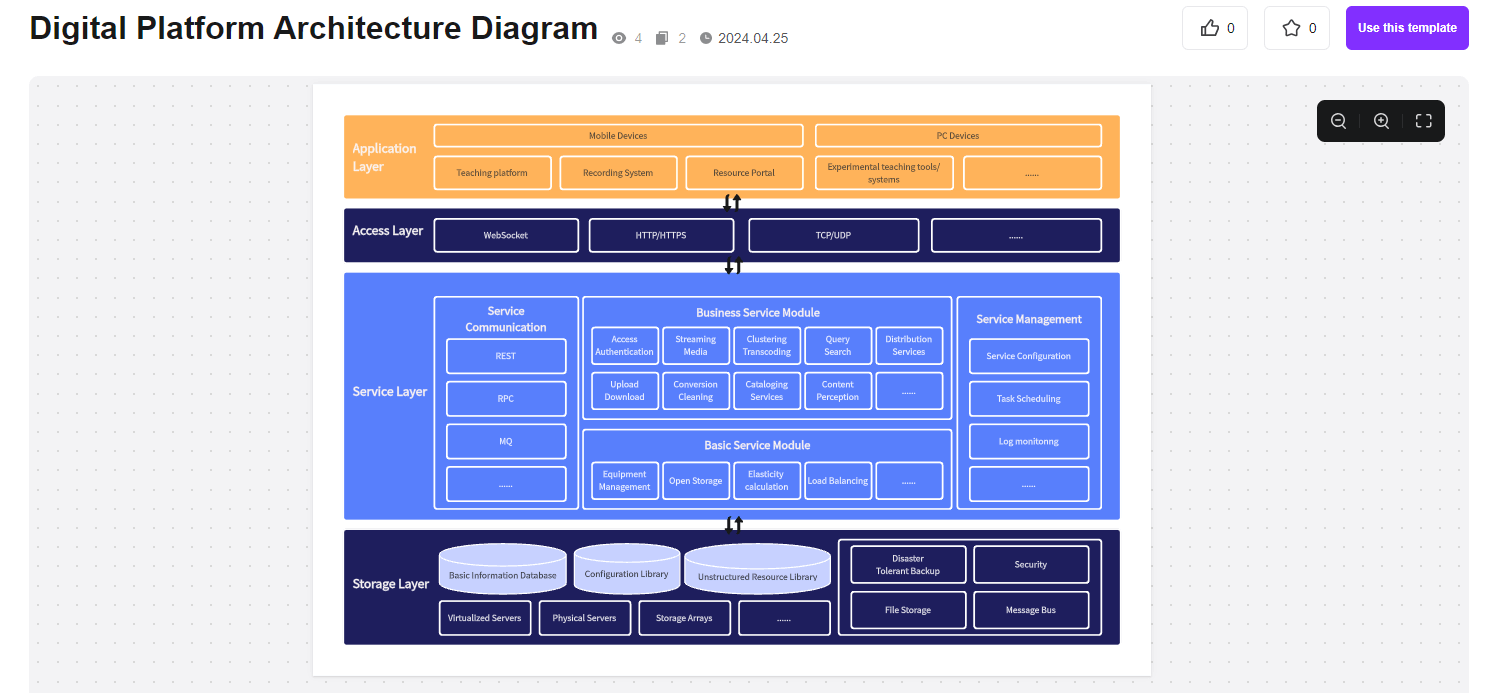
An IT system diagram provides a visual representation of the components and interactions within an information technology system. This might include hardware, software, networks, and data flows. IT system diagrams are crucial for network design, system architecture, and troubleshooting. For example, a typical IT system diagram might show servers, databases, firewalls, and user devices, along with the connections and data flow between these components.
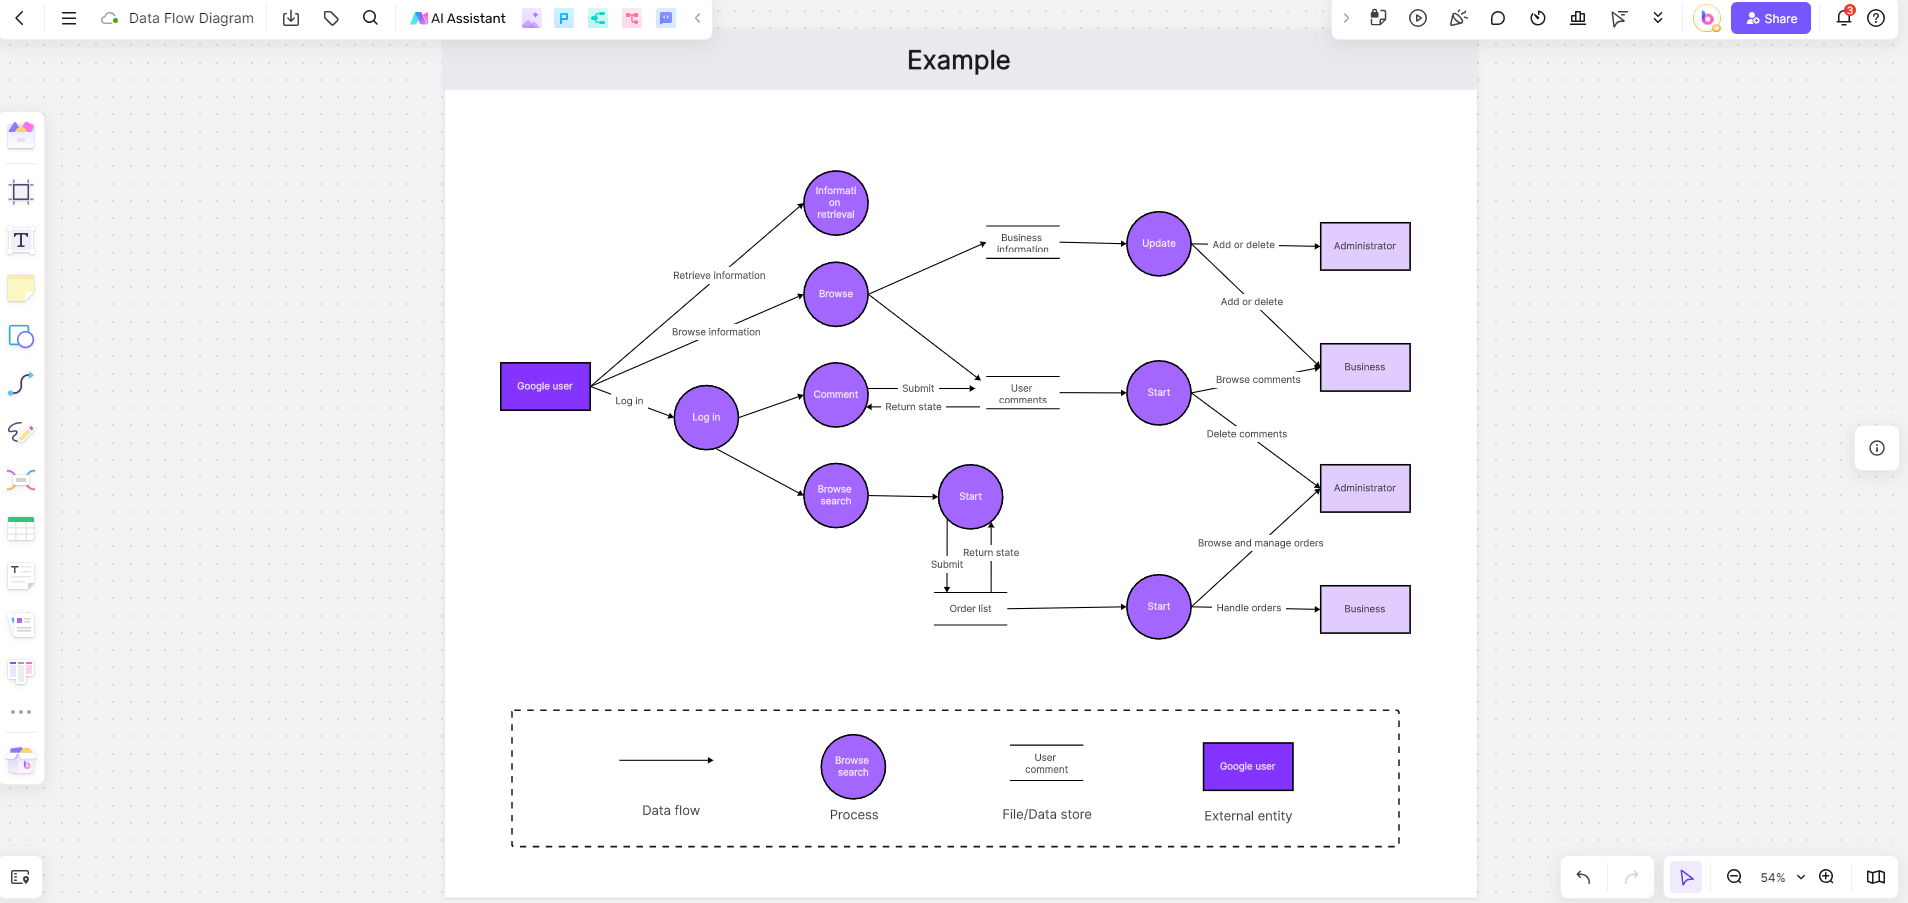
Business Process Diagram
A business process diagram maps out the steps and interactions involved in a business process. These diagrams are used to analyze, improve, and communicate business workflows. They often include various elements such as activities, decision points, actors, and data flows. For instance, a business process diagram for order fulfillment might illustrate the steps from receiving an order, processing payment, updating inventory, to shipping the product and updating the customer.
Engineering System Diagram
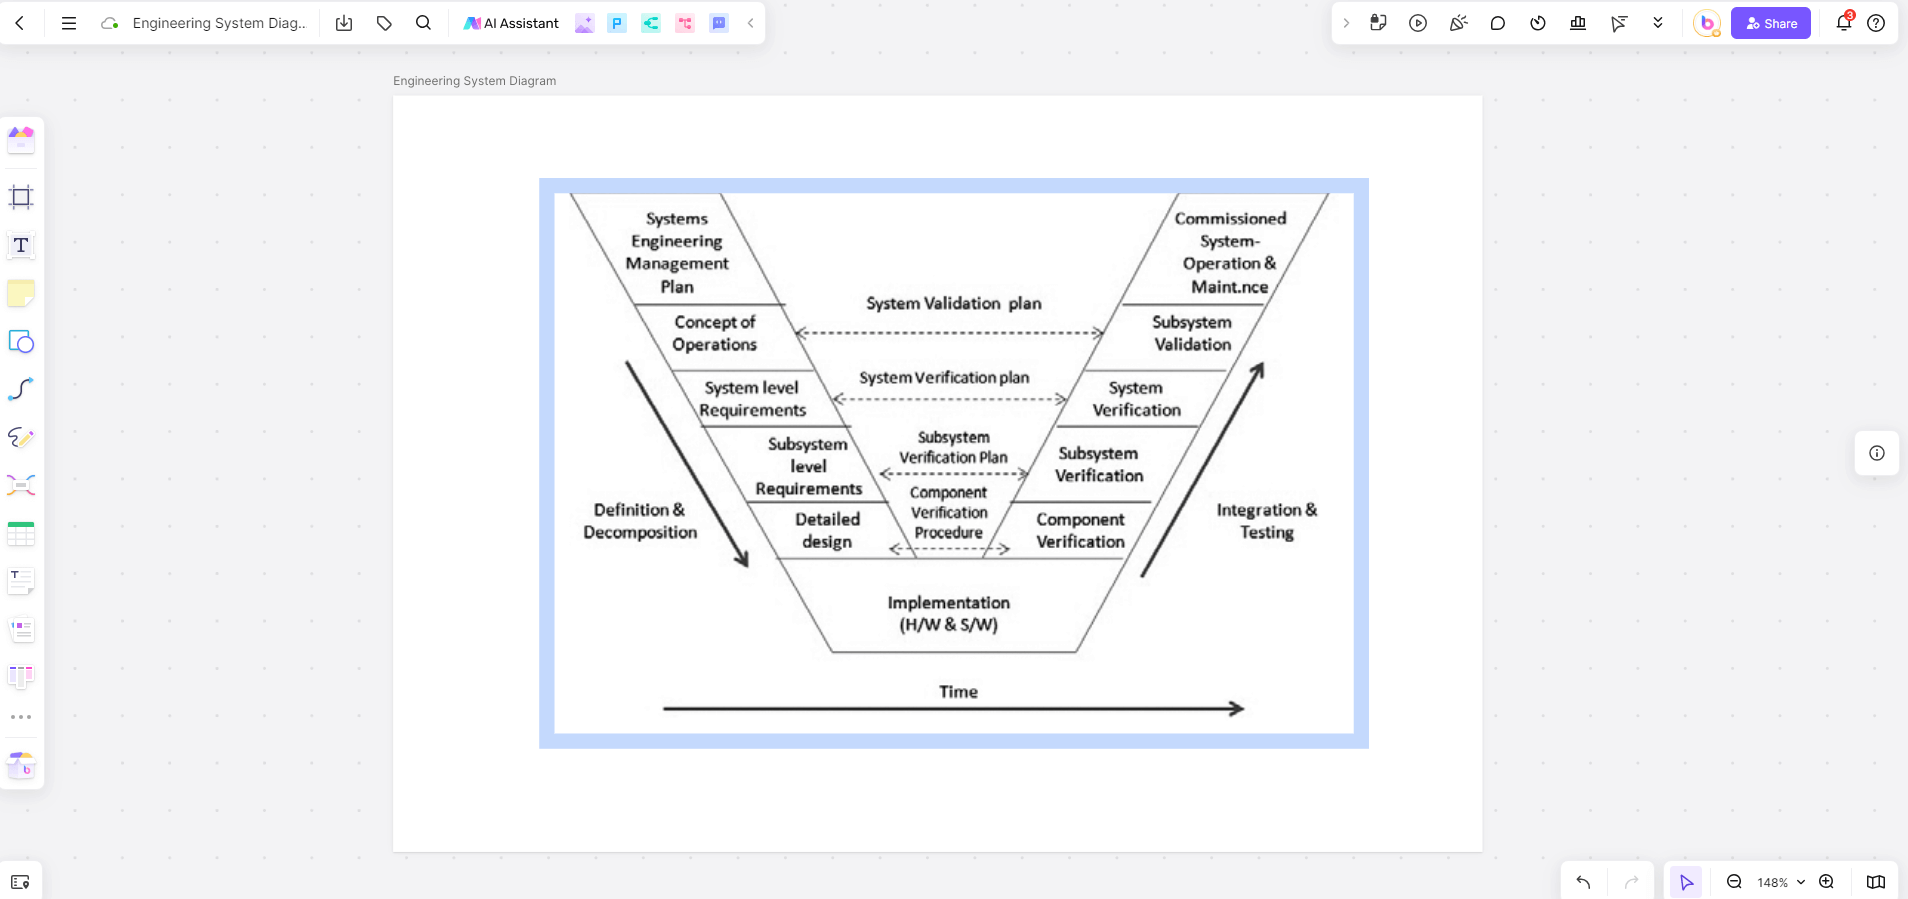
Engineering system diagrams are used to represent the components and processes within an engineering project or system. These diagrams help engineers and stakeholders understand how different parts of the system interact and identify potential issues. An example might be a diagram of a manufacturing system showing the flow of materials, machinery involved, and the process steps from raw material to finished product.
Boardmix: Online Tool for Drawing System Diagram
Creating system diagrams can be a complex task, but with the right tools, it becomes significantly easier and more efficient. Boardmix is an online tool specifically designed for creating detailed and interactive system diagrams. Here, we will delve into why Boardmix is a preferred choice and how it can be used to create comprehensive system diagrams.
Why Use Boardmix for Drawing System Diagrams
Rich Features:
Boardmix offers a robust suite of features tailored for creating detailed system diagrams, catering to various needs from IT infrastructure planning to business process modeling and engineering design. Here’s an expanded look into its capabilities:
User-Friendly Interface
Boardmix boasts an intuitive drag-and-drop interface that simplifies the creation of system diagrams. Users can quickly place and connect shapes without the need for extensive technical expertise or training. This user-friendly approach accelerates diagram creation and enhances productivity, making it accessible for both novice and experienced users alike.
Collaboration Tools
Real-time collaboration is a cornerstone of Boardmix’s functionality, allowing multiple users to collaborate on the same system diagram concurrently. Whether team members are in the same office or distributed across different locations, everyone can contribute simultaneously, fostering efficient teamwork and ensuring that all perspectives are incorporated into the diagram in real-time.
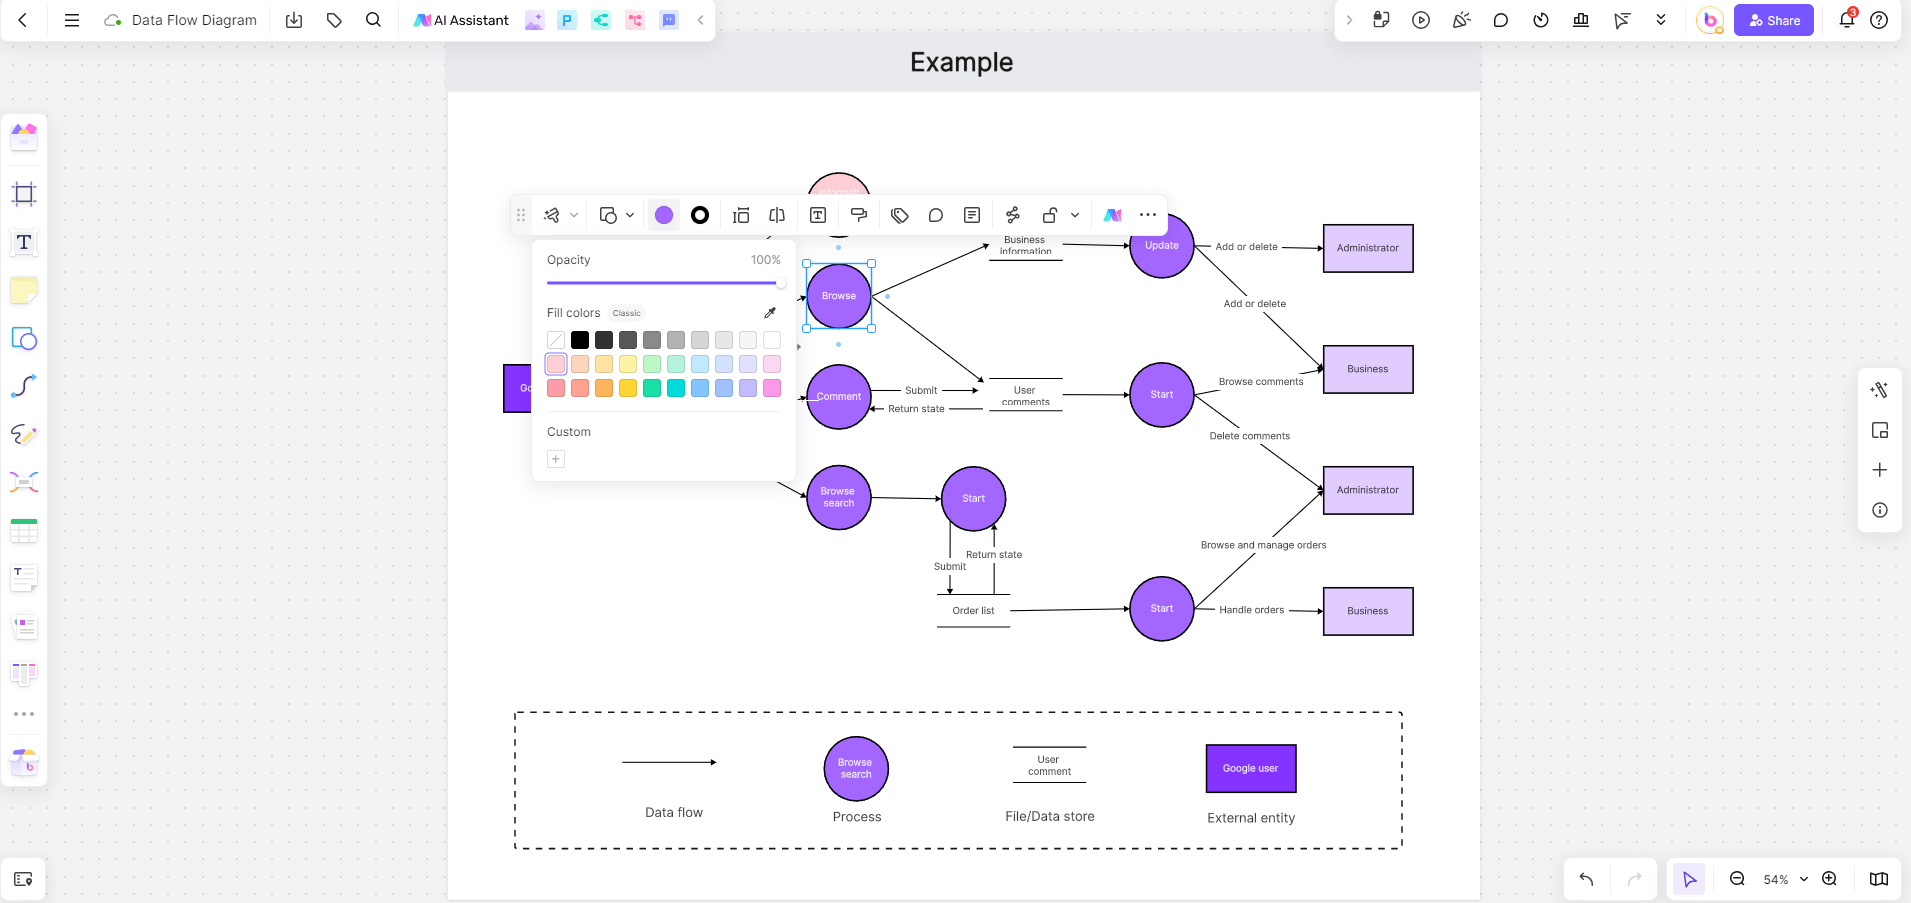
Customization Options
To meet diverse project requirements, Boardmix offers extensive customization options for system diagrams. Users can tailor diagrams to their specific needs by adjusting shapes, colors, styles, and text formatting. This flexibility enables users to create diagrams that are not only informative but also visually appealing and aligned with their organizational or project-specific aesthetics.
Integration Capabilities
Boardmix enhances workflow efficiency by seamlessly integrating with various other tools and platforms. It supports data import/export functionalities, ensuring compatibility with different file formats and facilitating smooth data exchange between Boardmix and other software applications commonly used in project management, design, and documentation.
Shapes for System Diagrams:
Boardmix features a comprehensive library of shapes and symbols designed specifically for creating system diagrams. These include:
IT System Shapes: Icons representing servers, databases, routers, firewalls, and other network components essential for IT infrastructure diagrams.
Business Process Shapes: Symbols for tasks, decision points, data stores, and actors, facilitating the modeling of business workflows and processes.
Engineering Shapes: Components such as machinery, process steps, flow lines, and material handling symbols, supporting detailed engineering design and process flow diagramming.
Application Scenarios:
IT Infrastructure Planning
In IT environments, Boardmix enables IT professionals to diagram network architectures, data centers, and system configurations with clarity and precision. The intuitive interface and specialized IT system shapes streamline the process of visualizing complex IT infrastructures, aiding in planning, troubleshooting, and documentation.
Business Process Modeling
For business analysts and process engineers, Boardmix offers tailored shapes and symbols to map out workflows, decision points, and data flows within organizational processes. This capability supports process optimization, stakeholder communication, and the identification of efficiency improvements across various business functions.
Engineering Design and Documentation
Engineers and designers benefit from Boardmix’s engineering shapes, which facilitate the creation of detailed process flow diagrams, equipment layouts, and manufacturing workflows. By visualizing engineering concepts and systems, Boardmix enhances collaboration among multidisciplinary teams and ensures alignment throughout the design and implementation phases.
How to Use System Diagram Templates to Create Diagrams of Systems
One of the standout features of Boardmix is its extensive library of templates. These templates provide a starting point for creating detailed system diagrams, saving time and ensuring consistency. Here’s a step-by-step guide on how to use these system diagram templates effectively:
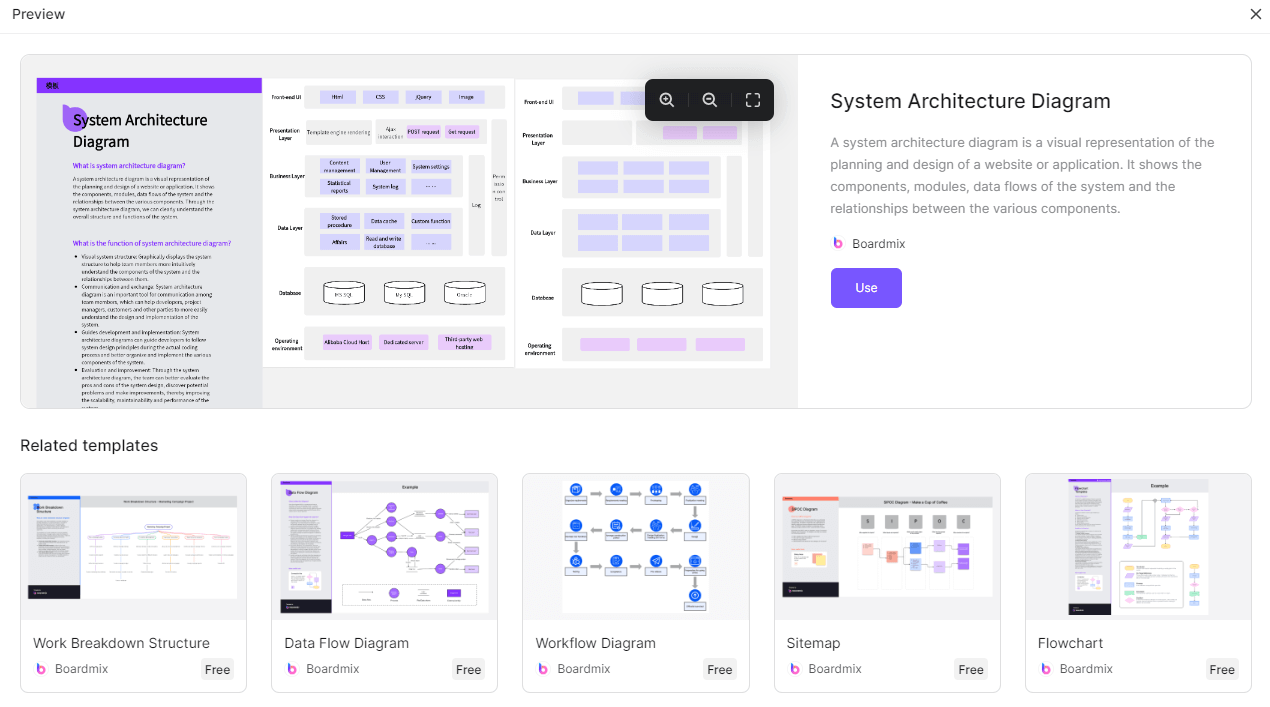
Step 1: Choose the Right Template
Start by browsing Boardmix’s template library to find a template that closely matches the type of system diagram you need to create. Whether it’s an IT system, a business process, or an engineering system, there are system diagram templates designed to cater to various requirements.
Step 2: Customize the Template
Once you’ve selected a template, customize it to fit your specific needs using Boardmix's comprehensive set of tools. Utilize features such as graphic elements, connectors, and text editing to refine your diagram. Boardmix’s drag-and-drop functionality makes it easy to adjust the layout and add new elements seamlessly.
For example, if you’re creating an IT system diagram, you might start with a network diagram template and then customize it by leveraging Boardmix’s graphic library. Add specific components like servers, firewalls, and user devices by simply dragging them onto the canvas. Use connectors to define data flows between these components, ensuring clarity and accuracy in depicting your network architecture. Additionally, customize text elements to label each component and connection, providing clear documentation of your system configuration.
Step 3: Collaborate with Team Members

Invite team members to collaborate on the diagram in real-time. Boardmix’s collaboration features allow multiple users to work on the diagram simultaneously, making it easier to gather input and make adjustments quickly.
Step 4: Finalize and Share
After customizing the template and incorporating feedback, finalize your system diagram. Boardmix allows you to export the diagram in various formats, such as PDF or PNG, or share it directly via a link. This makes it easy to present your diagram to stakeholders or integrate it into reports and presentations.
Conclusion
System diagrams are essential tools for visualizing and understanding complex systems across various fields. Whether you’re working on IT systems, business processes, or engineering projects, these diagrams facilitate analysis, communication, and decision-making. Boardmix, with its user-friendly interface, extensive customization options, and robust collaboration features, stands out as an ideal tool for creating system diagrams.
By leveraging Boardmix’s system diagram templates, users can quickly create detailed and accurate diagrams of systems, saving time and ensuring consistency. The examples of system diagrams provided in this article illustrate how Boardmix can be used effectively to create system diagrams for different purposes. Embrace the power of system diagrams and digital tools like Boardmix to enhance your productivity and communication in visualizing complex systems.


