

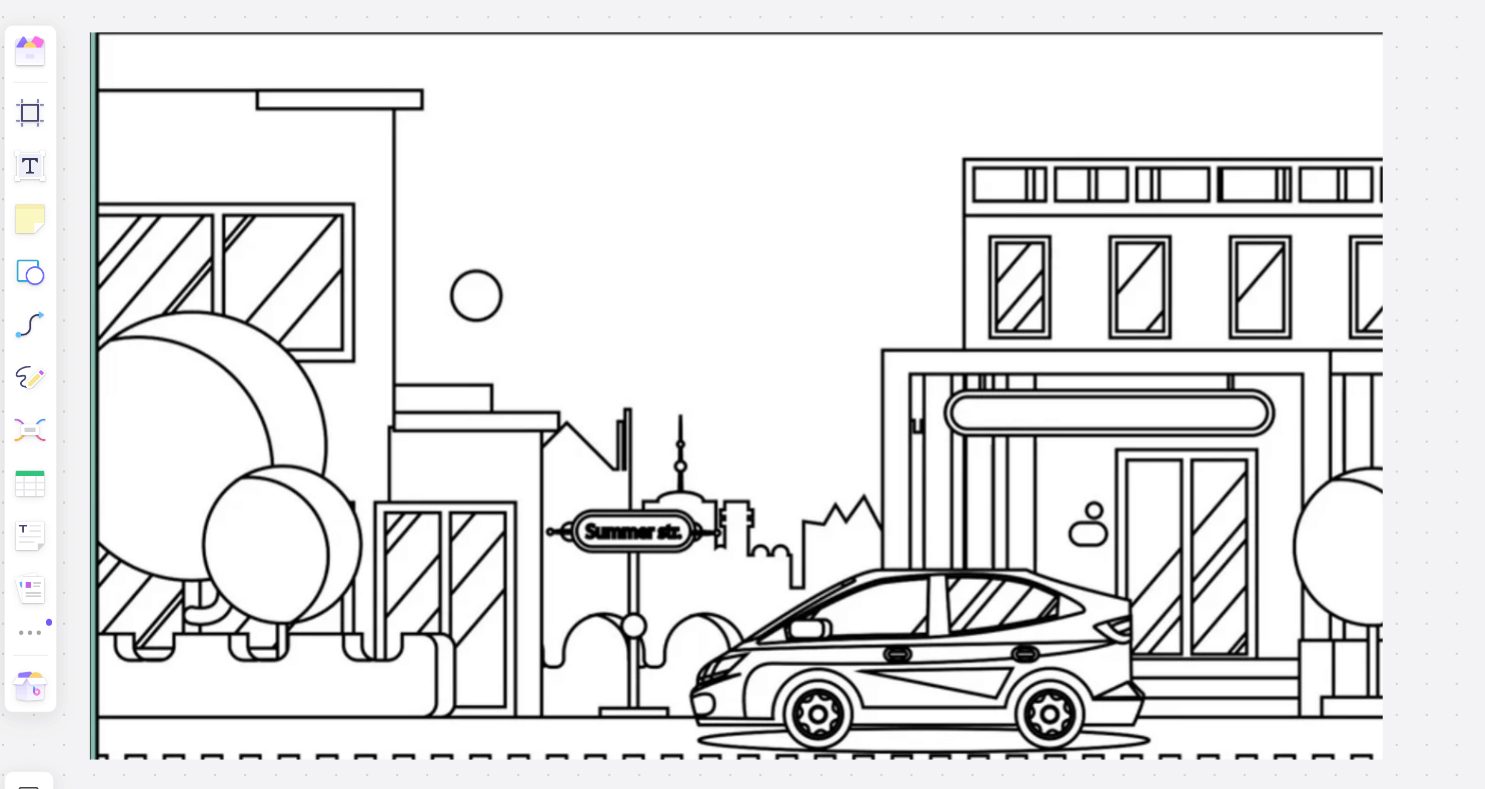
Shapes as an important element in art, which serve as the building blocks for all kinds of creative expressions. From simple sketches to complex designs, using shapes in drawing is an essential technique that artists and designers rely on to create structured and visually appealing artwork. The rise of online drawing tools has made it easier than ever to incorporate shapes into digital art, enabling creators to produce high-quality work efficiently and collaboratively.
Why use shapes in drawing art?
Shapes provide a foundation upon which more complex compositions are built. Here are some key reasons why drawing with shapes is beneficial:
Simplifies Complex Subjects: By breaking down complex subjects into basic shapes, artists can more easily understand and depict them. This method simplifies the drawing process and makes it more manageable.
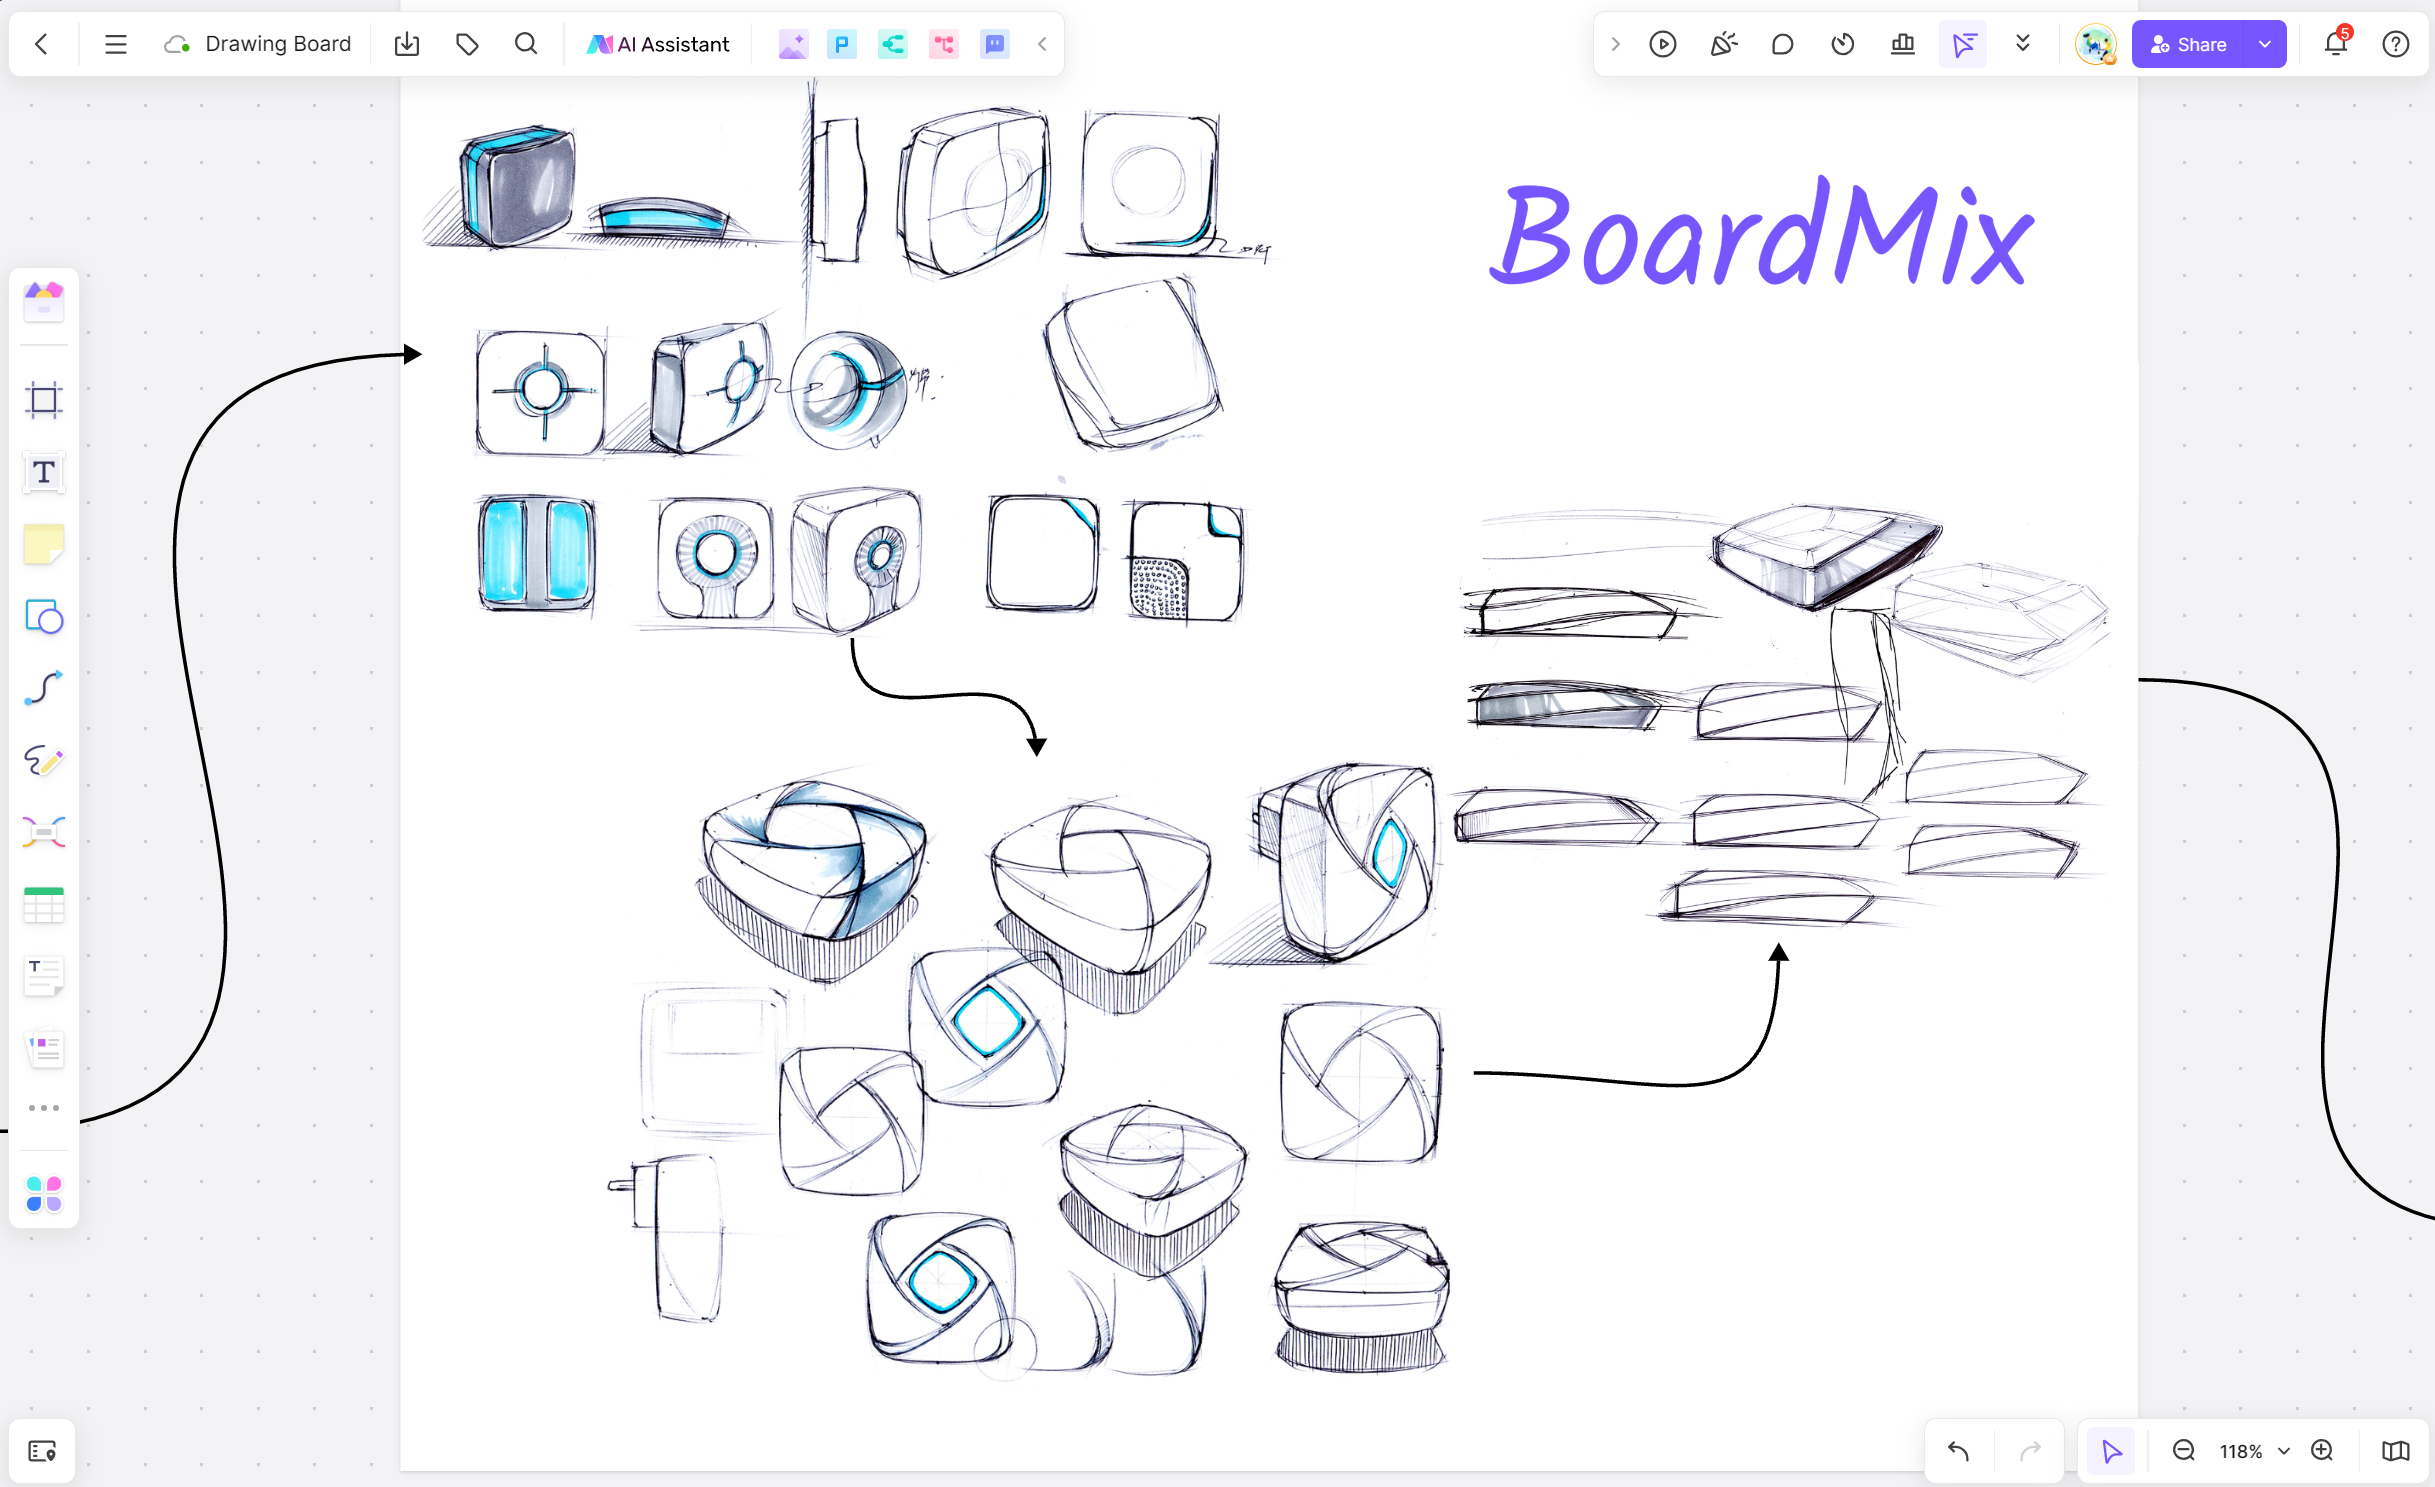
Versatility in Artistic Expression: Shapes can be used in various styles and techniques, from abstract art to realistic illustrations. This versatility allows artists to explore different creative possibilities and express their unique vision.
Enhances Visual Appeal: Shapes add structure and organization to a drawing, making it more visually appealing. They help create a cohesive and harmonious composition by guiding the viewer's eye through the artwork.
Improves Proportions and Accuracy: Starting to draw with shapes helps artists establish correct proportions and spatial relationships between different elements of the composition. This ensures that the final artwork is well-balanced and accurately represents the intended subject.
Draw with shapes in Boardmix: your online drawing tool
Boardmix is a powerful online drawing tool that offers a comprehensive shapes library and a range of features designed to enhance your drawing experience.
Features of Boardmix as drawing tool:
Extensive Shapes Library: Boardmix offers a vast collection of shapes, including basic geometric shapes, flowchart symbols, UML shapes, and network topology icons.
Drag-and-Drop Interface: The intuitive drag-and-drop interface allows users to easily add, arrange, and customize shapes within their drawings.
Customizable Templates: Start your projects quickly with customizable templates designed for various types of diagrams and illustrations. Meanwhile, you can use the different shapes to edit the template and change the content to meet your needs.
AI-Powered Drawing: Boardmix leverages artificial intelligence to help you create accurate and professional diagrams quickly. It can analyze data input and generate diagrams automatically, saving you time and effort.
Integration with Other Tools: Seamlessly integrate Boardmix with other productivity tools like cloud storage services and project management software.
Draw flowcharts
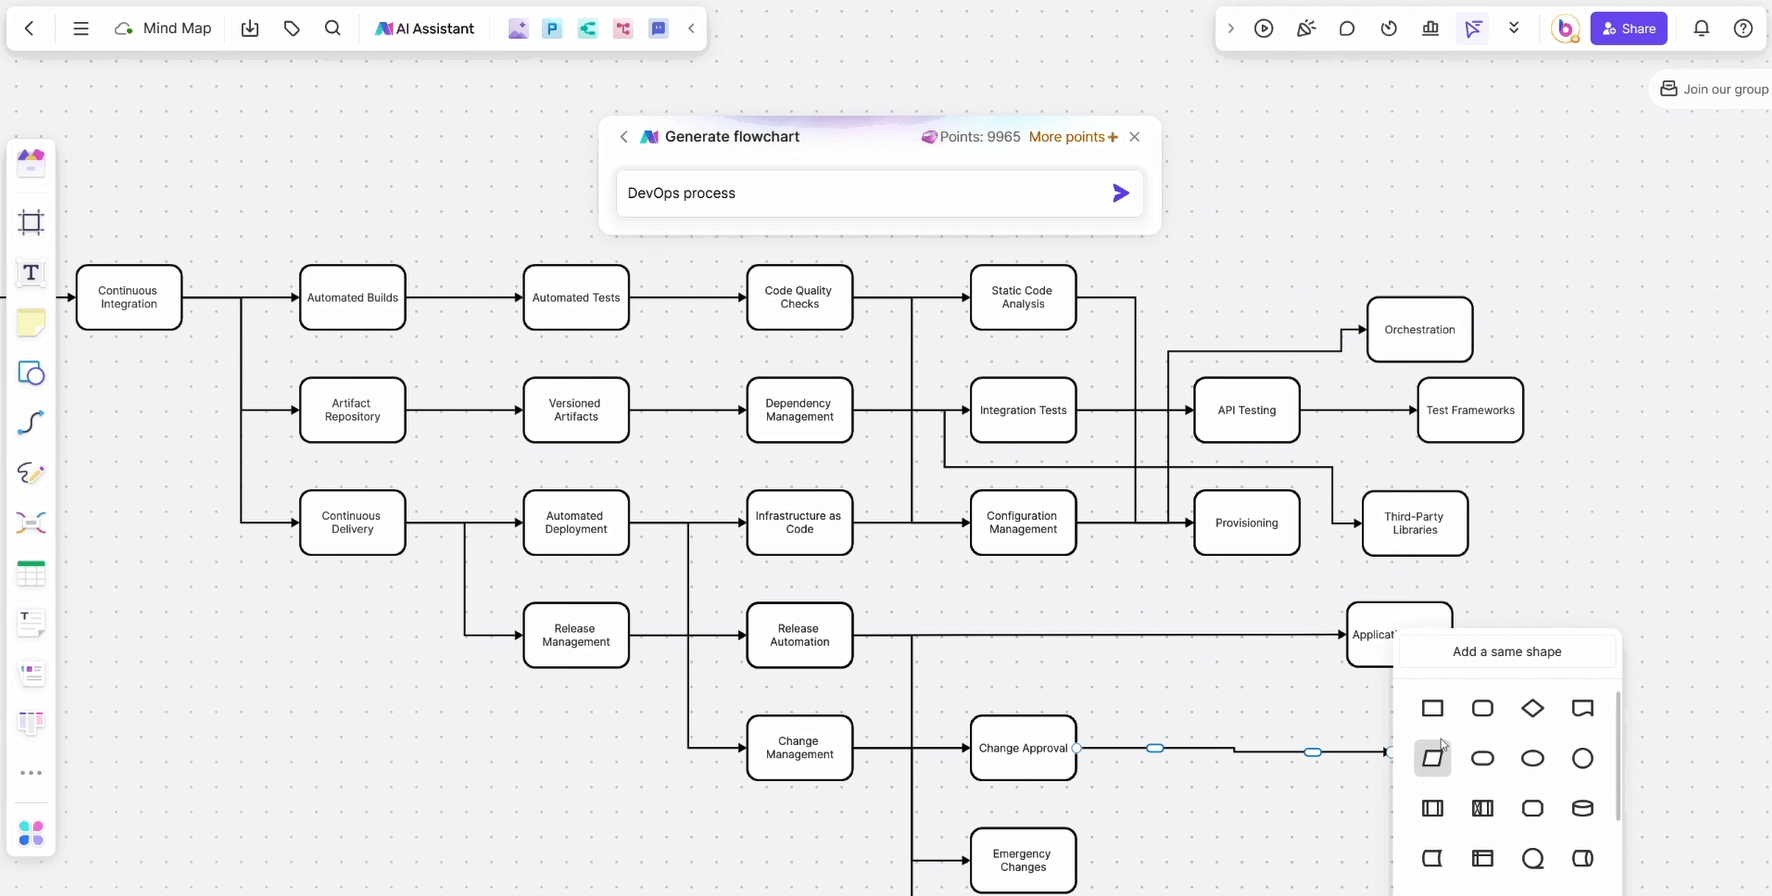
Flowcharts are essential tools for visualizing processes and workflows, and creating them in Boardmix is straightforward thanks to its intuitive interface and extensive shapes library. Here’s a step-by-step guide on how to draw with shapes in Boardmix:
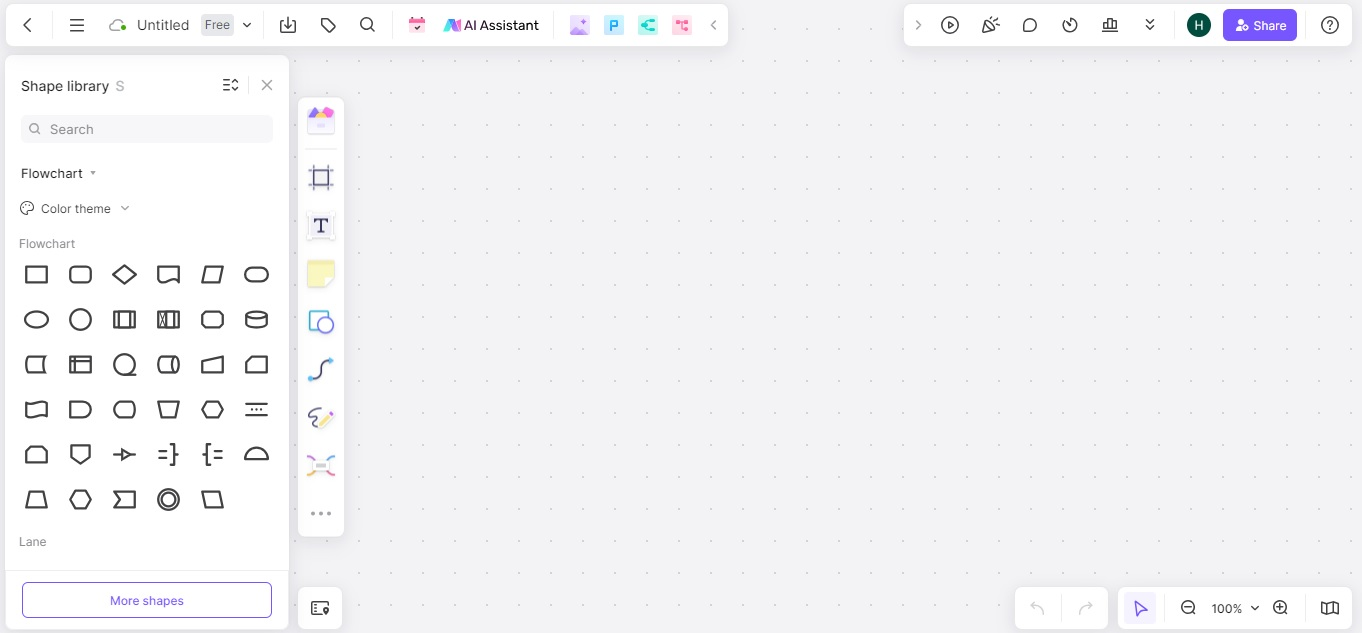
1. Select flowchart shape
When you log in to the Boardmix workplace, you can open the shapes library, and click on the shapes library icon to open a panel displaying various shape categories. Navigate to the flowchart section in the shapes library. Here you’ll find basic shapes like rectangles (processes), diamonds (decisions), ovals (start/end), and arrows (flow lines).
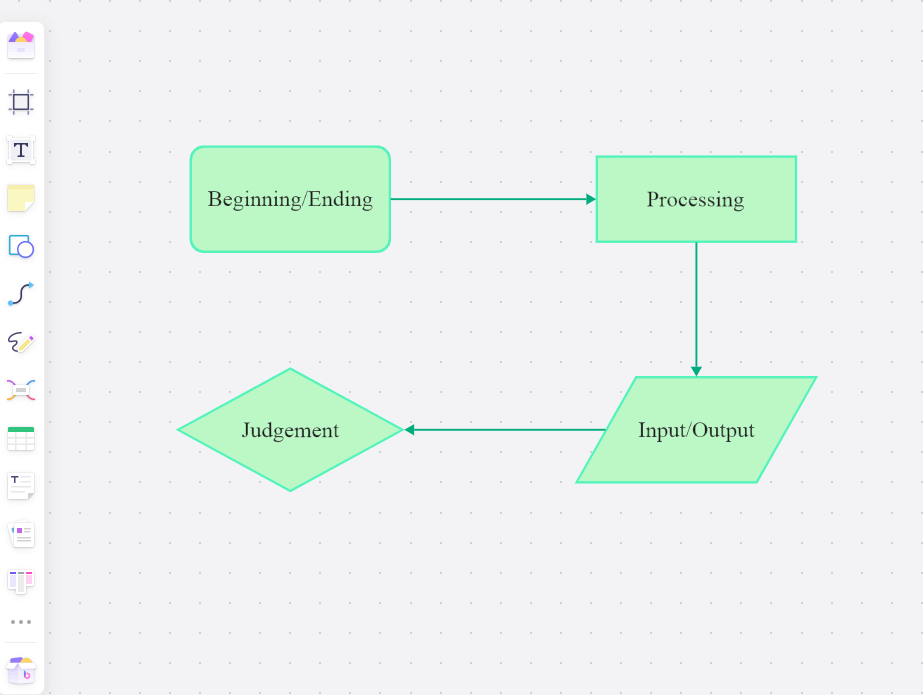
2. Add and Arrange Shapes
Select the shapes you need and drag them onto the whiteboard. Start with an oval shape to represent the start of your flowchart. Place the shapes on the whiteboard in the sequence that represents your process. For example, follow the start shape with a rectangle for the first process step, then a diamond for a decision point, and so on.
3. Connect Shapes
Select the arrow tool from the toolbar and draw arrows between shapes to indicate the flow of the process. Click on the starting shape, drag the arrow to the next shape, and release. Customize the arrows by changing their thickness, color, and style to make the flowchart more visually appealing and easier to follow.
4. Label Shapes and Arrows
Click on each shape and type to add labels that describe each process step, decision, or terminator. Use concise and clear text to ensure the flowchart is easy to understand. Optionally, add labels to the arrows to provide additional context or describe the flow between steps.
5. Customize the Flowchart
Customize the appearance of your flowchart by resizing shapes and changing their colors. This can help highlight key steps or differentiate between different types of processes. Enhance your flowchart by adding relevant icons or images. This can make the flowchart more engaging and informative.
Draw time sequence diagram
Time sequence diagrams, also known as sequence diagrams, are used to depict interactions between different entities over time. They are particularly useful in software engineering to represent how objects interact in a given scenario.
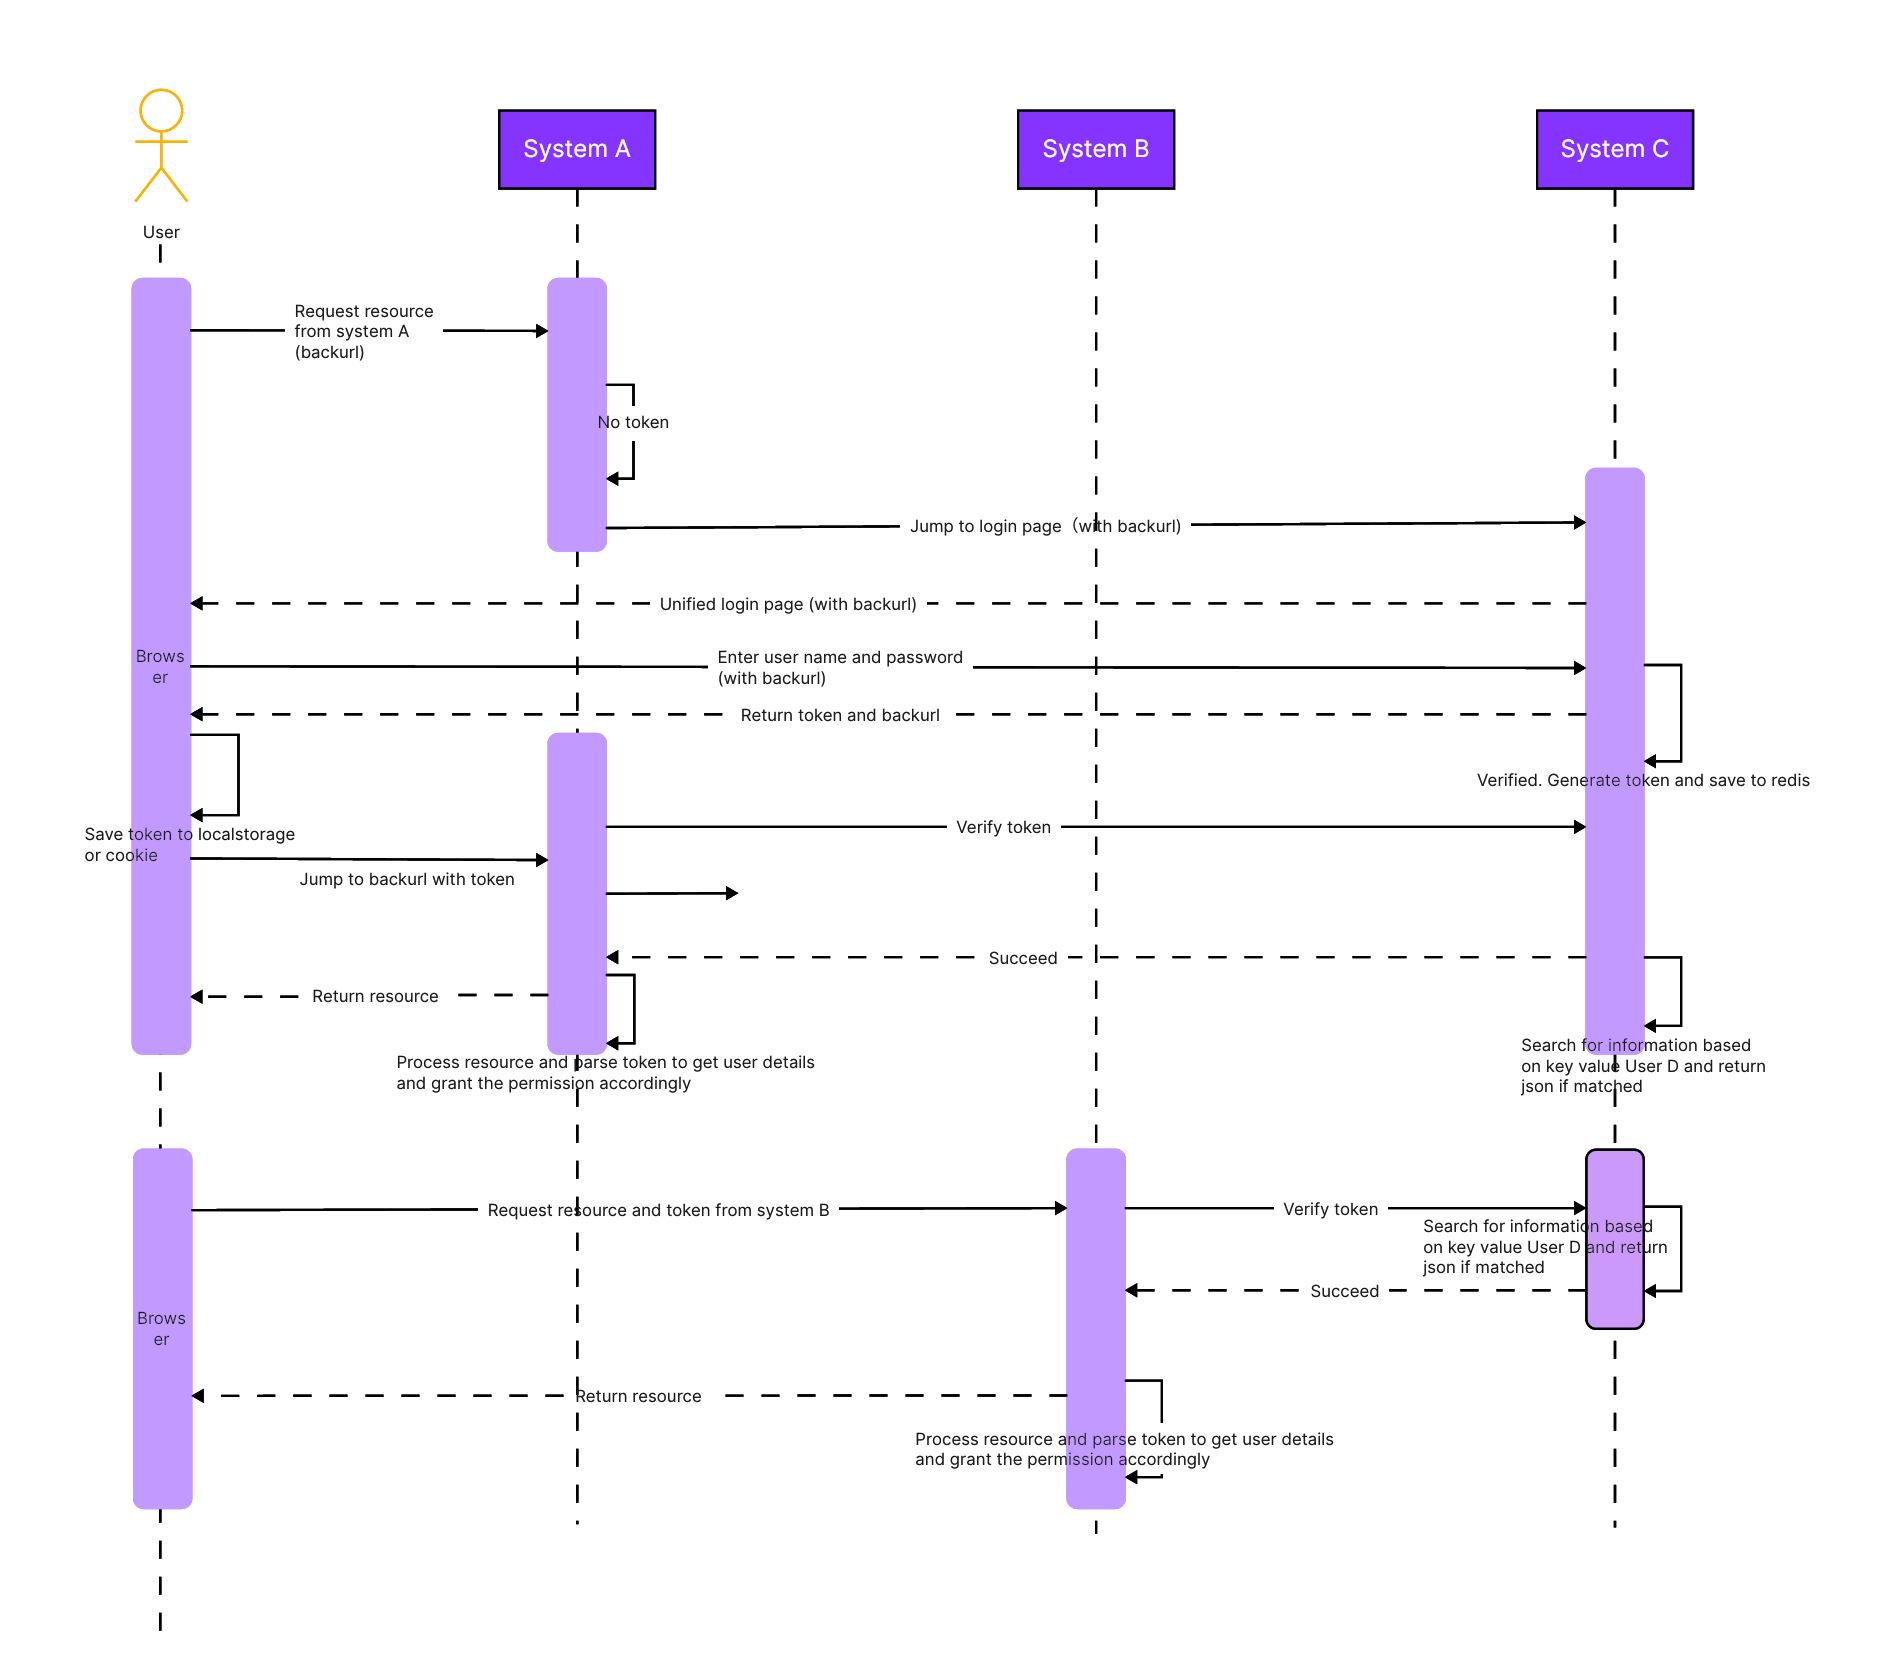
1. Identify the Entities and Lifelines
If you want to draw art images with shapes, firstly should first determine the entities (objects or classes) that will participate in the interactions. Each entity will have its lifeline. Navigate to the shapes library and select vertical lines to represent the lifelines of each entity. Drag these lines onto the canvas and label them with the names of the entities.
2. Add Messages and Interactions
Use arrows to represent messages exchanged between entities. Select an arrow shape from the shapes library and drag it between the lifelines to indicate communication. Click on each arrow to add labels that describe the messages. Include details such as the message name, parameters, and any return values.
3. Organize Messages Chronologically
Arrange the messages in chronological order from top to bottom to represent the sequence of interactions over time. Extend the lifelines as necessary to accommodate the interactions. Lifelines should be long enough to include all the messages exchanged during the scenario.
4. Add Activation Bars
Add activation bars to the lifelines to represent the duration of an entity's activity. Select rectangular shapes from the shapes library and place them along the lifelines at the points where the entity is active. Optionally, label the activation bars to provide additional context about the activities being performed.
5. Customize the Diagram
Customize the appearance of your diagram by resizing shapes and changing their colors to make it more visually appealing and easier to understand. Users can add notes or annotations to provide further explanations or details.
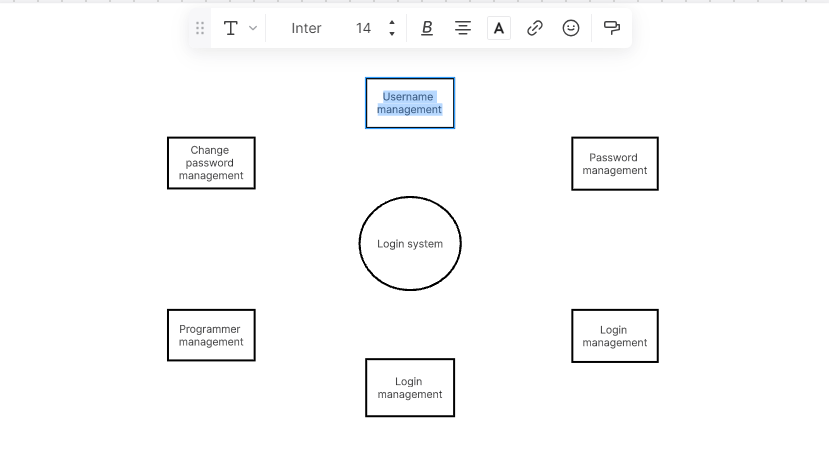
Draw class diagram
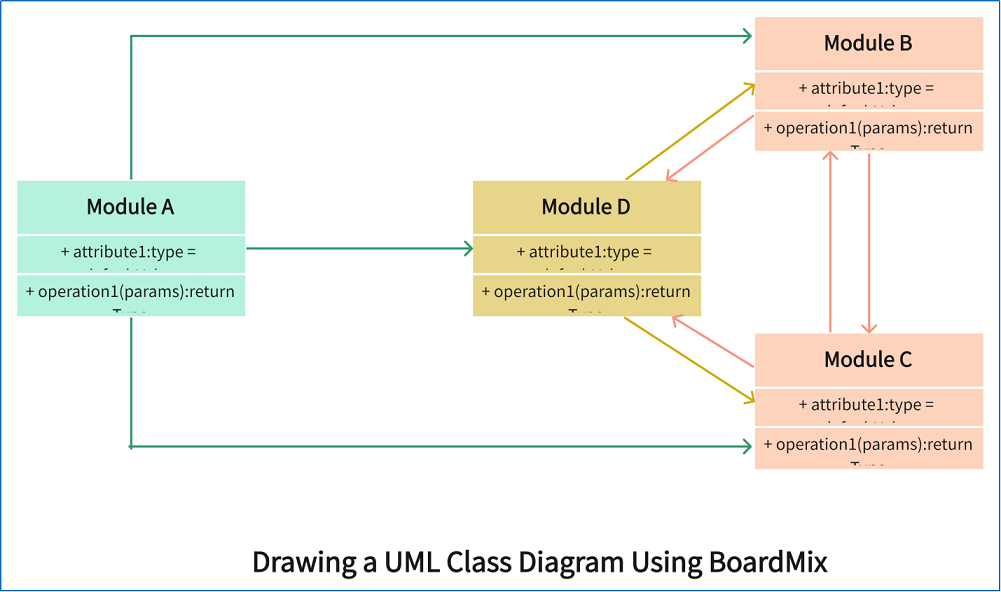
Class diagrams are an essential tool in software engineering, providing a visual representation of the structure of a system by showing its classes, attributes, operations, and relationships.
1. Create a New Project
Log in to your Boardmix account and create a new project. Choose a blank canvas or select a class diagram template to get started. Explore the Boardmix workspace, including the toolbar, shapes library, and canvas to quickly access the tools you need.
2. Add Classes
Click on the shapes library icon to open a panel displaying various shape categories. Navigate to the UML section in the shapes library. Select the rectangle shapes typically used to represent classes. Drag the class shapes onto the canvas. Each class should be represented by a rectangle divided into three sections: the top section for the class name, the middle section for attributes, and the bottom section for operations.
3. Define Class Attributes and Operations
Click on the top section of each class rectangle enter the class name, and go into the middle section of each class rectangle to add attributes. List the attributes of the class, specifying their visibility (e.g., private, public), data type, and default values if applicable. Users also can click on the bottom section of each class rectangle to add operations (methods). List the operations of the class, specifying their visibility, return type, and parameters.
4. Establish Relationships Between Classes
Determine the relationships between the classes, such as associations, inheritances, and dependencies. Select appropriate shapes from the shapes library to represent these relationships. Common shapes include association inheritance and dependency.
5. Connect Classes
Draw lines between the classes to represent their relationships. Attach the lines to the relevant sections of the class rectangles. Add labels to the relationship lines to describe the nature of the relationship (e.g., one-to-many, inheritance).
Draw data flow diagram
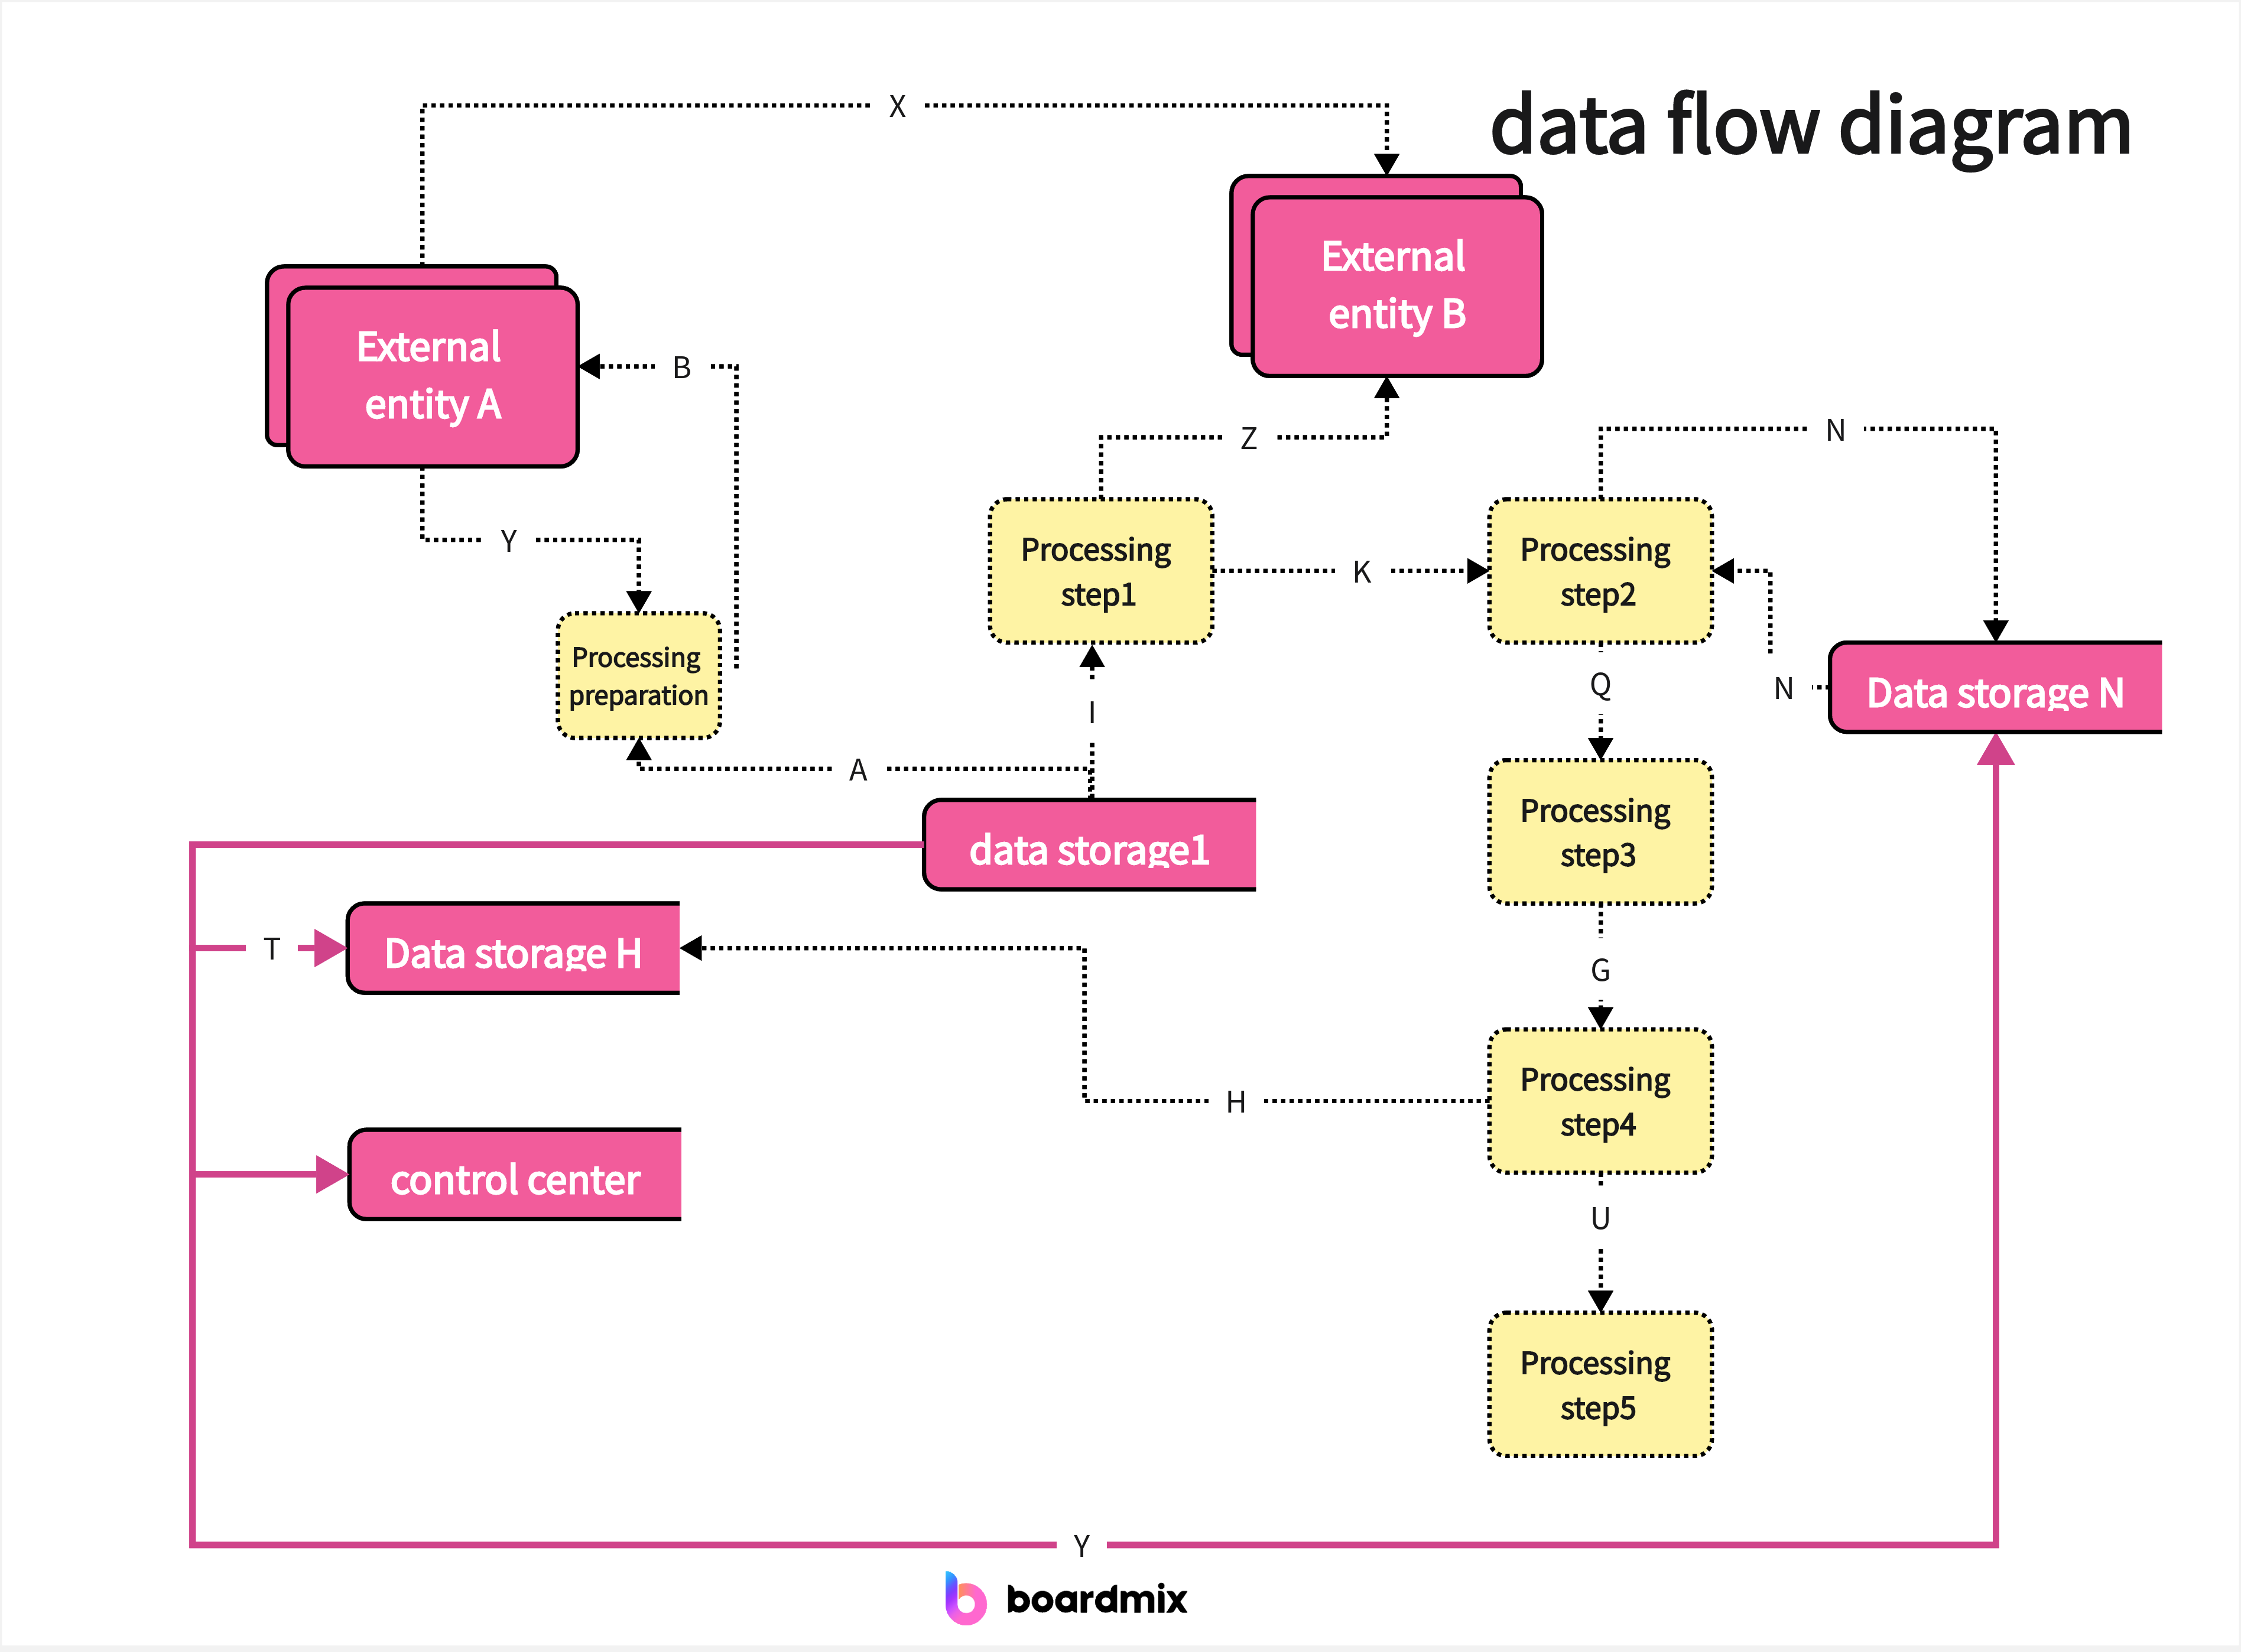
Data flow diagrams help in understanding how data moves between different processes, data stores, and external entities. Using Boardmix to create DFDs is efficient and straightforward due to its intuitive interface and comprehensive shapes library.
1. Identify the Components of Your DFD
-External Entities: Identify the external entities (sources or destinations of data) that interact with your system.
-Processes: Determine the processes that transform the data within the system.
-Data Stores: Identify the data stores where data is held for processing.
-Data Flows: Determine how data moves between the entities, processes, and data stores.
2. Add Shapes to Represent Components
-External Entities: Select rectangle shapes from the shapes library to represent external entities. Drag these shapes onto the canvas and label them accordingly.
-Processes: Use rounded rectangles or circles to represent processes. Place these shapes on the canvas and label them with process names or IDs.
-Data Stores: Use open-ended rectangles or parallel lines to represent data stores. Drag these shapes onto the canvas and label them.
3. Connect the Components with Data Flows
-Draw Data Flow Arrows: Select the arrow tool from the shapes library and draw arrows between the shapes to represent the flow of data. Ensure that the direction of the arrows accurately reflects the movement of data.
-Label Data Flows: Click on each arrow to add labels that describe the data being transferred. Use concise and clear text to ensure the DFD is easy to understand.
4. Organize and Validate the DFD
Organize the components on the canvas to create a logical and clear flow of data. Position external entities at the edges, processes in the center, and data stores near the processes they interact with.
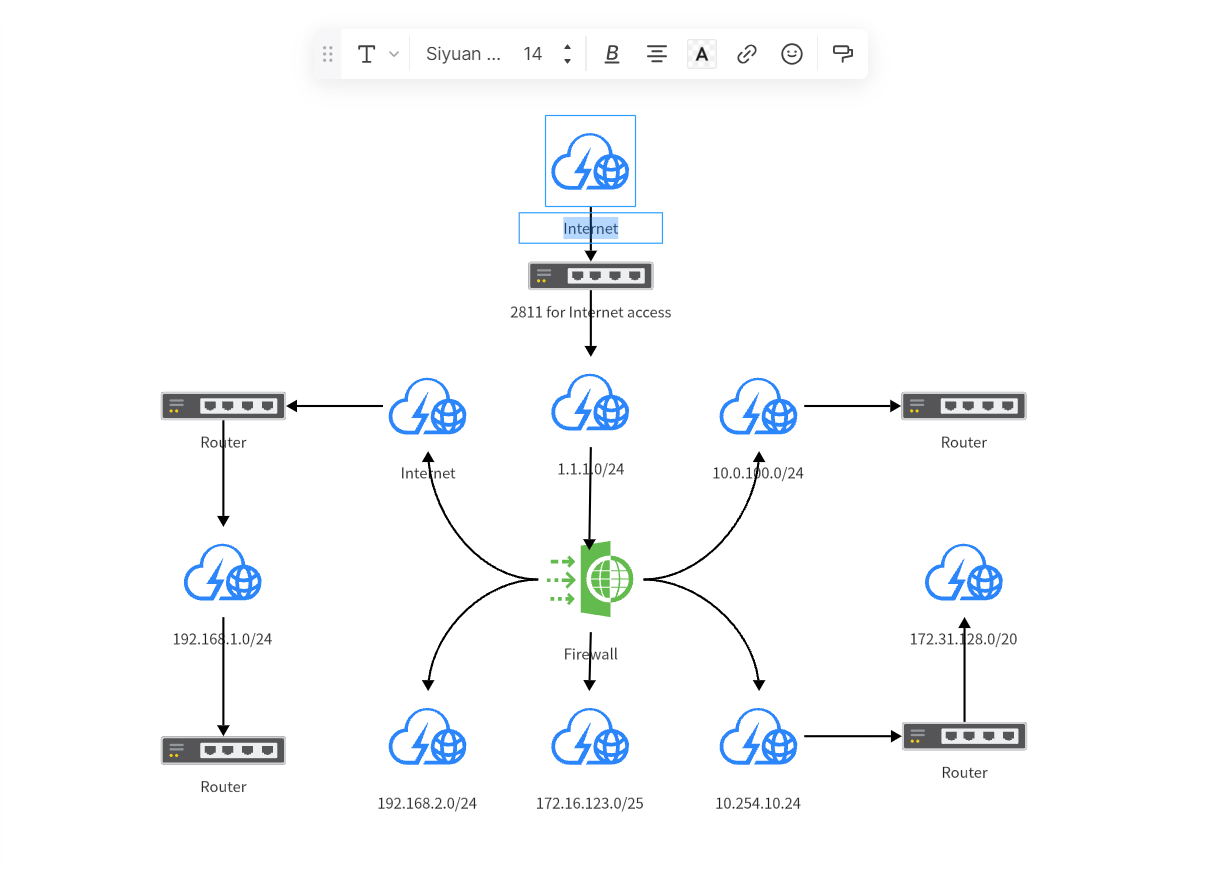
Draw network topology
Drawing network topology diagrams with shapes in Boardmix is an effective way to visualize and document the arrangement and connections of network devices.
1. Identify the Components of Your Network
Identify the devices that will be included in your network diagram, such as routers, switches, hubs, servers, and workstations. Determine how these devices are interconnected using cables or wireless connections.
2. Add Shapes to Represent Network Devices
Click on the shapes library icon to open a panel displaying various shape categories. Navigate to the network section in the shapes library. Drawing with shapes online that represent different network devices, such as routers, switches, servers, and workstations.
3. Establish Connections Between Devices
Select lines from the shapes library to represent the connections between devices. You can use straight lines for wired connections and dashed lines for wireless connections. Draw lines between the devices to represent their connections. Attach the lines to the relevant ports on the device shapes. Finally, you can add labels to the connection lines to describe the type of connection (e.g., Ethernet, Wi-Fi) and any relevant specifications (e.g., speed, protocol).
4. Customize the Diagram
Customize the appearance of your diagram by drawing with shapes online and changing their colors to make it more visually appealing and easier to understand. Review the diagram to ensure that all devices are correctly labeled and connected. Verify that the connections accurately represent the network topology.
Conclusion
Using shapes in drawing art is a powerful technique that simplifies the creation process, improves accuracy, and enhances visual appeal. Boardmix, with its extensive shapes library and user-friendly features, provides an excellent platform for creating various types of diagrams and illustrations.
By leveraging the power of shapes and the advanced features of Boardmix, you can create professional-quality drawings that communicate complex information clearly and effectively. Whether you're a beginner or an experienced artist, Boardmix is a valuable tool that can help you achieve your creative and professional goals.


