

ER diagrams are crucial for organizing data and understanding relationships between different entities, making them invaluable in both professional and everyday contexts. You'll learn a simple four-step process to create effective ER diagrams, enhancing clarity and efficiency in your data management tasks.
What is an ER Diagram?
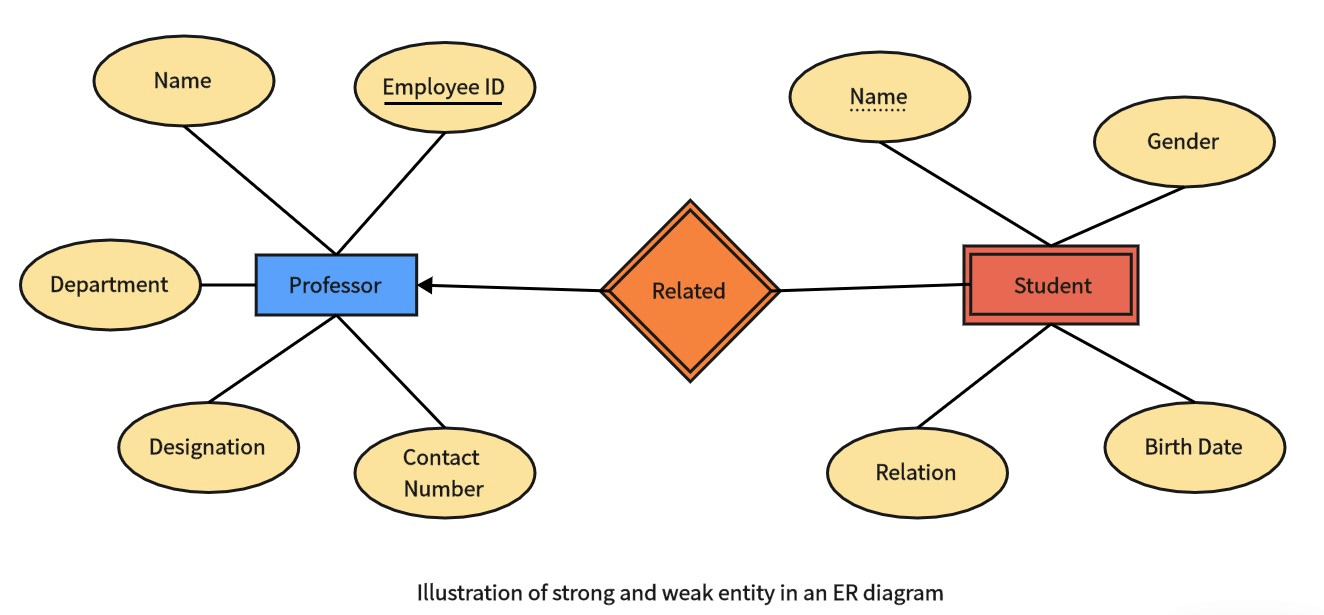
An ER diagram, or Entity-Relationship diagram, is a conceptual tool often used to model real-world scenarios. It consists of three main elements: entities, attributes, and relationships. Entities are represented by rectangles, attributes by ellipses, and relationships by diamonds, all connected by lines to show their interconnections. Understanding these relationships is essential for building a clear database.
Components of an ER Diagram
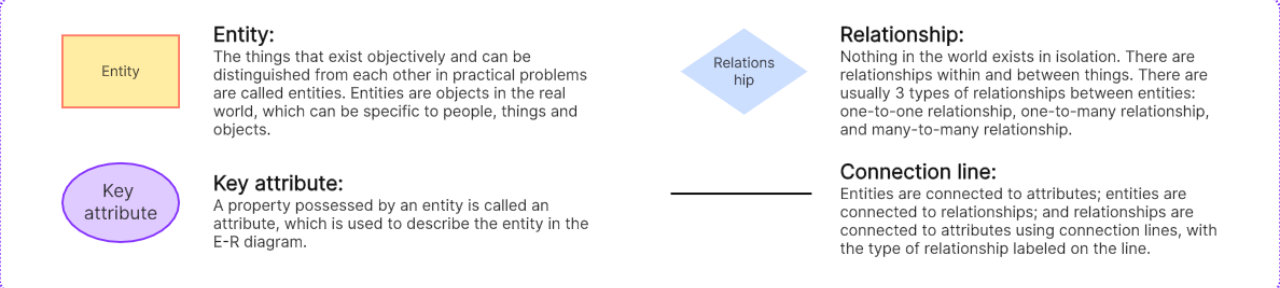
Rectangle: Represents an entity
Entities are objects that exist objectively, such as users, products, orders, and suppliers. In simpler terms, each table name in your database can be considered an entity object. A system comprises multiple entity objects, each having certain relationships and attributes.
Ellipse: Represents an attribute
-User entity attributes: ID, Name, Age, Phone, ID Number
-Product entity attributes: ID, Product Name, Product Type, Price, Image, Description, Supplier Name
-Order entity attributes: ID, Order Number, User Name, Product Name, Order Date
-Supplier entity attributes: ID, Name, Address, Contact Number
Diamond: Represents a relationship
For example, the relationship between users and products can be a purchase relationship (one user buys multiple products), and the relationship between orders and products can be an inclusion relationship (one order includes multiple products).
Lines
Connect entities to attributes, entities to relationships, and relationships to attributes, with lines marked to show the type of relationship.
Types of Relationships in ER Diagrams
One-to-One (1:1)
Each entity in set A is related to at most one entity in set B and vice versa.
One-to-Many(1:n)
An entity in set A is related to multiple entities in set B, but an entity in set B is related to at most one entity in set A.
Many-to-Many(1:m)
Each entity in set A is related to multiple entities in set B and vice versa.
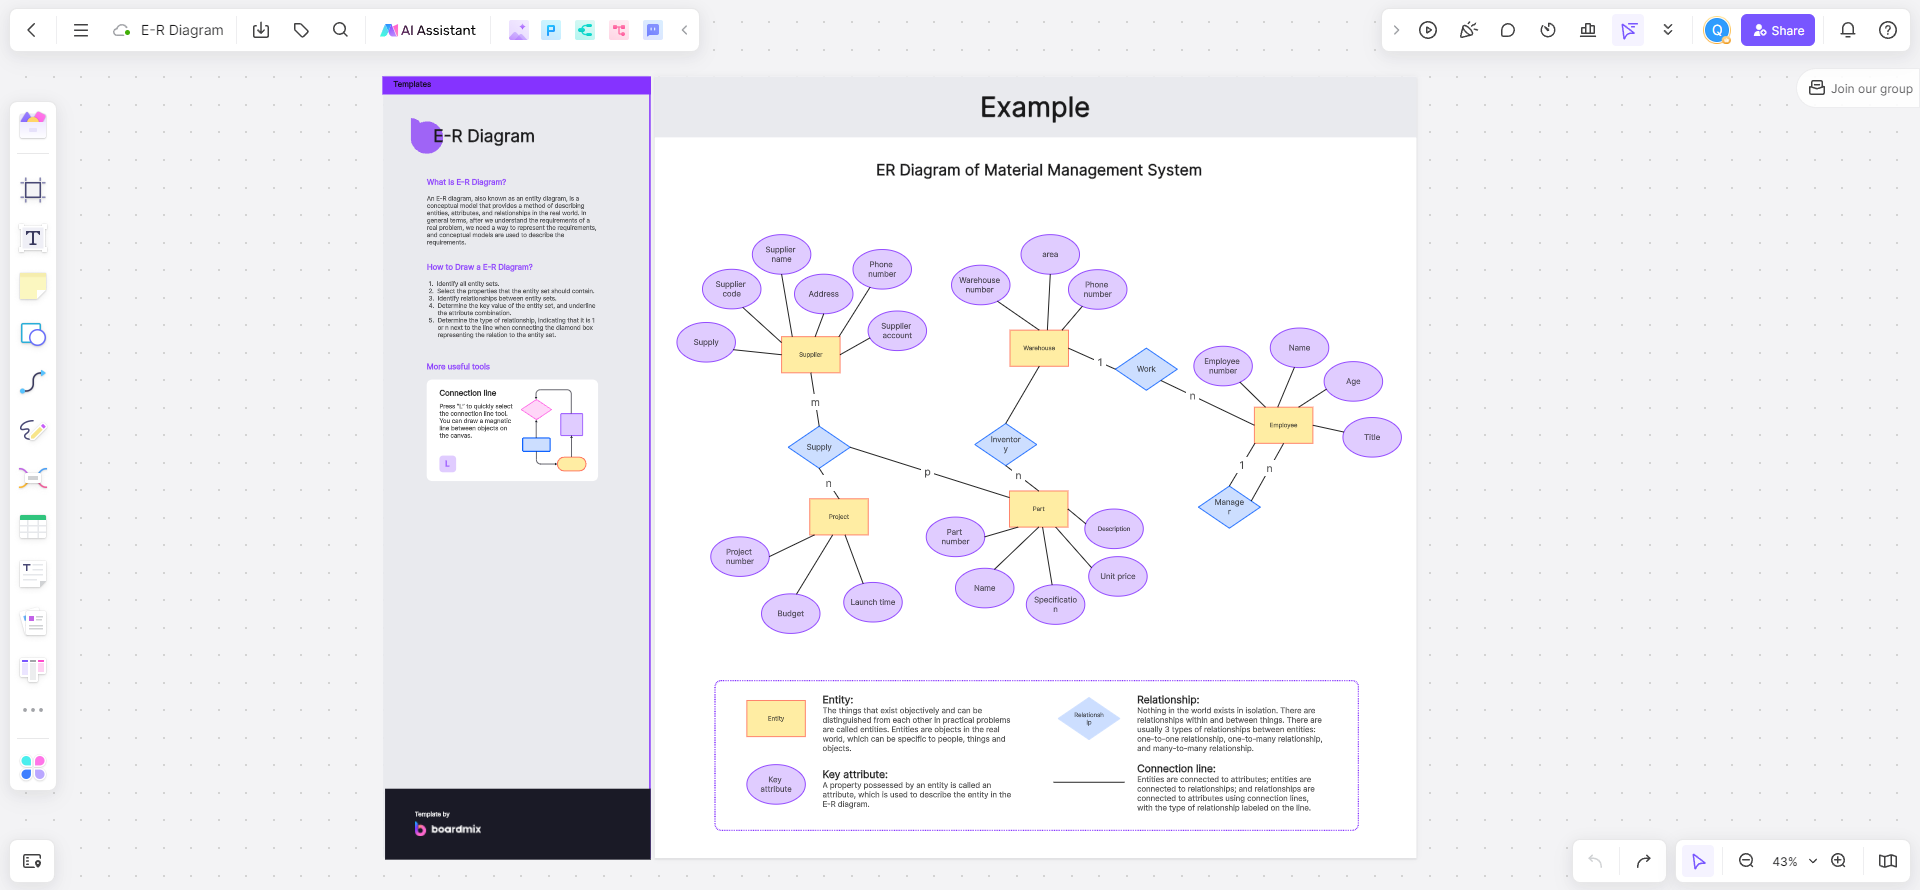
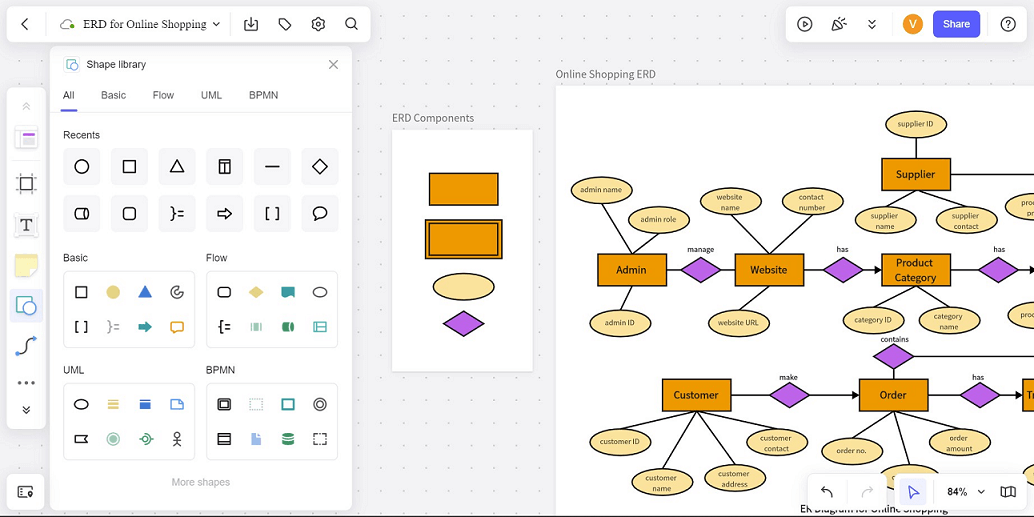
How to Draw an ER Diagram
Before drawing an ER diagram, choose an appropriate tool such as Boardmix, Microsoft Visio, Lucidchart, or draw.io. Boardmix is particularly user-friendly with features like rich functionality, simple operation, online collaboration, multi-device login, and one-click export. Here’s how to draw an ER diagram using Boardmix:
(1) Identify Entities
-Identify all entities in your database. Entities are the basic objects in your system, which can be real-world objects (e.g., people, places, items) or conceptual ones (e.g., orders, transactions, events).
-Name each entity and determine its attributes (e.g., a person entity might have attributes like name, age, and gender).
(2) Identify Relationships
-Determine the relationships between entities. Relationships describe how one entity connects to another.
-Identify the type of relationship: one-to-one, one-to-many, or many-to-many.
-Name each relationship and determine any relationship attributes if applicable.
(3) Draw the ER Diagram
-Represent entities with rectangles and relationships with diamonds. Connect entities with relationships using lines.
-List attributes inside the entity boxes and specify the relationship types next to the lines.
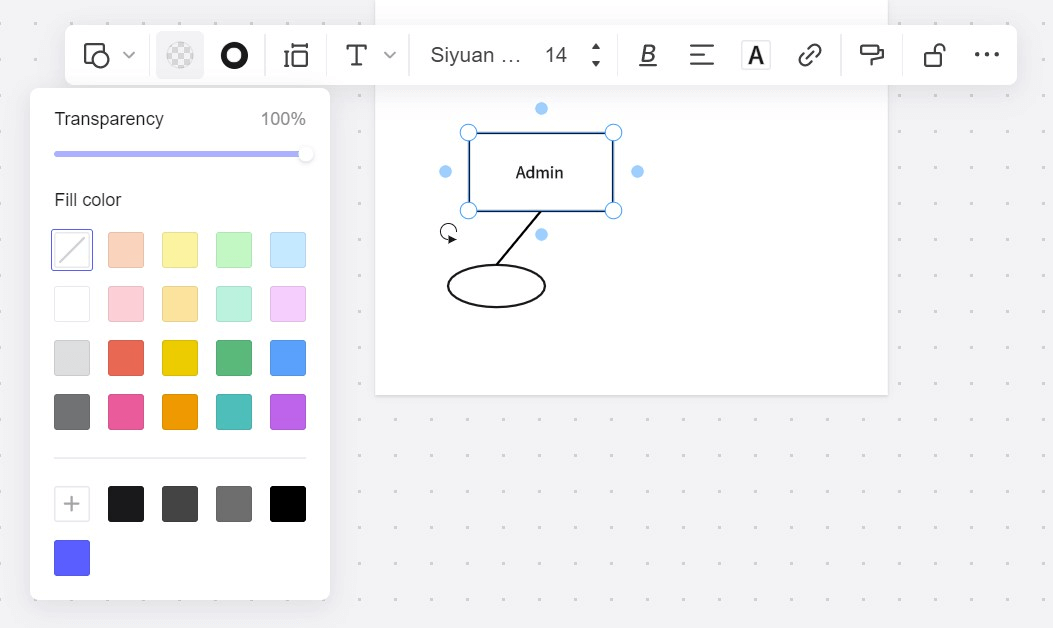
(4) Refine and Beautify
-Use the tools in the sidebar to refine the diagram’s appearance, adding decorative elements like stickers, and adjusting fill colors, text sizes, and line colors.
-Boardmix offers a variety of ER diagram templates that you can use directly and modify as needed to expedite the drawing process.
After finishing the diagram, click the 'Share' button in the upper right corner to share the ER diagram or the 'Download' button in the upper left corner to export the diagram in PNG/JPG, SVG, or PDF format for local storage.
The Benefits of Drawing ER Diagrams on Boardmix
-Rich Tools and Templates: Boardmix offers a wide range of drawing tools and pre-designed templates, including ER diagram templates, which can speed up the creation process while ensuring consistency and professionalism.
-Flexibility: Users can freely draw on the canvas, adding text, shapes, icons, etc., to customize the ER diagram’s appearance and layout.
-Strong Collaboration: As an online collaborative platform, Boardmix allows multiple users to edit and comment on the same ER diagram simultaneously, making it easier for team members to participate in its creation and discussion.
-Cross-Platform Support: Boardmix is accessible on various devices, including desktops, laptops, tablets, and smartphones. Users can access and edit ER diagrams through a web browser or the Boardmix mobile app.


