

A program flowchart, also known as a process flow diagram, is a graphical representation that describes the specific steps of program execution using standardized symbols. The design of a program flowchart is based on the analysis of input and output data and processing procedures, marking the main operational steps and content of the computer.
At work, we often use program flowcharts to make our tasks clearer and more organized. This article will introduce an efficient and practical tool for creating program flowcharts-Boardmix online whiteboard. It is highly convenient for drawing various professional business process diagrams, program flowcharts, data flow diagrams, network topology diagrams, and more. It features a simple operation and provides a vast library of graphic templates, simplifying user task content and improving work efficiency!
What is a Program Flowchart?
A program flowchart is a diagrammatic representation used to illustrate algorithms, workflows, or processes. It uses different types of boxes to represent various kinds of steps, with arrows connecting each pair of steps.
In actual work, a concise and precise program flowchart can help us outline the sequence of an entire project or activity, providing clear logic and smooth thinking. Meanwhile, it can also be used to check for any missing elements in the entire execution plan, avoid redundancies and oversights in activities, and make timely corrections, enhancing communication efficiency within the team.
What are the Various Parts of a Program Flowchart Means?
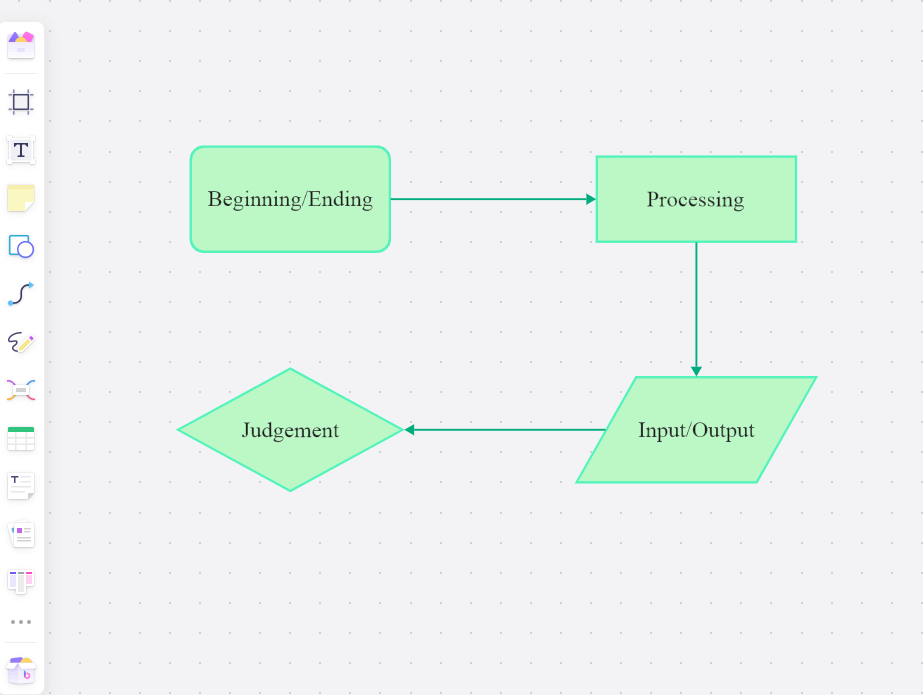
In a program flowchart, each box represents different operations or steps, common boxes include:
-Rectangle: Represents a specific operation or command, such as "calculate sum" or "print results".
-Diamond: Represents a decision point, typically a "yes" or "no" question, like "whether the expected goal is achieved?".
-Circle or Oval: Represents the start or end.
-Parallelogram: Represents input or output operations, such as "read data" or "display results".
-Arrow: Indicates the direction of control flow.
These different boxes are connected by arrows to form a complete flowchart, describing the execution process of the program from start to finish.
Four Free Program Flowchart Templates
To fully utilize different program flowcharts, the Boardmix community resources offer four common program flowchart template resources, which help find a suitable program flowchart in the daily work.
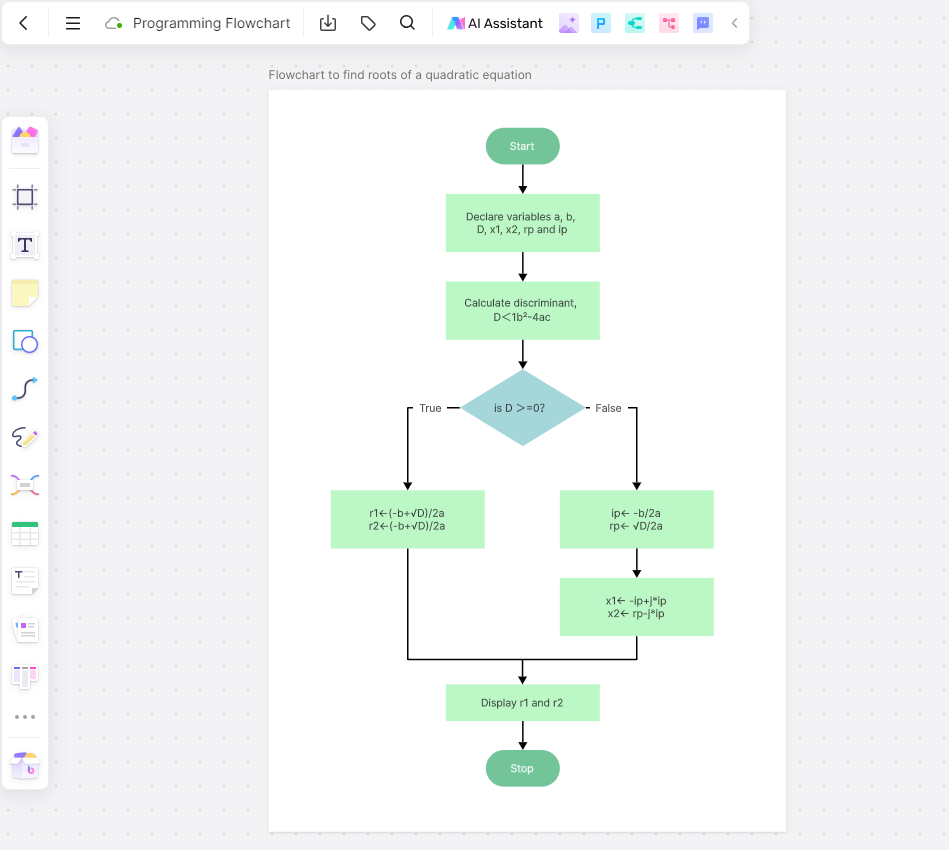
Data Diagram
This type of flowchart is often used in software development and design. For example, the web software program flowchart in the Boardmix community resources allows for the breakdown of each process, showing the relationship between structure components with the same symbol. This program flowchart can also be applied to business analysis, agile development, business process reengineering, system structure, and more.
Process Flowchart
A visual representation of all steps and decisions can help us break down the process into smaller steps and timely identify areas of low operational efficiency that can be improved. The microservices program flowchart in the Boardmix community templates helps us deeply understand the information flow and tasks related to the process, enabling us to make the right decisions at the right time.
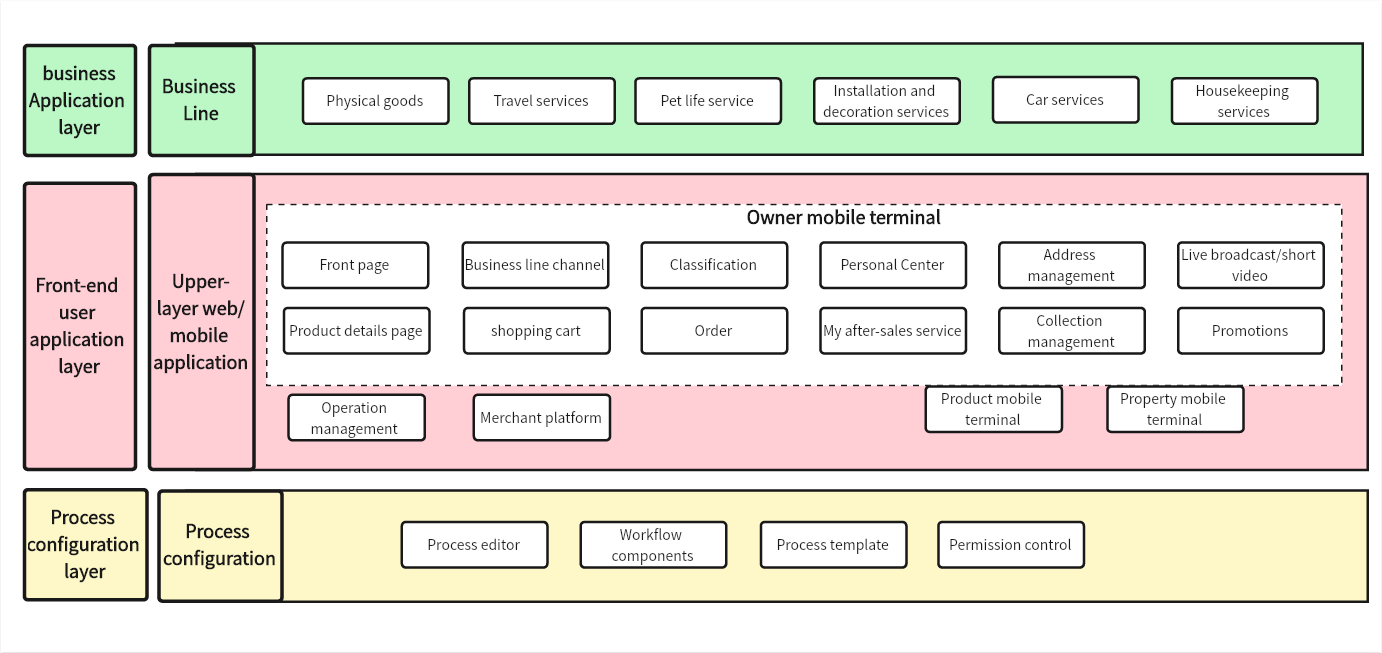
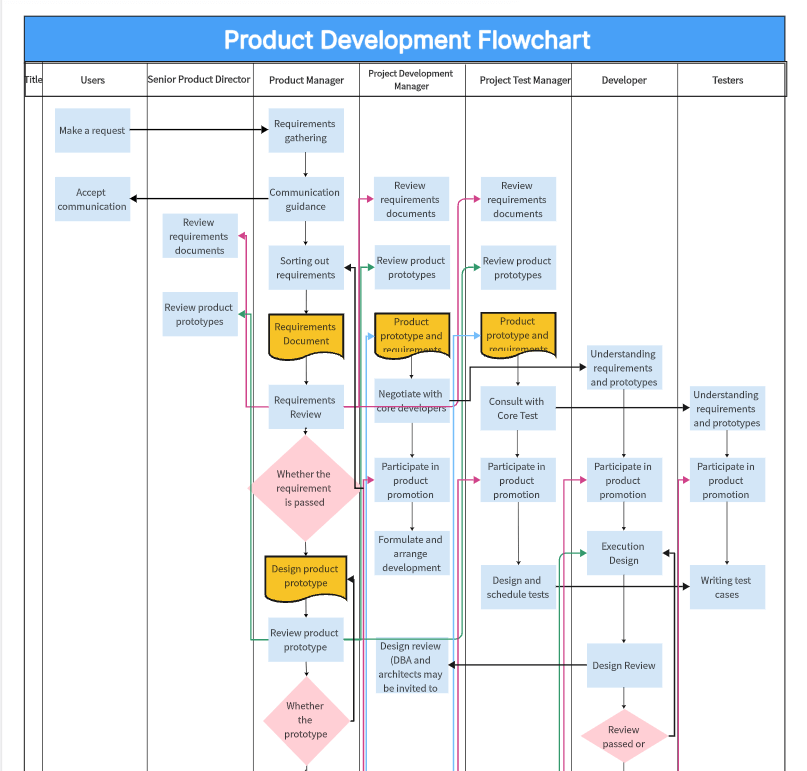
Swimlane Diagram
In this flowchart, each lane acts as a space for a business role or department. For example, the big data program flowchart in the Boardmix community templates can display specific parts of each process. Team members can more easily see what needs to be done at each stage, facilitating more efficient cross-departmental team collaboration.
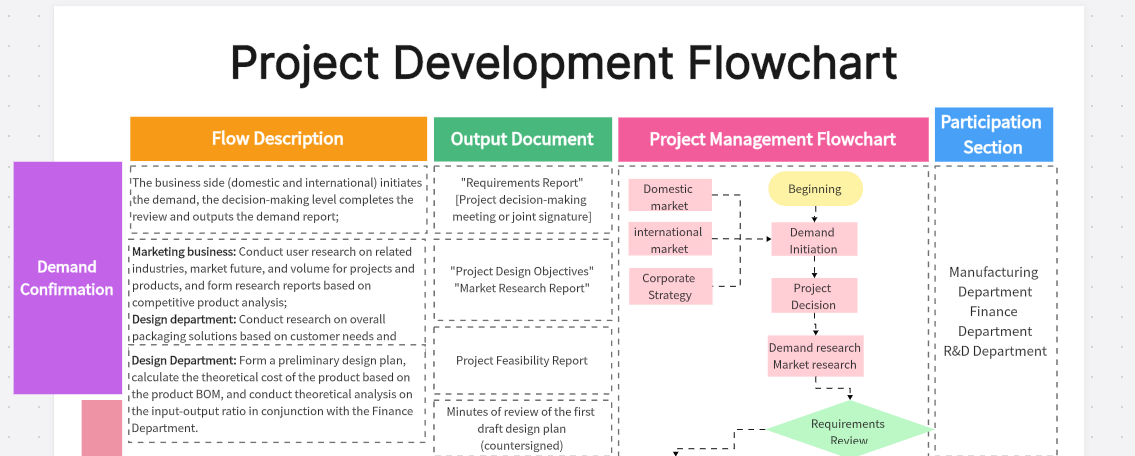
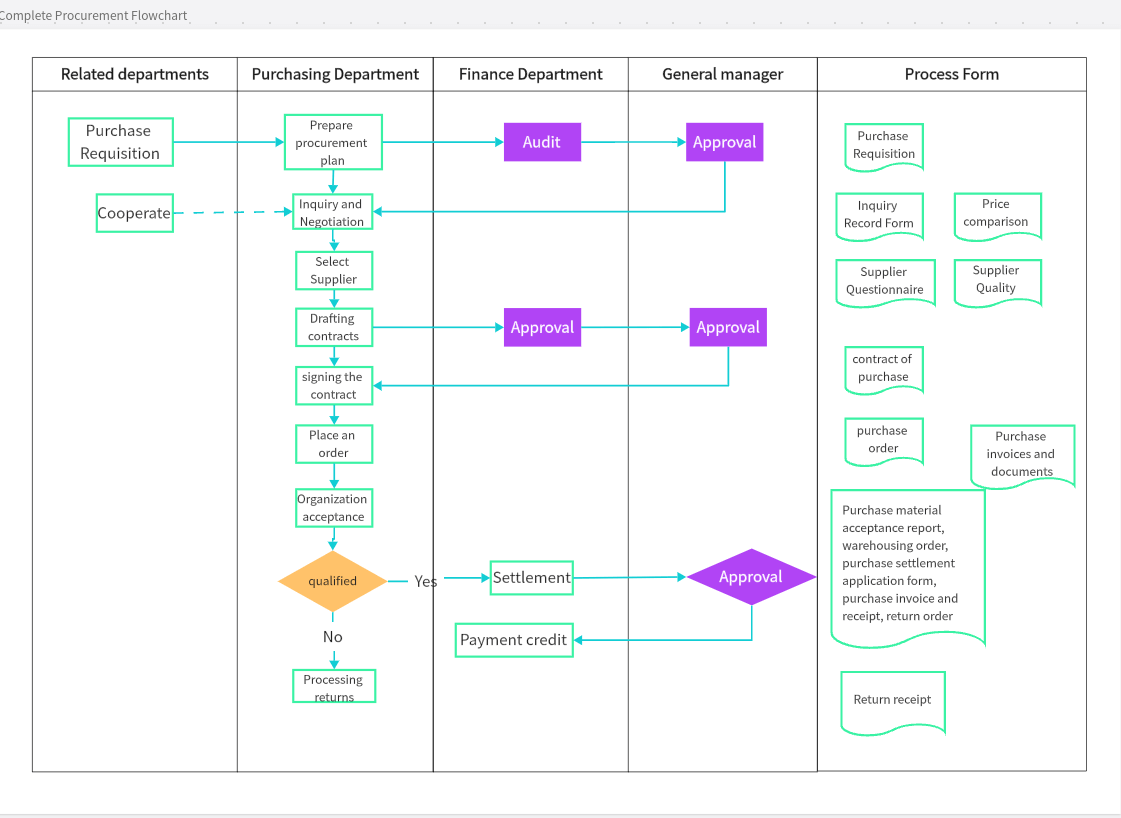
Procedure Diagram
This diagram follows the logical flow of information, involving the sequence of steps and decisions needed to make the process work. For example, the mini-program system program flowchart in the Boardmix community can help us organize and visualize the entire business process for effective team communication and collaboration, achieving business process goals and producing high-quality results.
How to Create a Program Flowchart with Boardmix?
Advantages of Drawing Program Flowcharts with Boardmix
-Each program flowchart template's framework is integrated within one operational space.
-Supports real-time collaboration among multiple people, allowing team members to view, edit, and comment.
-Supports viewing the history of mind map edits, real-time adjustment of ideas and creativity, and restoration to the original version if needed.
-Supports online exporting, allowing you to export the mind map to an image or file with high-resolution quality for easy local storage.
Boardmix has many categorized graphic symbols built-in that can be used for prototype diagrams, UML, BPMN, network topology diagrams, and more. Below are the steps to draw a program flowchart:
Step 1: Open Boardmix and create a whiteboard

Click on Boardmix to go to the webpage, and open the whiteboard creation feature to edit. All information is saved in real-time on the cloud, so there's no need to worry about losing file content.
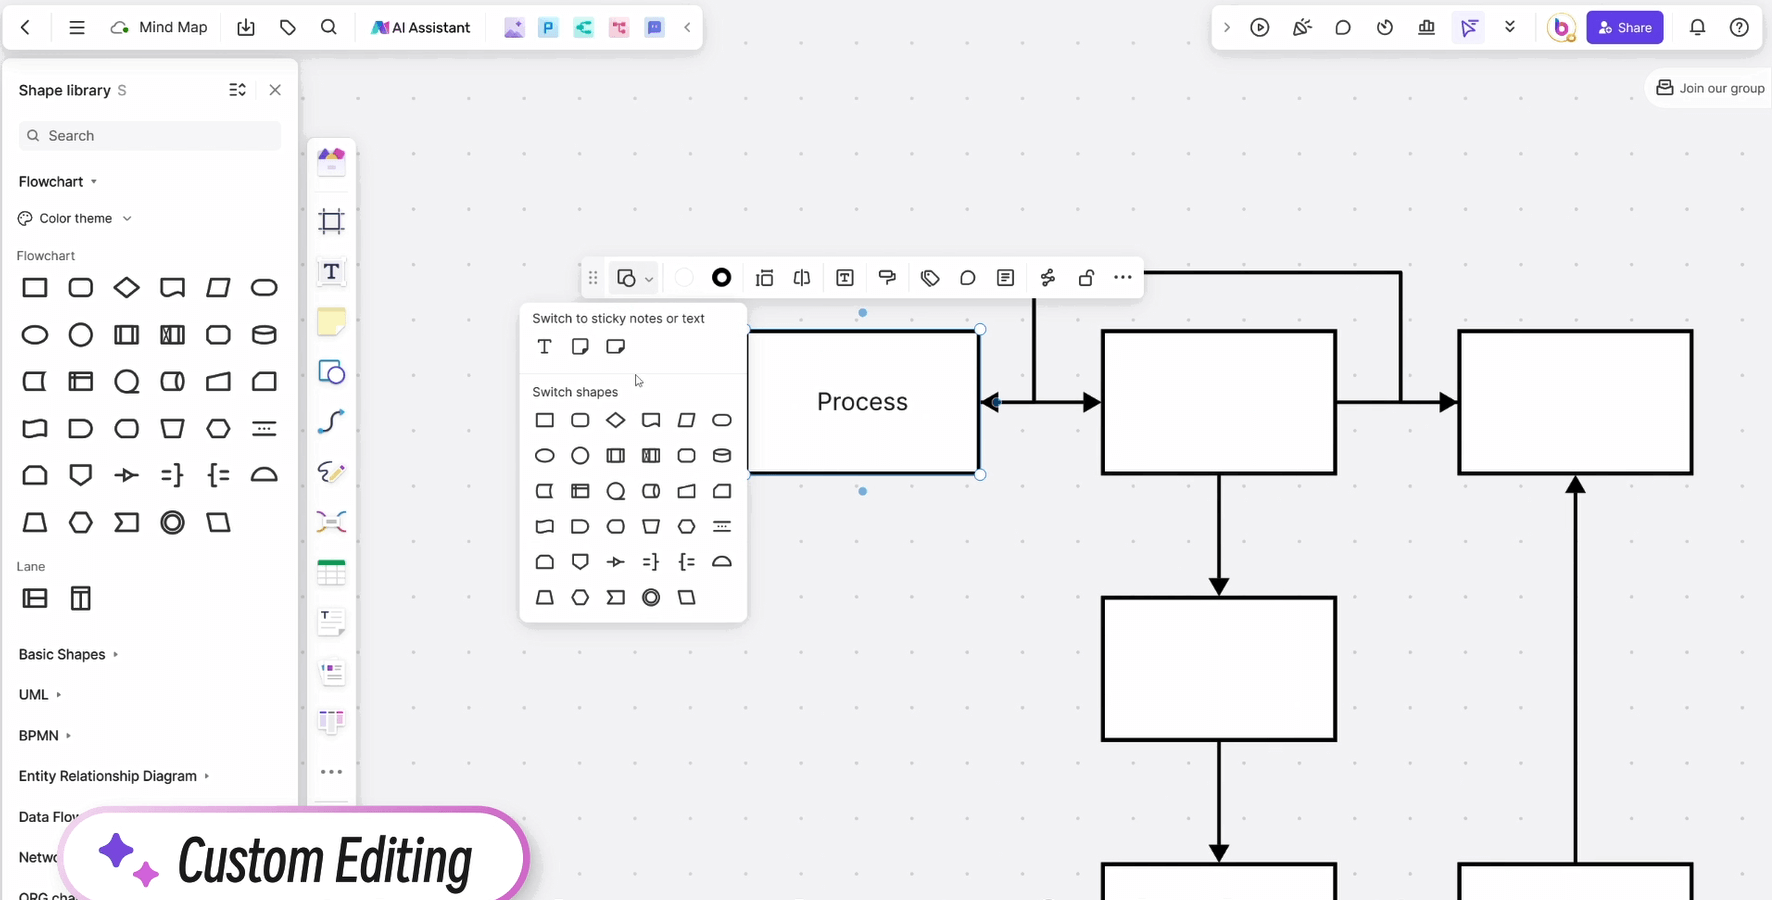
Step 2: Choose Graphic Styles
Enter the new whiteboard page and choose chart symbols from the tools for editing use. Drag them onto the new whiteboard page to build your program flowchart.
Step 3: Create a Program Flowchart
The program framework is built according to actual business conditions. Its model reference can refer to rich cases in the Boardmix whiteboard community.
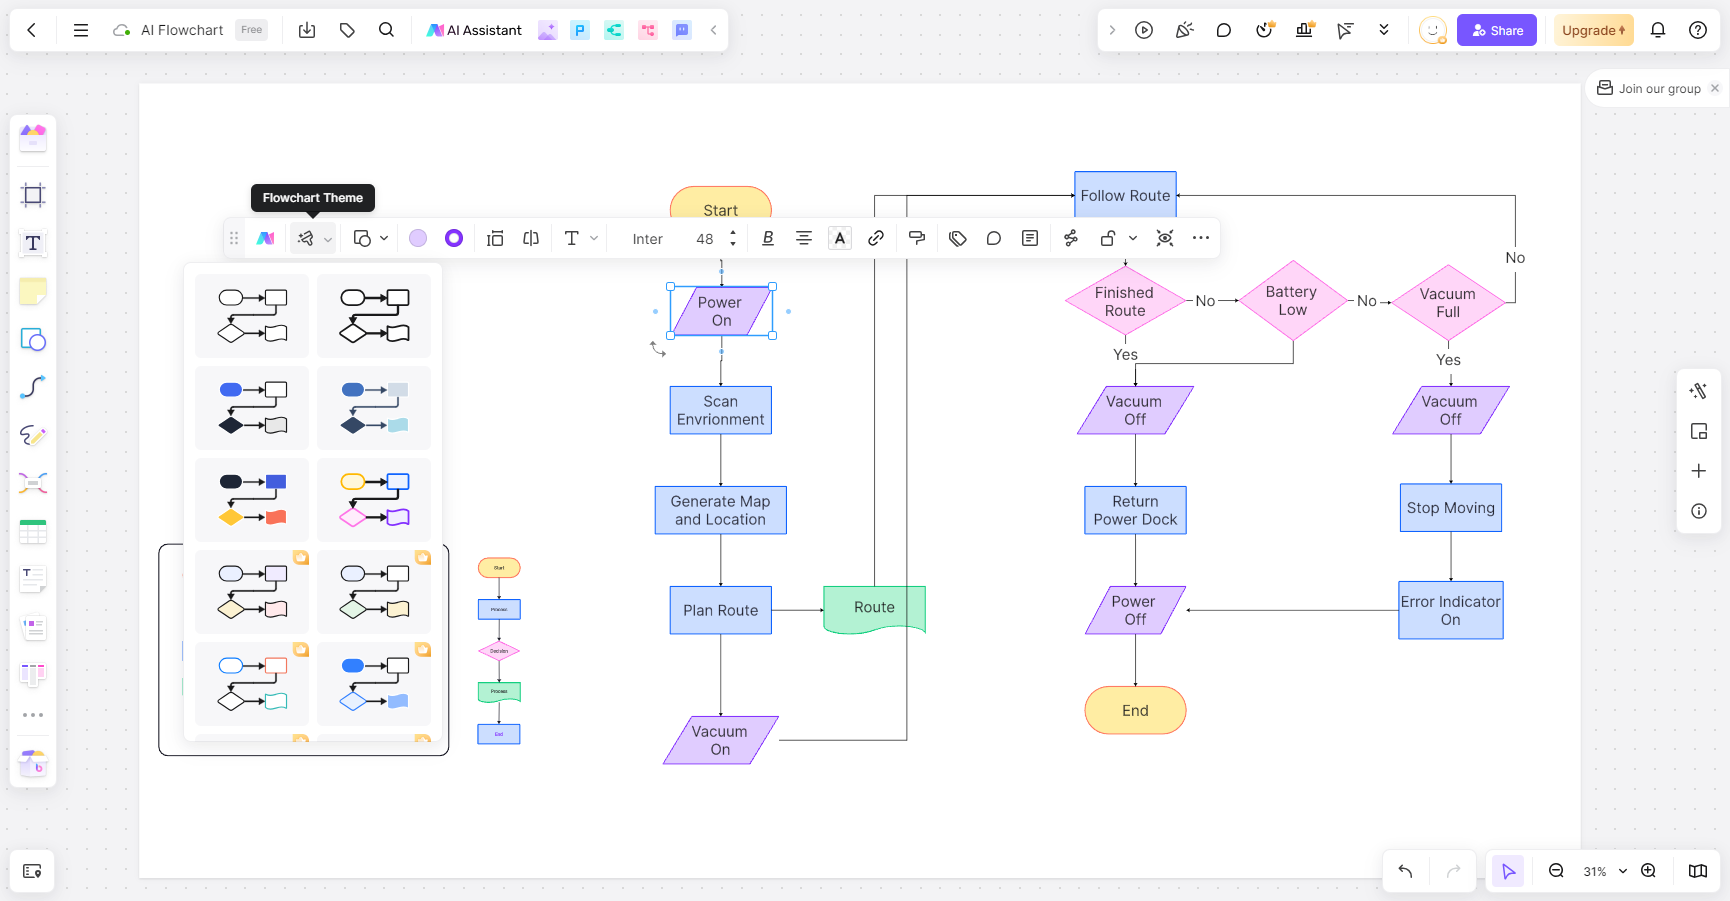
Once the framework is set up, we can continue to fill in content on Boardmix's whiteboard page. You can set font styles, font size operations, line shapes, adjust connections, text settings, color filling, etc., to complete the content drawing for the entire process.
We hope this article can help everyone become familiar with and find the program flowcharts suitable for their work. With Boardmix's powerful drawing functions, we can quickly and easily create various chart types to help us record inspiration and organize thoughts. Using the Boardmix tool can make our logic clearer, work more efficiently, and create easier. Currently, it's free to register; click on Boardmix to use it online!


