

Venn circles stand out as a powerful tool for showcasing relationships, intersections, and unions between different sets of data. This article delves deep into the concept of Venn circles, with a particular focus on 4-way Venn diagrams. We'll explore their construction, advantages, limitations, and practical applications across various fields. Additionally, we'll provide a step-by-step guide on creating effective Venn circles using Boardmix, a leading software in diagram design.
What Are Venn Circles?
Venn circles, commonly known as Venn diagrams, are graphical representations that use overlapping circles to illustrate the logical relationships between two or more sets. Each circle represents a set, and the overlapping areas indicate common elements shared between these sets. Venn circles are named after John Venn, who introduced this concept in the 1880s.
Importance of Venn Circles in Visual Representation
Venn circles play a crucial role in visual representation by simplifying complex data and highlighting relationships that might not be immediately obvious. They help in:
Identifying Commonalities: By visually representing the intersections between sets, Venn circles make it easy to spot common elements.
Highlighting Differences: The non-overlapping areas of Venn circles emphasize the unique elements of each set.
Simplifying Complexity: They provide a clear and concise way to present complex data, making it accessible and understandable.
What Distinguishes a 4-Way Venn Diagram?
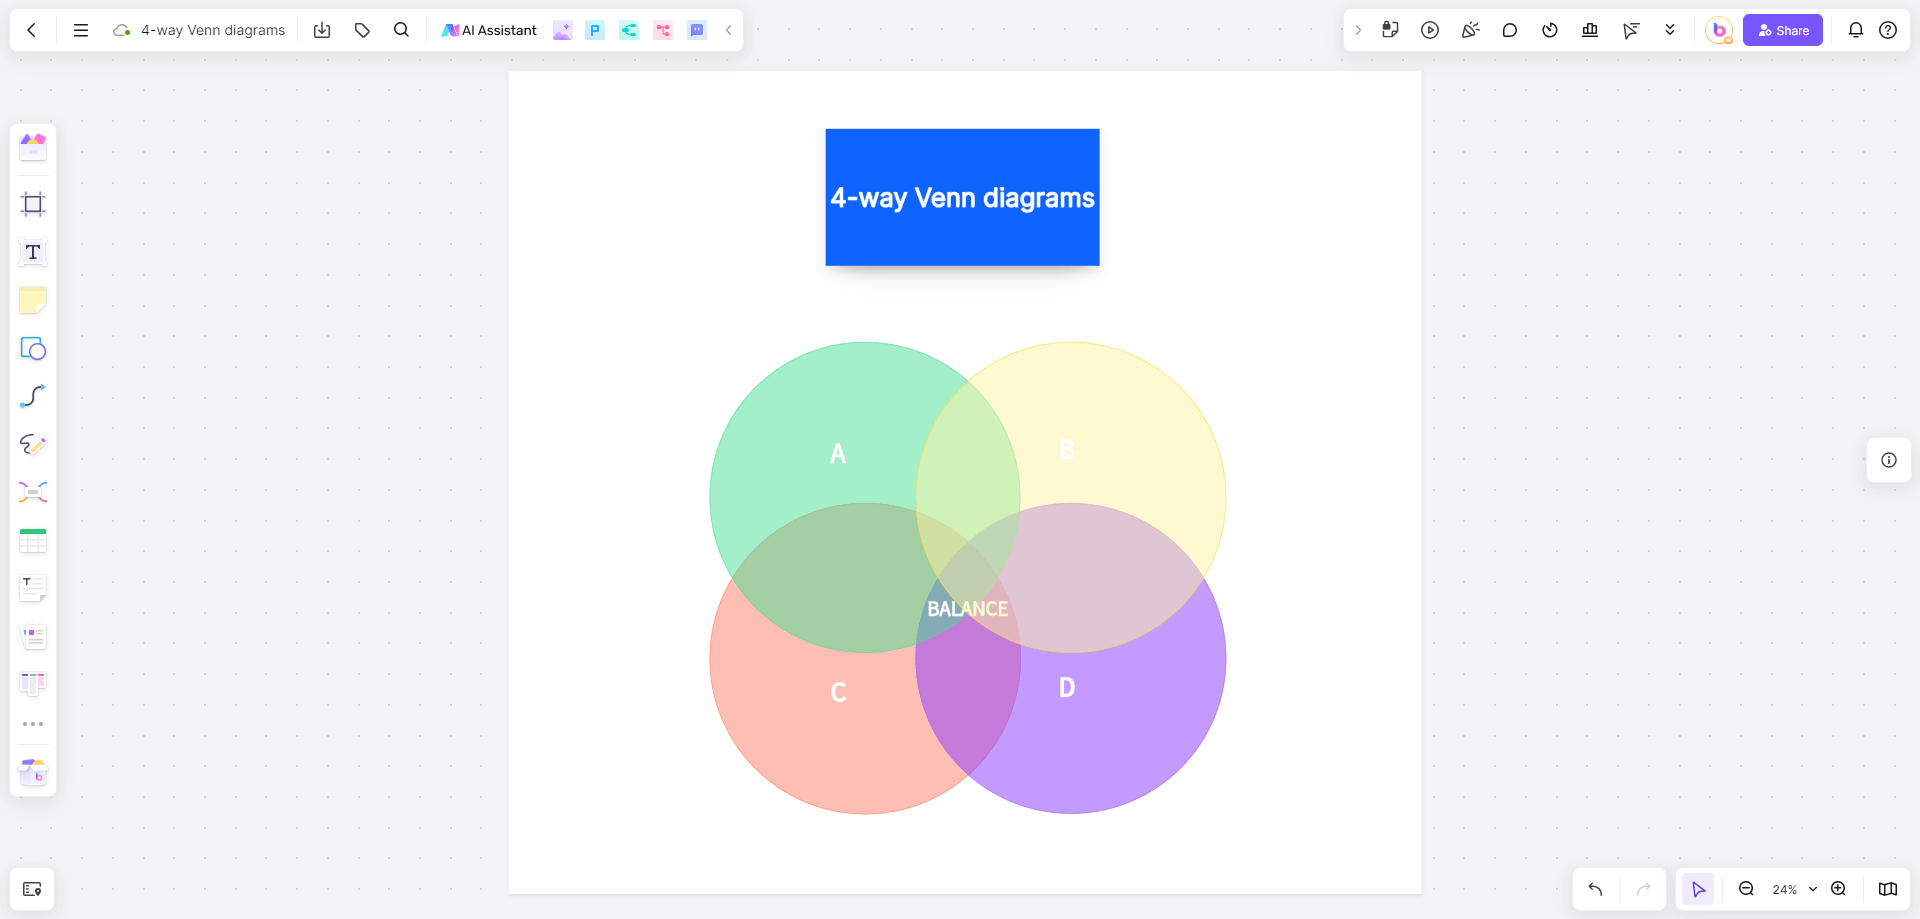
Unlike traditional Venn diagrams that usually involve two or three sets, a 4-way Venn diagram includes four sets, resulting in a more complex and detailed structure. Here are the key distinguishing features:
Complexity: A 4-part Venn diagram has 15 distinct regions, each representing a unique combination of the four sets. This complexity allows for a more nuanced analysis of the relationships between the sets.
Analytical Power: The ability to visualize all possible intersections makes 4-way Venn diagrams powerful tools for analyzing multifaceted data. They can highlight the presence or absence of specific characteristics within the combined sets.
Applications: These diagrams are commonly used in fields requiring detailed analysis of overlapping data sets, such as genetics, market research, and information science.
Advantages and Limitations of Venn Circles in Complex Data Visualization
Advantages:
Comprehensive Analysis: 4-way Venn diagrams enable the visualization of interactions between four different sets, offering a more complete analysis.
Detailed Insights: They provide detailed insights into the relationships and intersections among multiple sets.
Enhanced Clarity: Despite their complexity, 4-part Venn diagrams can enhance clarity by organizing large volumes of data visually.
Limitations:
Complexity: The increased number of intersections can make 4-way Venn diagrams difficult to interpret.
Space Constraints: They require more space to display effectively, which can be a limitation for smaller presentation formats.
Cognitive Load: The complexity may increase cognitive load, making it harder for viewers to quickly grasp the information.
Case Studies of Useful Venn Circles
Case Study 1: Market Research
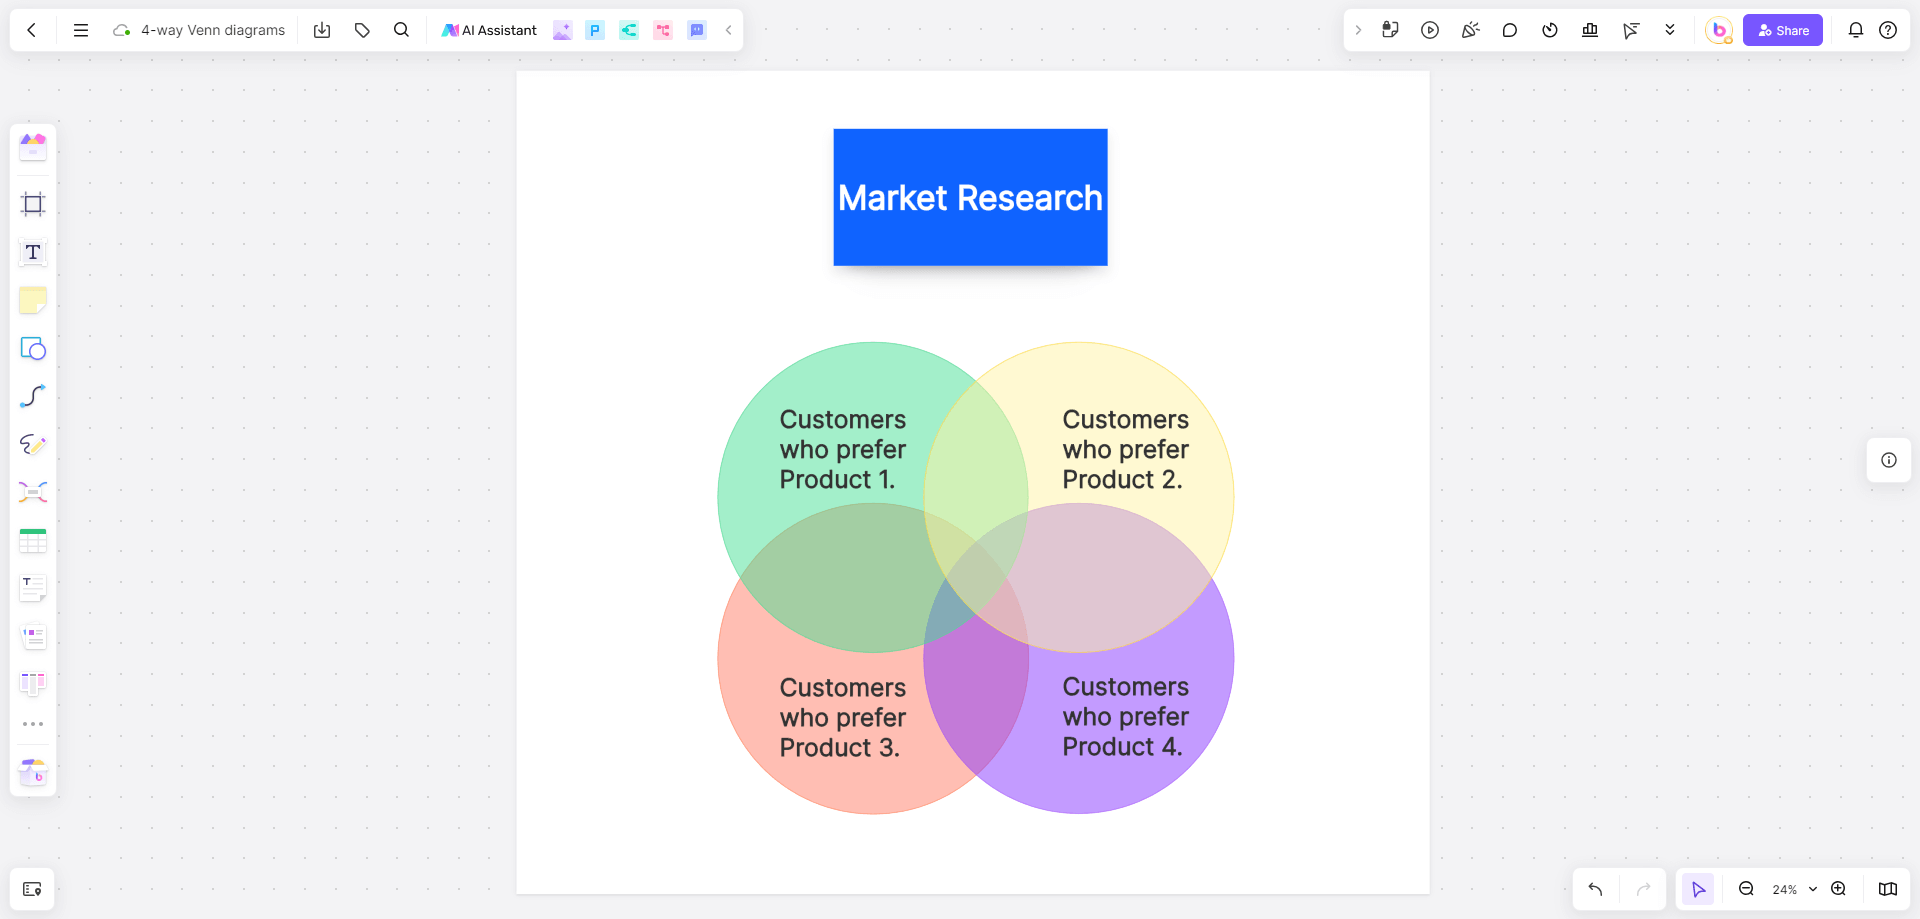
In market research, a 4-way Venn diagram can be used to compare customer preferences across four different products. By analyzing the intersections, researchers can identify overlapping customer bases and tailor marketing strategies accordingly.
Step-by-Step Creation Process:
Define the Sets:
Set A: Customers who prefer Product 1.
Set B: Customers who prefer Product 2.
Set C: Customers who prefer Product 3.
Set D: Customers who prefer Product 4.
Draw Four Overlapping Circles:
Arrange the circles so that each pair of circles overlaps, creating all possible intersections.
Label the Circles:
Label each circle with the corresponding product preference (e.g., A, B, C, D).
Populate the Intersections:
Collect data on customer preferences and populate each intersection with the number of customers who fall into that category. For example:
The intersection of A and B represents customers who prefer both Product 1 and Product 2.
The central intersection where all four circles overlap represents customers who prefer all four products.
Analyze the Data:
Examine the diagram to identify key insights, such as which product combinations are most popular and which products have unique customer bases.
Tailor Marketing Strategies:
Use the insights gained to develop targeted marketing strategies. For example, if a significant number of customers prefer both Product 1 and Product 2, consider bundling these products in promotions.
Case Study 2: Academic Research
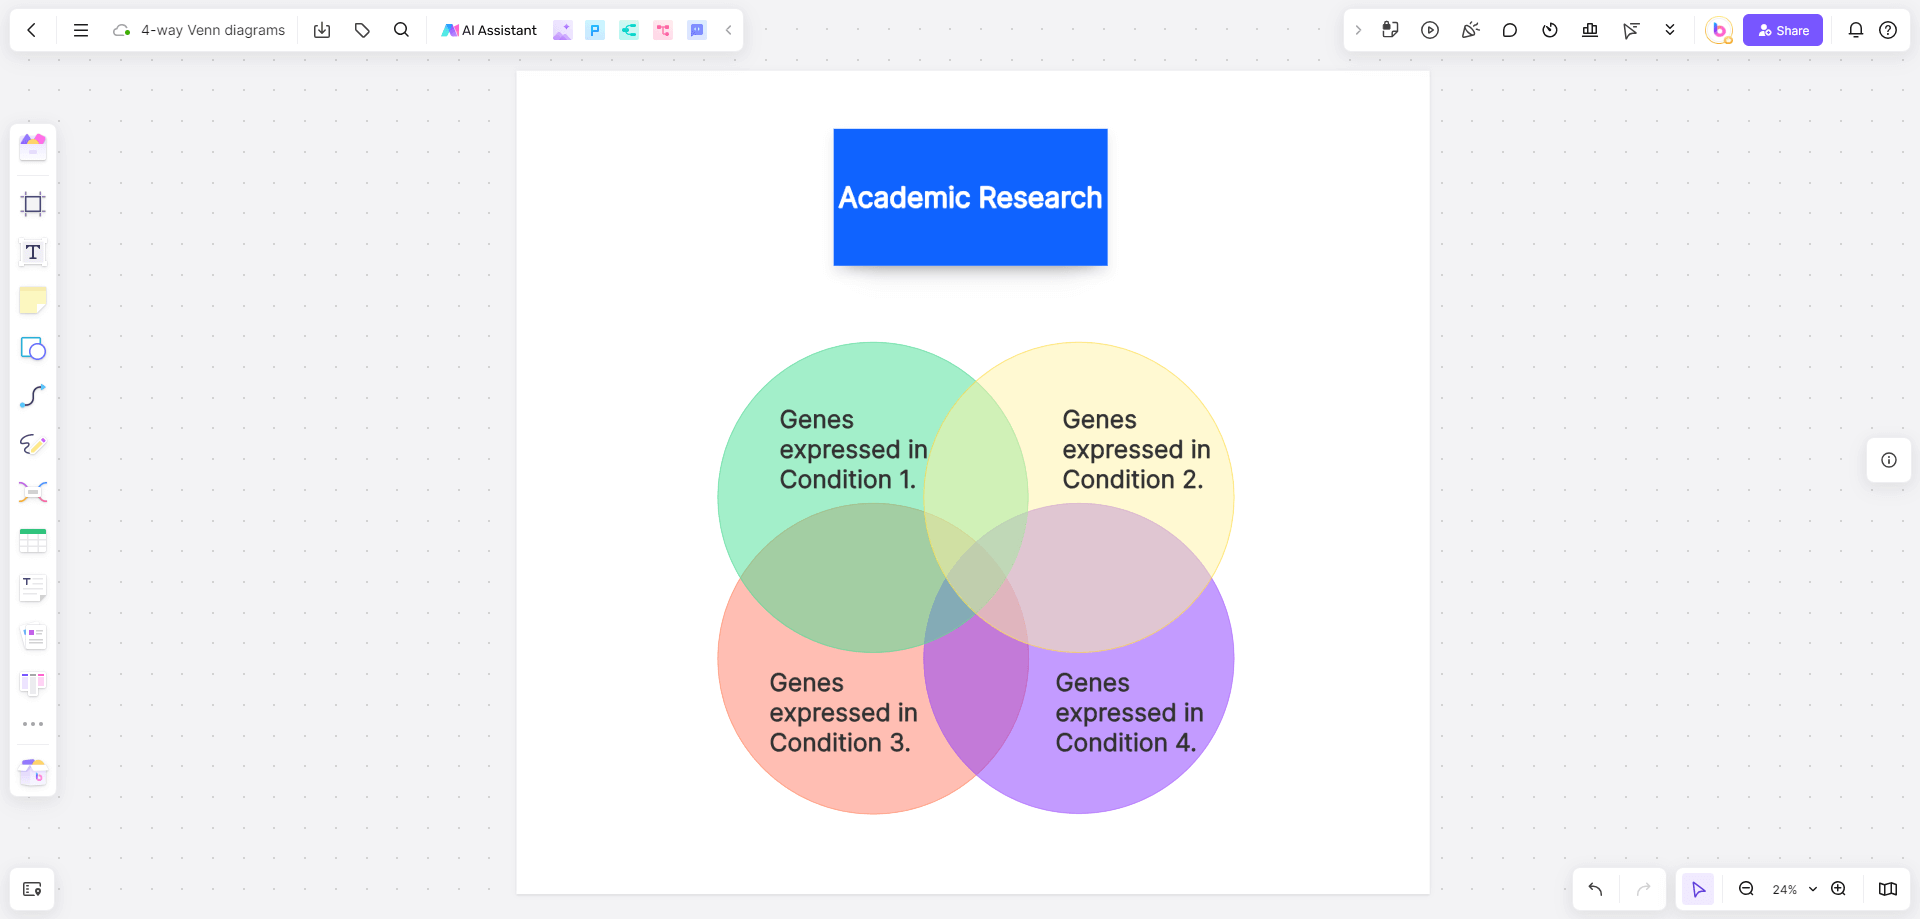
In academic research, particularly in biology, 4-part Venn diagrams help in comparing gene expression across four different conditions or species. This enables researchers to identify common and unique genetic markers.
Step-by-Step Creation Process:
Define the Sets:
Set A: Genes expressed in Condition 1.
Set B: Genes expressed in Condition 2.
Set C: Genes expressed in Condition 3.
Set D: Genes expressed in Condition 4.
Draw Four Overlapping Circles:
Arrange the circles so that each pair of circles overlaps, creating all possible intersections.
Label the Circles:
Label each circle with the corresponding condition (e.g., A, B, C, D).
Populate the Intersections:
Collect data on gene expression and populate each intersection with the number of genes expressed under the respective conditions. For example:
The intersection of A and B represents genes expressed in both Condition 1 and Condition 2.
The central intersection where all four circles overlap represents genes expressed in all four conditions.
Analyze the Data:
Examine the diagram to identify key insights, such as which genes are commonly expressed across multiple conditions and which are unique to specific conditions.
Identify Genetic Markers:
Use the insights gained to identify common and unique genetic markers. For example, genes expressed in multiple conditions may indicate fundamental biological processes, while unique genes may provide clues about specific responses to each condition.
How to Create Effective Venn Circles
5 Best Software for Designing Venn Diagrams
Several tools and software are available for designing Venn diagrams, including:
1. Boardmix
User-Friendly Interface: Simple drag-and-drop functionality.
Rich Templates: A variety of pre-designed templates.
Real-Time Collaboration: Multiple users can edit simultaneously.
Customization: Extensive options for shapes, colors, and fonts.
Export Options: Export in formats like PNG, PDF, and SVG.
Advantages for making effective venn circles:
Ease of Use: Simplifies the creation of complex diagrams.
Collaborative Work: Ideal for team projects with real-time feedback.
Ready Templates: Saves time with Venn-specific templates.
2. Lucidchart
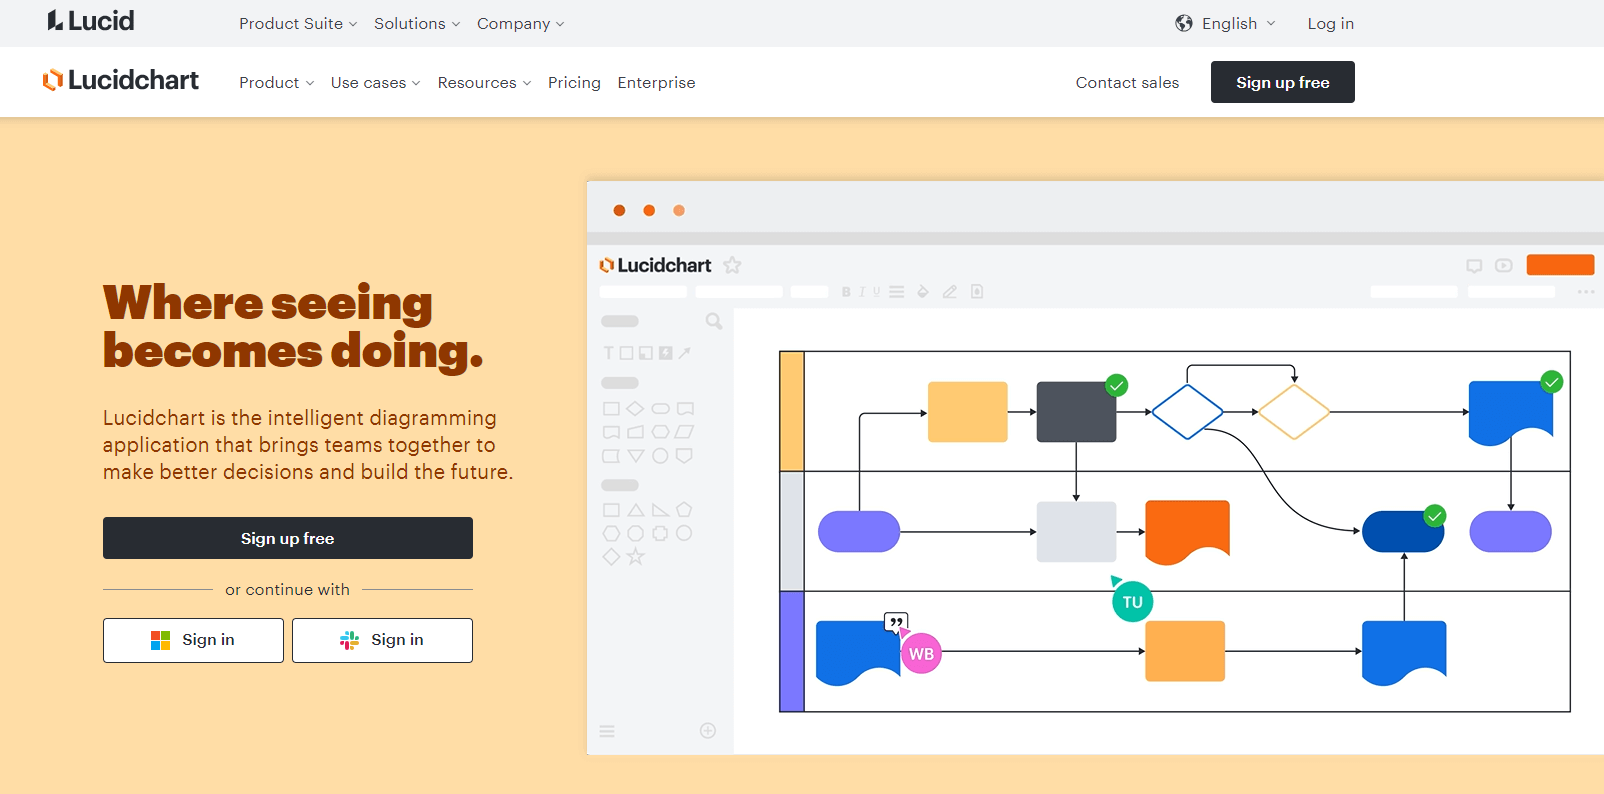
Intuitive Interface: Easy to use with a minimal learning curve.
Template Library: Extensive collection of templates and shapes.
Integrations: Works with Google Drive, Microsoft Office, and Slack.
Collaboration: Real-time editing with version control and comments.
Data Linking: Connects diagrams to data for dynamic updates.
Advantages for making effective venn circles:
User-Friendly: Streamlines the creation and customization process.
Extensive Templates: Reduces setup time with ready-to-use options.
Seamless Integration: Fits well into existing workflows.
3. Microsoft Visio
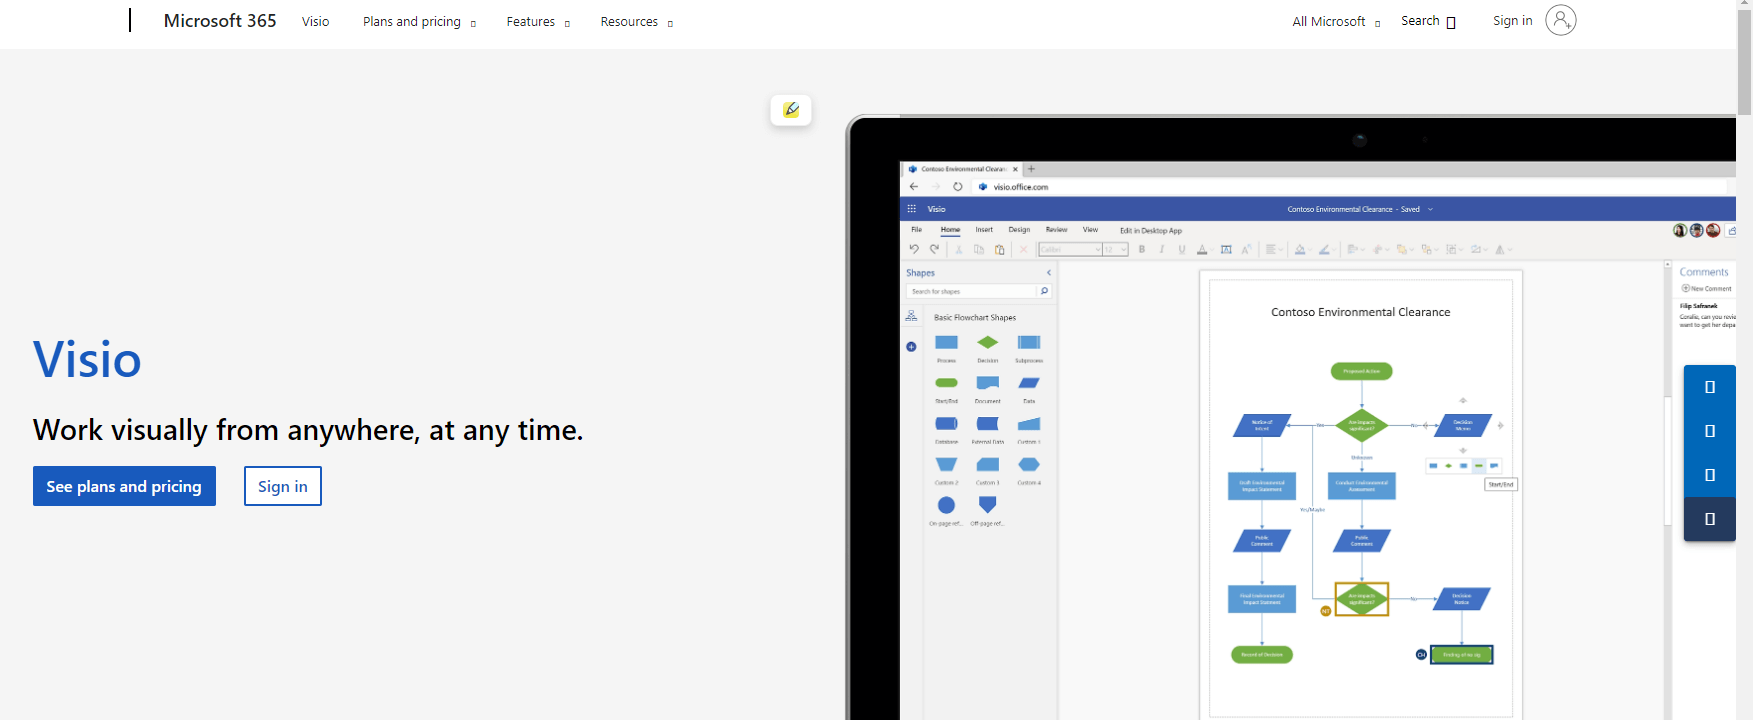
Professional Diagrams: Capabilities for detailed and complex diagrams.
Integration: Works seamlessly with Microsoft Office applications.
Templates and Shapes: Wide range of pre-designed templates.
Data Visualization: Links diagrams to data sources for dynamic visuals.
Customization: High degree of shape and formatting options.
Advantages for making effective venn circles:
Professional Quality: Ideal for detailed, high-quality Venn diagrams.
Advanced Features: Excellent for data visualization and integration.
Office Ecosystem: Enhances productivity within the Microsoft suite.
4. Creately

Collaboration: Real-time team editing and input.
Templates and Examples: Rich library for quick starts.
Ease of Use: Drag-and-drop interface.
Integration: Works with Google Drive, Confluence, and JIRA.
Versatility: Supports various diagram types.
Advantages for making effective venn circles:
Team Collaboration: Facilitates group work and brainstorming.
Template Library: Quick and easy start with ready templates.
Productivity Integration: Enhances workflow with other tools.
5. SmartDraw
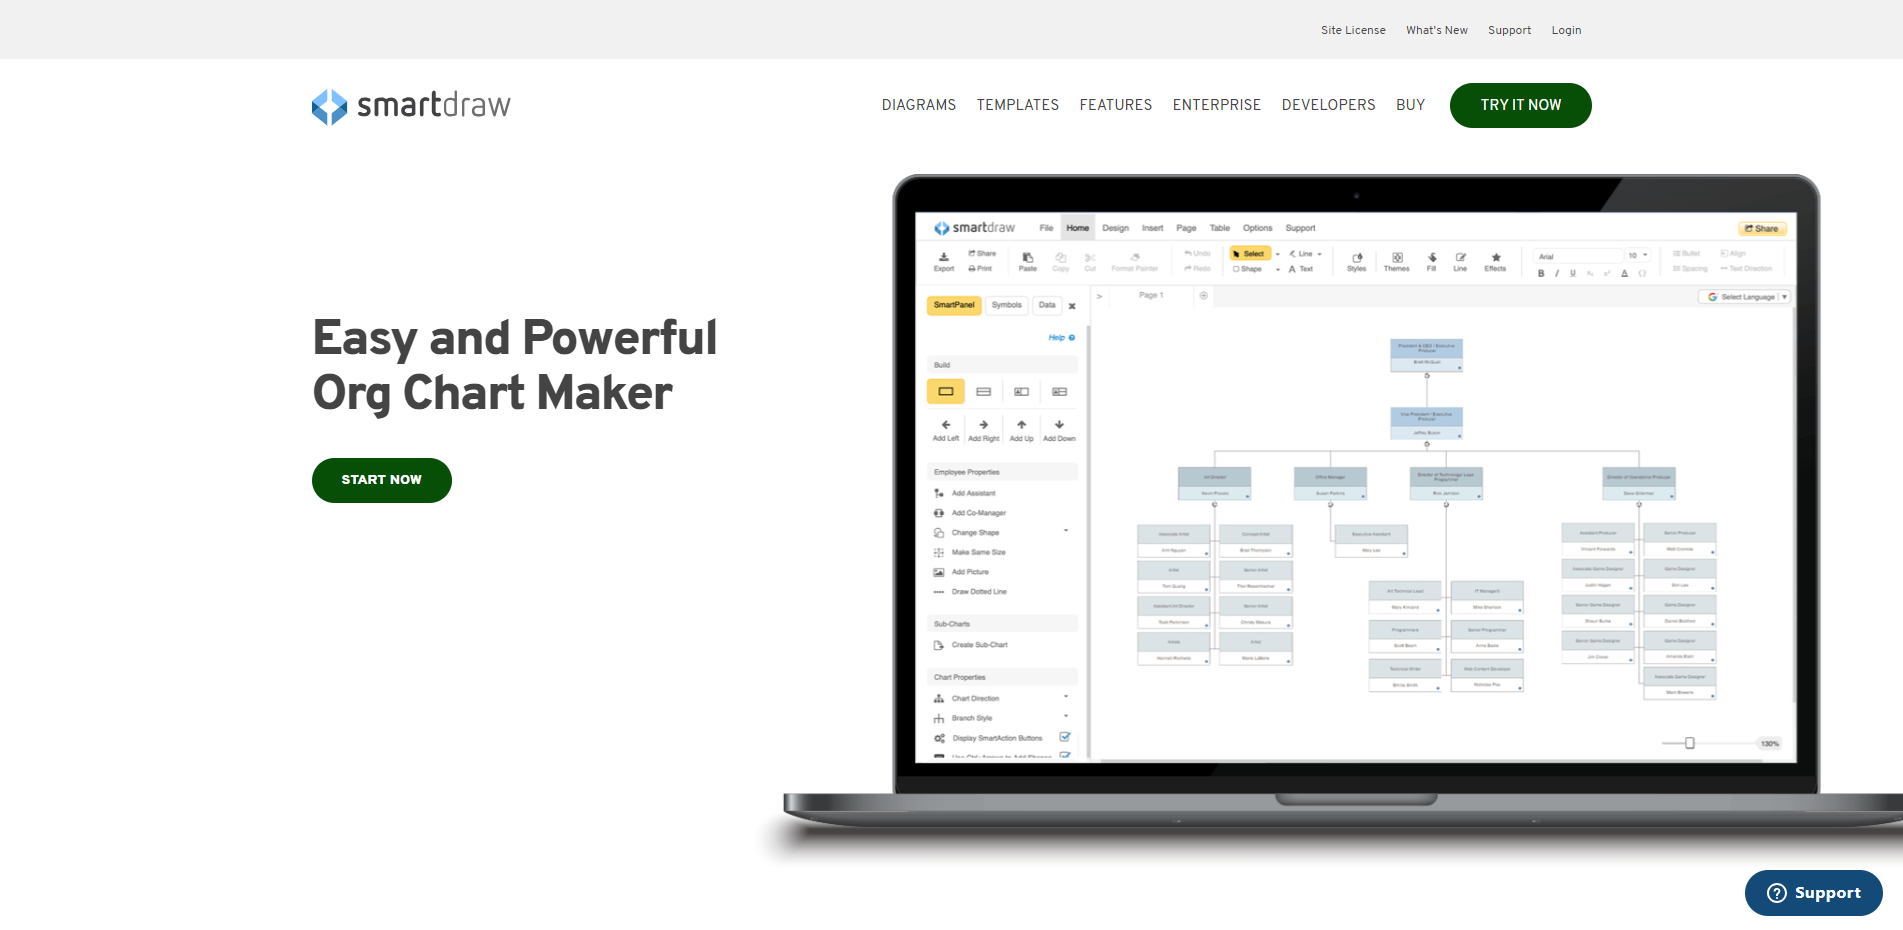
Automated Diagramming: Speeds up the creation process.
Templates and Symbols: Extensive library for various diagrams.
Integration: Compatible with Microsoft Office and Google Workspace.
Customization: Robust options for diagram customization.
Collaboration: Supports sharing, comments, and feedback.
Advantages for making effective venn circles:
Automation: Saves time with automated features.
Comprehensive Templates: Quick setup with pre-designed options.
Ease of Use: User-friendly interface for detailed Venn diagrams.
Step-by-Step Guide to Constructing Venn Circles with Boardmix
Boardmix is a powerful tool that simplifies the process of creating Venn diagrams. Here’s a step-by-step guide to constructing Venn circles with Boardmix:
Step 1: Sign Up and Log In

Register for an account on Boardmix and log in to access the dashboard.
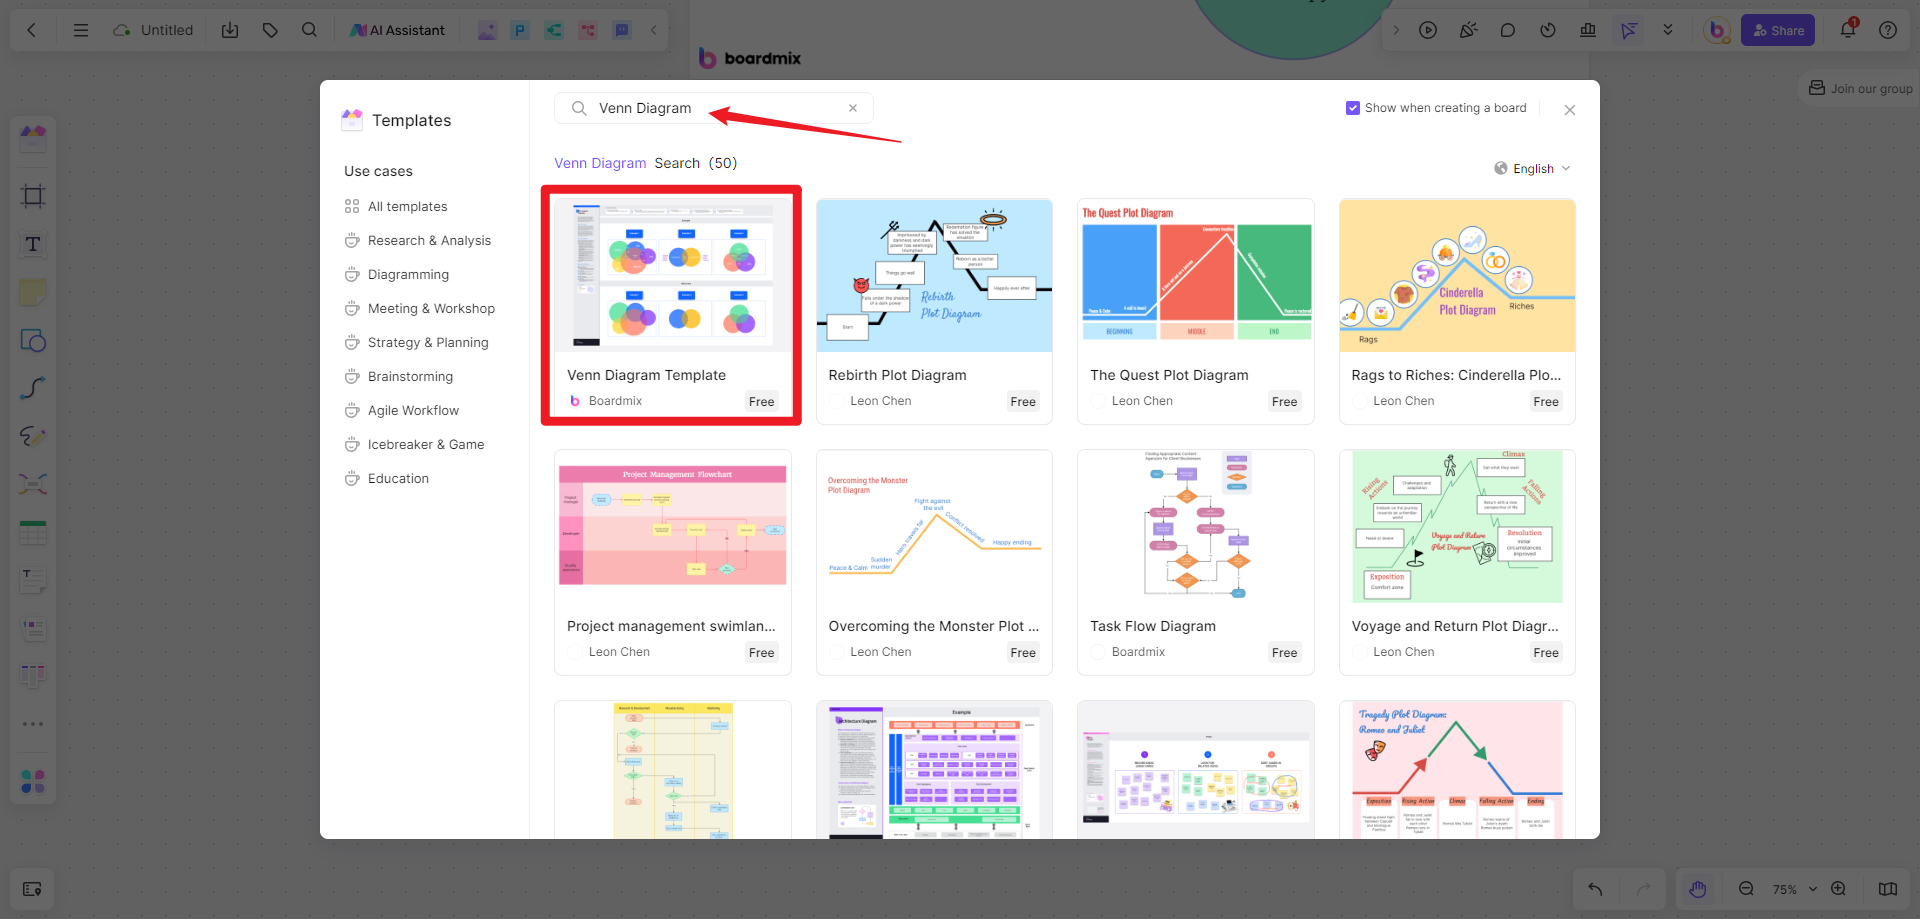
Step 2: Choose a Template
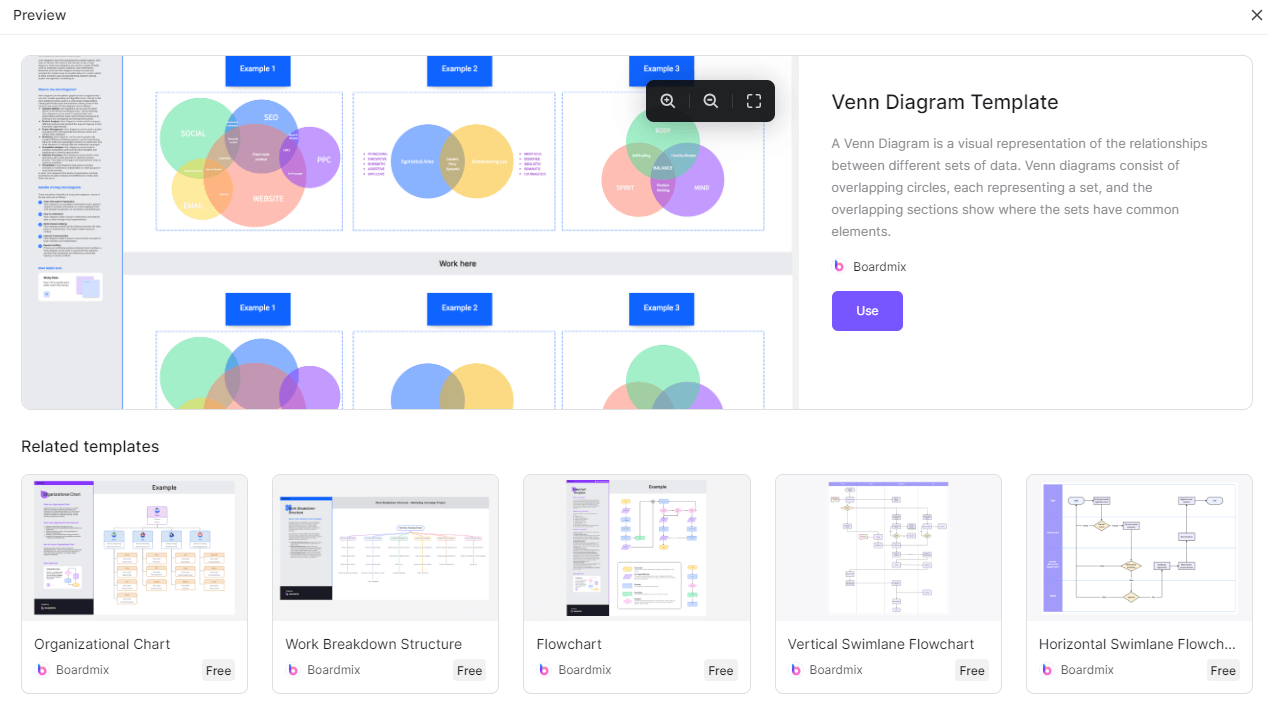
Select a Venn diagram template from the template library. Boardmix offers a variety of pre-designed templates to get you started.
Step 3: Customize Your Diagram
You can also use the various customization tools provided by Boardmix to make Venn Circles.
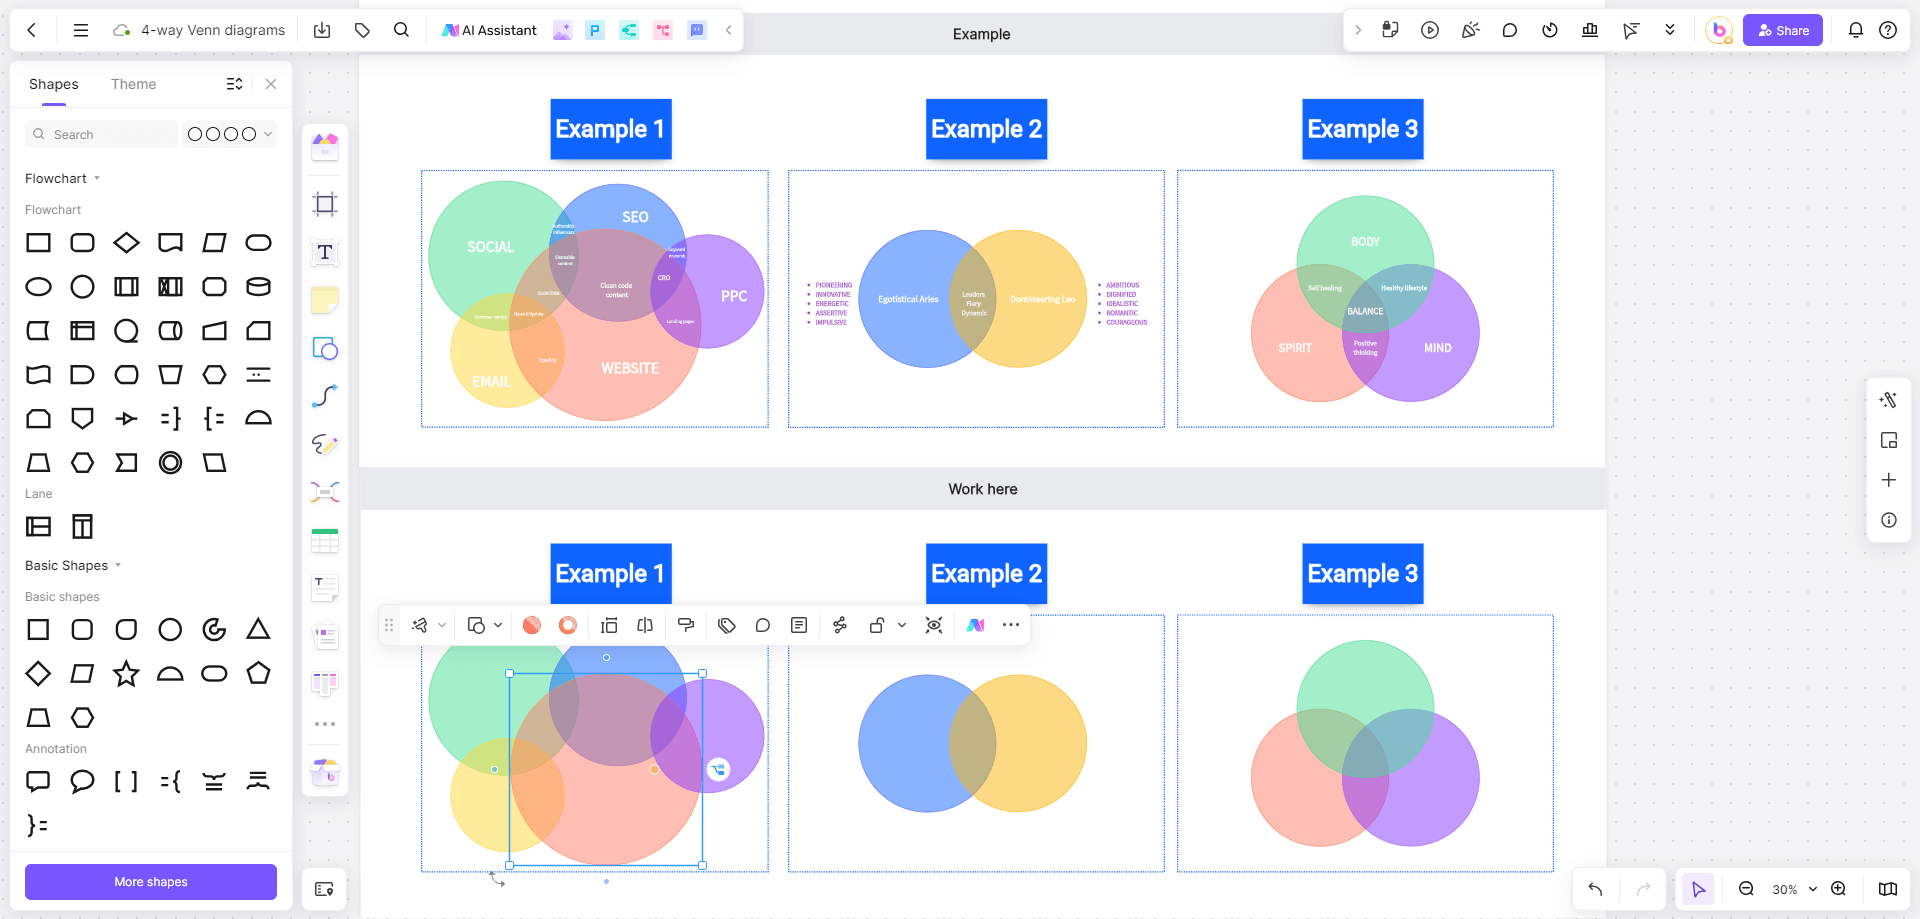
Add Circles: Drag and drop circles onto the canvas. For a 4-part Venn diagram, you’ll need four overlapping circles.
Label Sets: Label each circle to represent different sets.
Adjust Overlaps: Position the circles to ensure all possible intersections are visible.
Step 4: Input Data
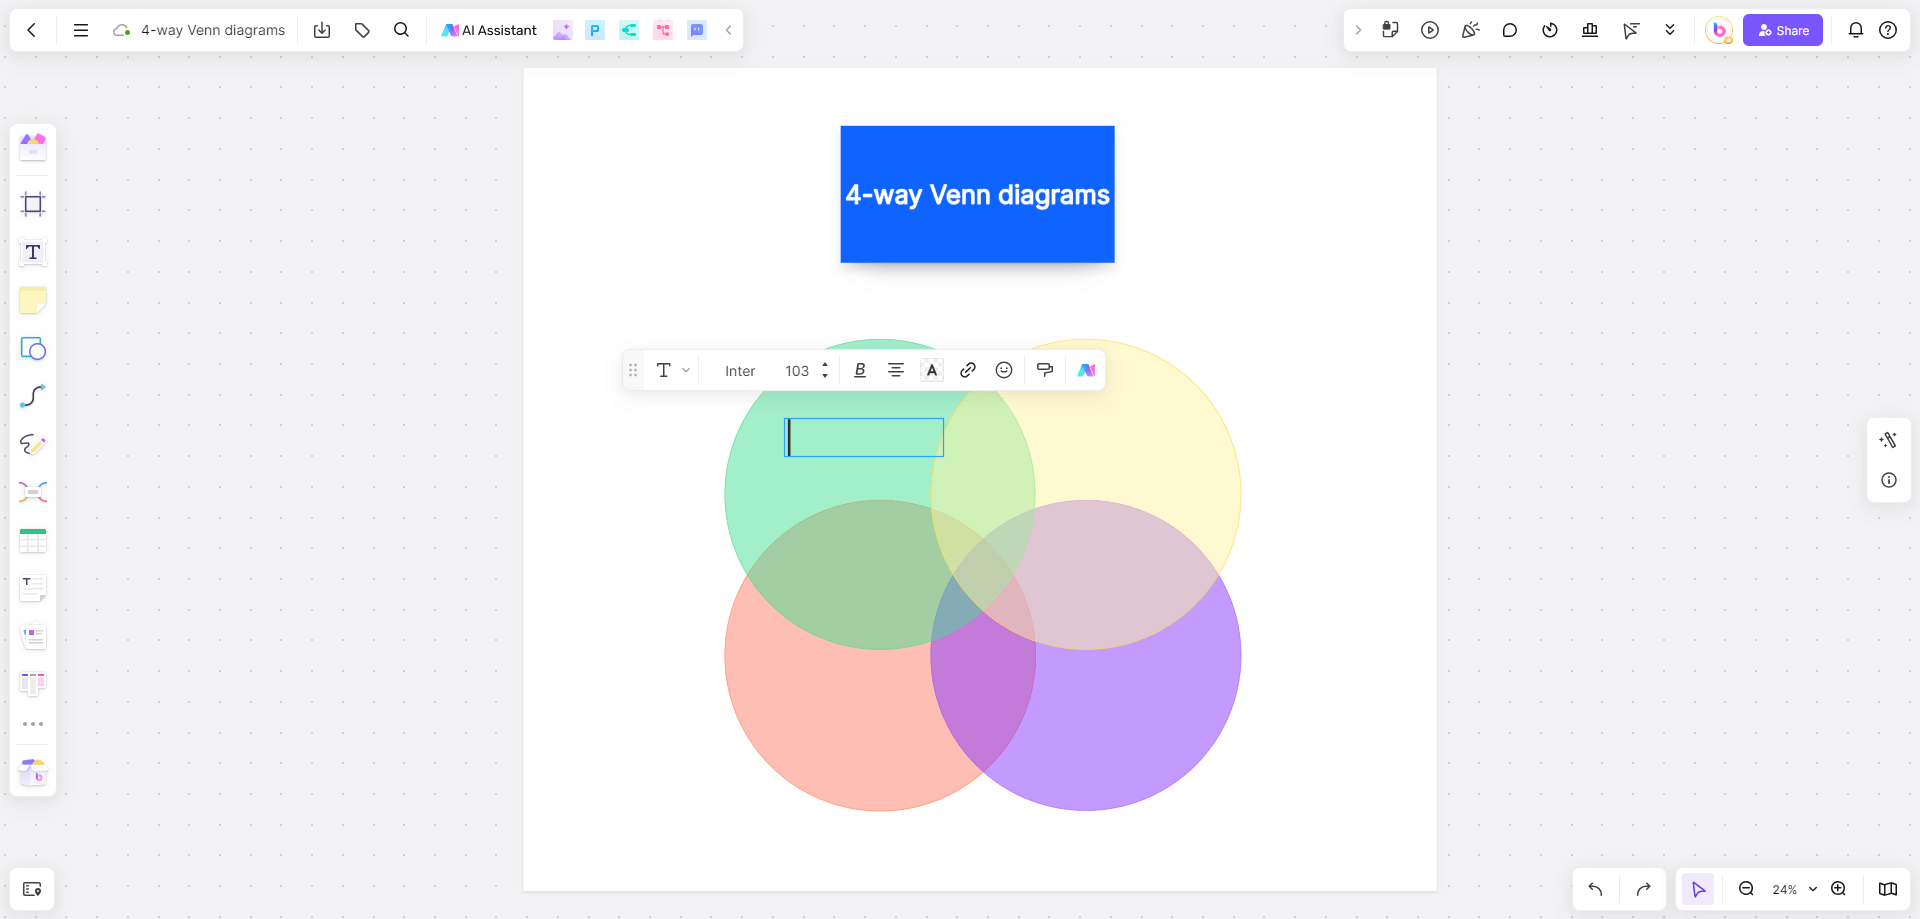
Enter the data for each set and intersection. Boardmix allows you to input detailed information for each section of the Venn diagram.
Step 5: Style Your Diagram
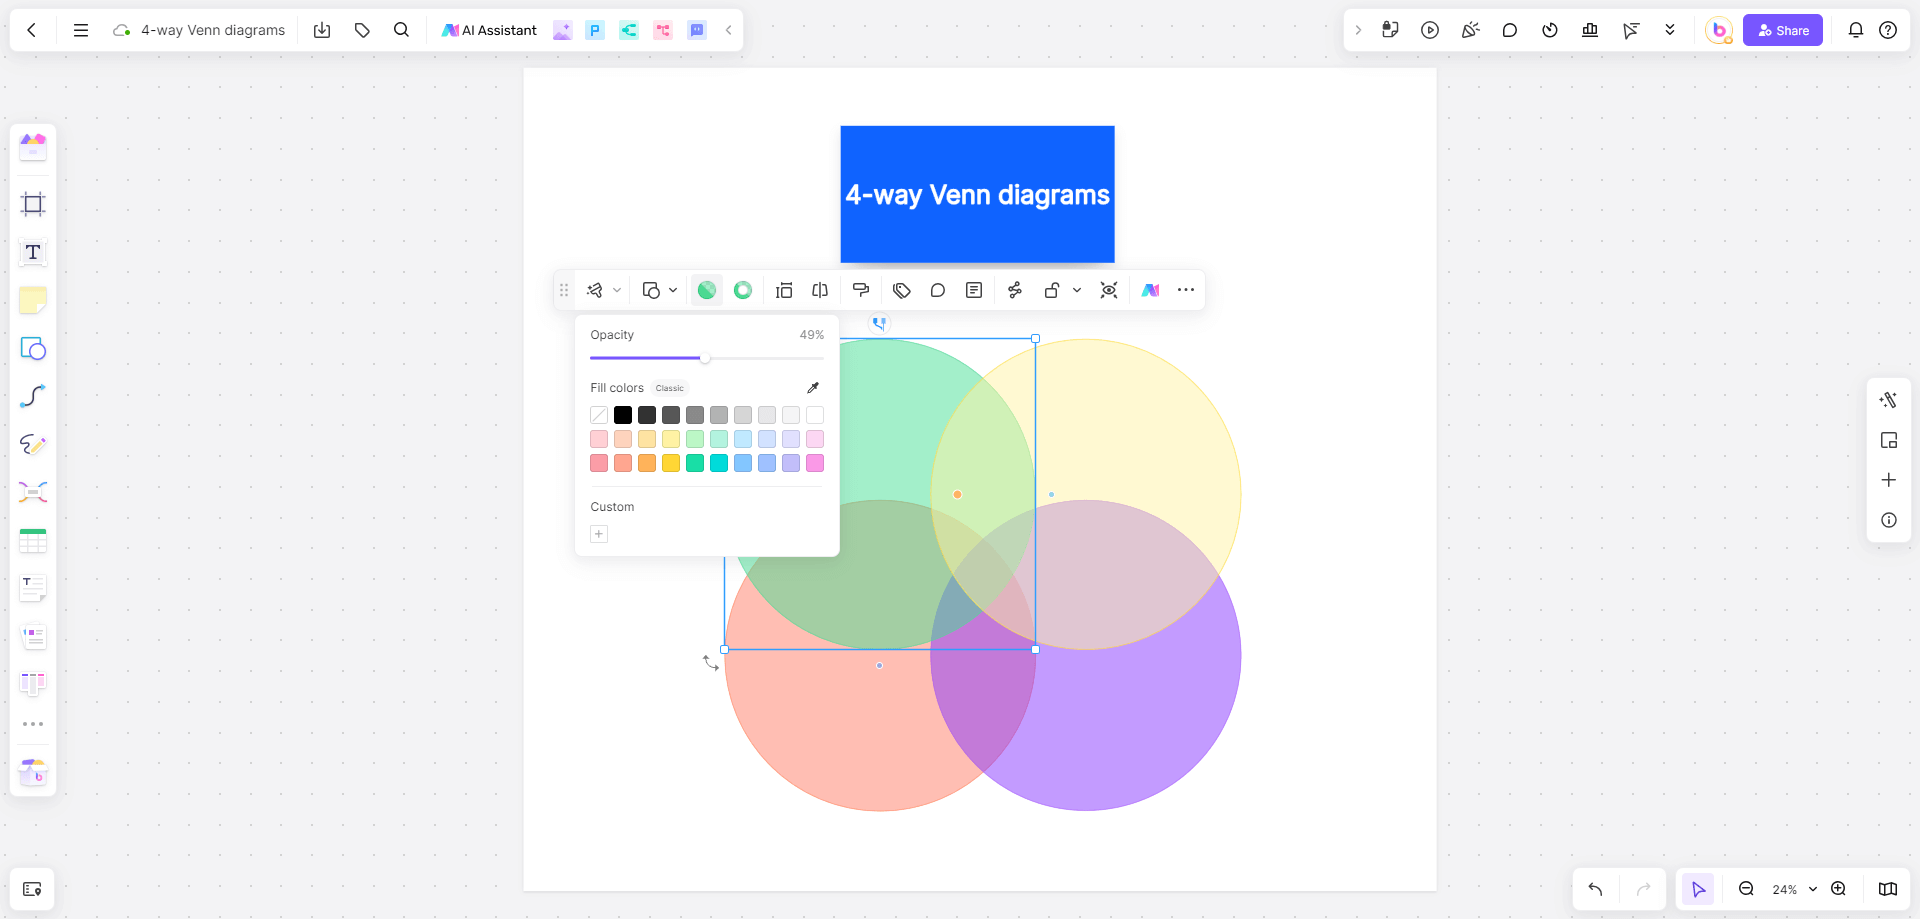
Customize the appearance of your Venn diagram by changing colors, fonts, and styles to make it visually appealing.
Step 6: Save and Export
Save your Venn diagram and export it in your preferred format (e.g., PNG, PDF) for easy sharing and presentation.
How Are Venn Circles Used in Different Fields?
Venn circles are used across various fields to simplify complex data and highlight relationships. Here are some examples:
Education
In education, Venn diagrams are used to teach students about set theory and logical relationships. They help in visualizing concepts such as unions, intersections, and complements.
Business
Businesses use Venn diagrams for market analysis, competitive analysis, and strategic planning. They help in identifying common customer segments, overlapping market opportunities, and unique selling points.
Science and Research
Scientists and researchers use Venn diagrams to compare experimental data, analyze genetic information, and study ecological relationships. They are particularly useful in fields like biology, chemistry, and environmental science.
Healthcare
In healthcare, Venn diagrams are used to compare patient groups, study disease overlaps, and analyze treatment outcomes. They assist in identifying common factors among different patient populations.
Technology
Tech companies use Venn diagrams for product development, feature comparison, and software architecture planning. They help in visualizing the relationships between different components and functionalities.
Conclusion
Venn circles, especially 4-part Venn diagrams, are invaluable tools for visualizing complex data and uncovering intricate relationships. While traditional Venn diagrams are simpler, 4-way Venn diagrams offer a more comprehensive analysis, albeit with increased complexity. By leveraging tools like Boardmix, creating effective and visually appealing Venn diagrams becomes a straightforward process.
Whether in education, business, science, healthcare, or technology, Venn circles play a crucial role in simplifying data and enhancing clarity. As data continues to grow in volume and complexity, the importance of effective data visualization tools like Venn diagrams cannot be overstated.


