


Data visualization, a linchpin in deciphering intricate information, finds its quintessence in bar graphs. Renowned for their simplicity and effectiveness, these visual representations distill complexity into clear narratives.Navigating the simplicity of vertical or horizontal bars, we focus on these popular tools, offering a concise guide for both seasoned analysts and novices.This article delves into the world of bar graphs, elucidating the art of crafting them using Google Sheets and Boardmix.
What Is a Bar Graph
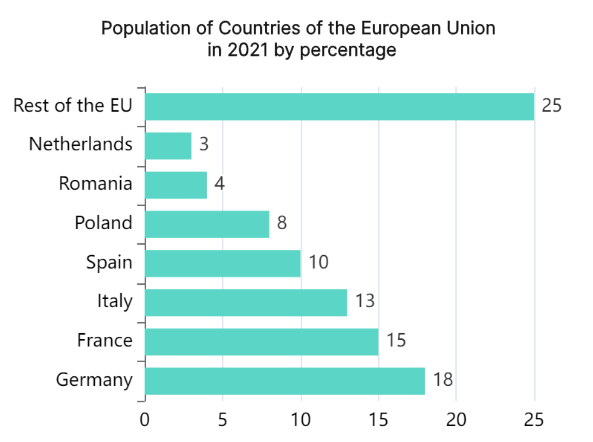
A bar graph serves as a graphical representation of data, where each bar signifies distinct categories, and the length of the bars corresponds to the quantities they represent. This visual tool is widely lauded for its inherent simplicity and clarity, making it accessible to a broad spectrum of users, from data enthusiasts to casual observers.
The brilliance of bar graphs lies in their intuitive nature. The visual depiction of data relationships through easily distinguishable bars allows for a quick and comprehensive understanding of the underlying information. This characteristic makes bar graphs universally applicable, serving as a powerful communication tool in various fields.
The versatility of bar graphs is evident in their usage by seasoned data analysts and individuals with varying levels of data literacy. Its visual language simplifies complex datasets, enabling effective communication and analysis.
How to Make a Bar Graph in Google Sheets
Creating a bar graph in Google Sheets is a straightforward process. Begin by meticulously organizing your data into columns, designating one for categories and another for values. Follow these streamlined steps for seamless graph creation:
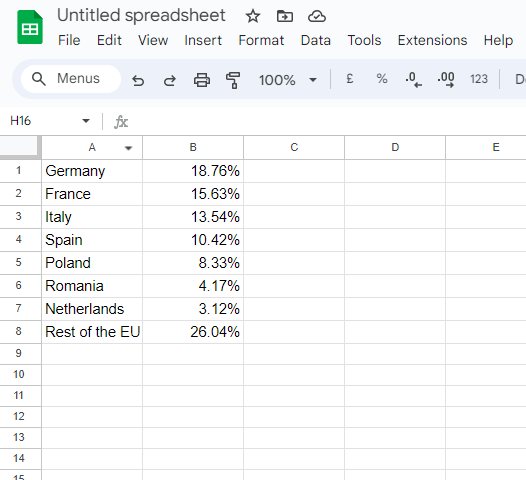
- Input Your Data: Open Google Sheets and input your dataset into the spreadsheet.
- Highlight and Insert: Select and highlight your data, then navigate to the "Insert" option in the menu.
- Choose Chart Type: Within the "Insert" menu, opt for "Chart" and specifically select "Bar Chart" from the chart options.
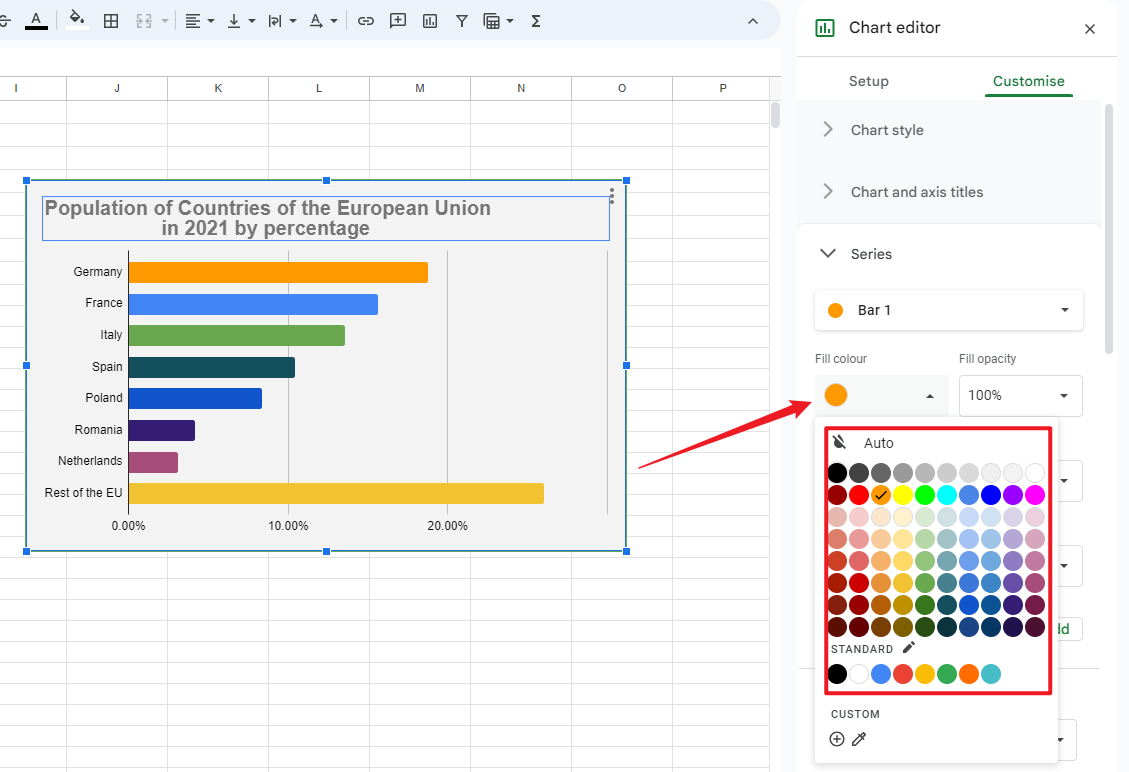
- Customize Your Graph: Personalize your graph by adding titles, selecting colors, and incorporating labels as needed.
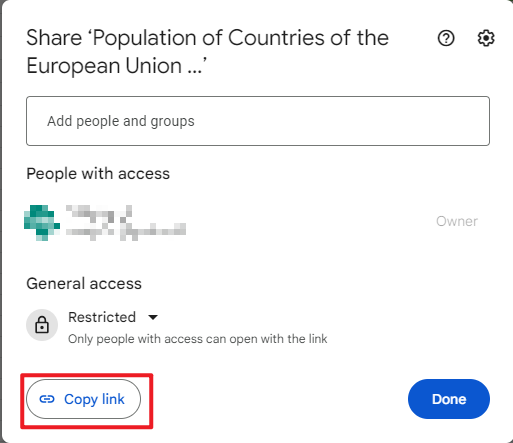
- Save and Share: Once customized, save your work, and if needed, share your visually compelling bar chart with others.
Pros and Cons of Making a Stacked Bar Chart in Google Sheets
Pros:
Enhanced Visual Impact:
Stacked bar charts in Google Sheets offer a visually compelling representation, effectively highlighting the cumulative impact of multiple variables within a single category.
Data Integration and Import:
Google Sheets seamlessly integrates with various data sources, enabling easy data input and import. This flexibility streamlines the process and accommodates diverse datasets.
Cons:
Potential Complexity with Large Datasets:
Managing and interpreting large datasets within Google Sheets can become complex, potentially leading to processing delays and a challenging navigation process.
Limited Customization Options:
While Google Sheets provides basic customization features, the range might be limited compared to specialized data visualization tools. This can restrict the depth of visual adjustments for more specific chart requirements.
Challenges in Precise Labeling:
The process may present challenges in precisely labeling data points, especially when dealing with a dense dataset. Ensuring clarity and readability becomes crucial to convey accurate information.
Make a Bar Graph in Boardmix
Boardmix, an innovative and intuitive data visualization platform, empowers users to create dynamic and visually striking bar graphs effortlessly. Follow these comprehensive steps to harness the full potential of Boardmix in crafting compelling bar charts:

Step 1: Login and New board Creation
Commence your Boardmix journey by logging in and initiating a new board to efficiently organize and structure your data.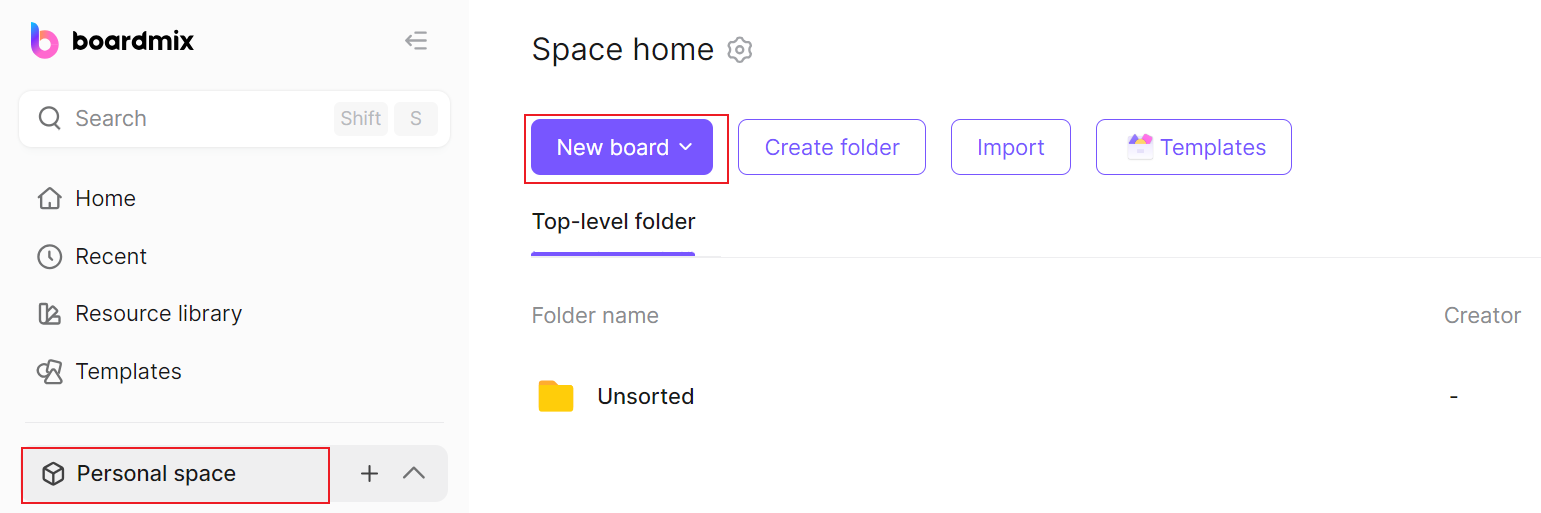
Step 2: Interface Navigation
Navigate to the menu bar located at the left side of the screen. Here, click the 3-dot menu and choose the “Chart” option.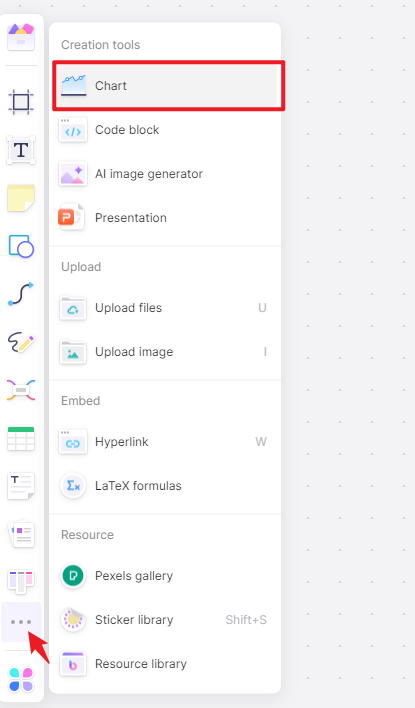
Step 3: Graph Creation
Navigate to the graph creation section, select the bar graph type, input your data variables, and let Boardmix generate an initial graph representation.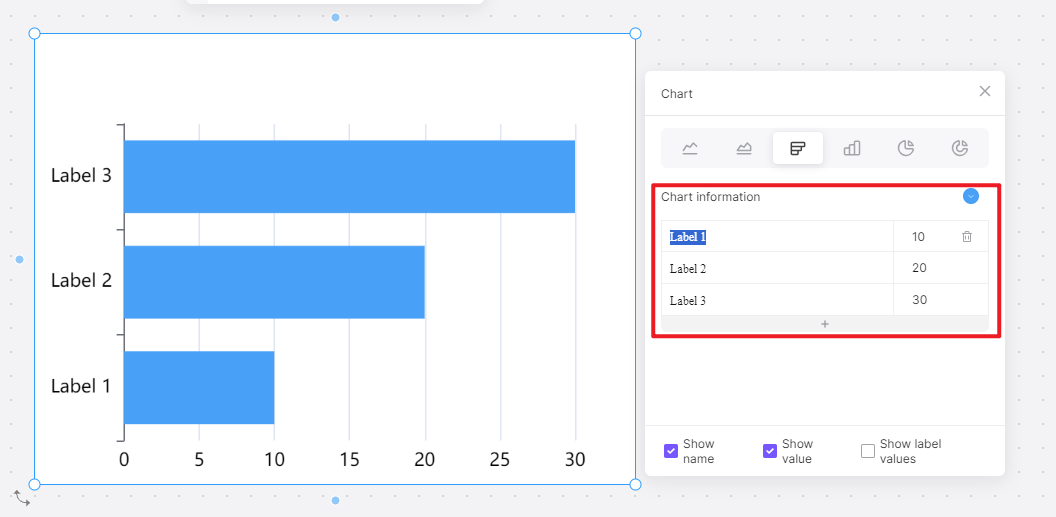
Step 4: Graph Customization
Delve into Boardmix's diverse customization options. Modify colors, labels, and axis scales to tailor the appearance of your bar graph according to your preferences.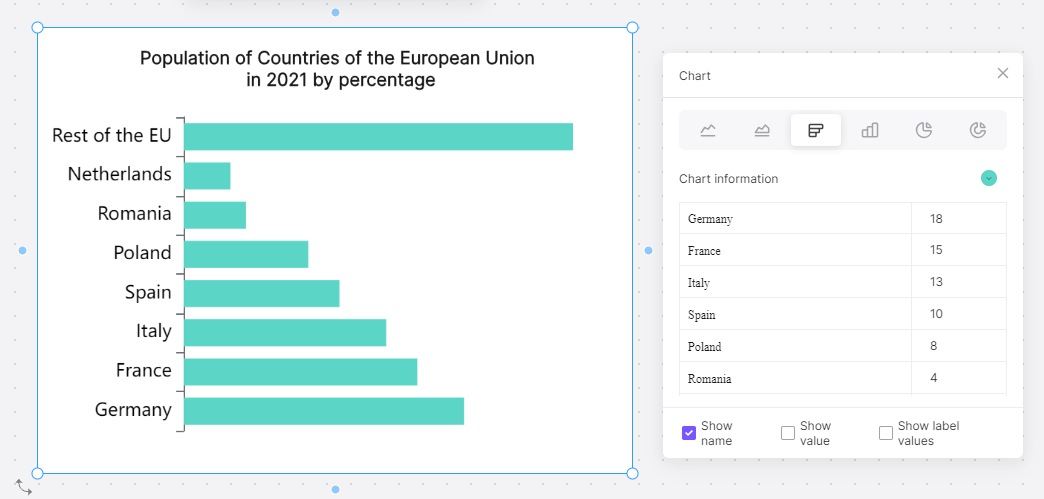
Step 5: Finalization and Refinement:
Preview your bar graph in Boardmix, refining it as needed for optimal visual communication of your data.
Boardmix's intuitive interface and advanced features converge, making it one of the most powerful and user-friendly bar graph makers for dynamic and engaging data visualization. As you navigate through these steps, the seamless integration of data and design ensures an unparalleled experience in transforming raw data into meaningful visual narratives.
How to Choose: Make a Stacked Bar Chart in Google Sheets or in Boardmix
Deciding between Google Sheets and Boardmix hinges on your unique requirements. If simplicity and familiarity top your priorities, Google Sheets emerges as the go-to choice. Its user-friendly interface and widespread accessibility make it an ideal platform for straightforward data representation.
On the other hand, for users in pursuit of advanced customization, interactive features, and visually striking presentations, Boardmix takes the spotlight. Boardmix offers a level of sophistication that goes beyond the conventional, providing a canvas where users can craft not just charts but visual narratives that captivate audiences.
Consider the intricacy of your dataset; if dealing with complex data relationships, Boardmix's advanced capabilities may prove invaluable. Additionally, if your goal is to create an interactive experience for your audience or to convey information with a profound visual impact, Boardmix becomes the tool of choice.
In essence, the decision between Google Sheets and Boardmix boils down to the nature of your data and the visual storytelling you aspire to achieve. Google Sheets offers simplicity and familiarity, while Boardmix unveils a realm of possibilities for those seeking a more refined and visually dynamic approach to stacked bar chart creation. Choose wisely, aligning the tool with your specific needs to maximize the potential of your data visualization endeavors.


