

Excel is a popular spreadsheets tool that Microsoft created as part of its MS Office Suite. It was a lot of help to workers in the accounting and finance teams.
But soon it became immensely popular around the world for the ease and convenience it offered in creating spreadsheets, presenting simple and complex tabular data, and all sorts of numerical calculations.
It is now the go-to tool for people in need of creating large data tables and estimates. But few know that the software program can also be used for creating impressive visuals, including flowcharts. You’ll find all the shapes within Excel that you might need for creating complex flowcharts.
In this article, you will learn how flowcharts work, what components they have, and how you can create flowcharts in Excel for both MS Office and WPS.
Part 1. Unpacking Flowcharts
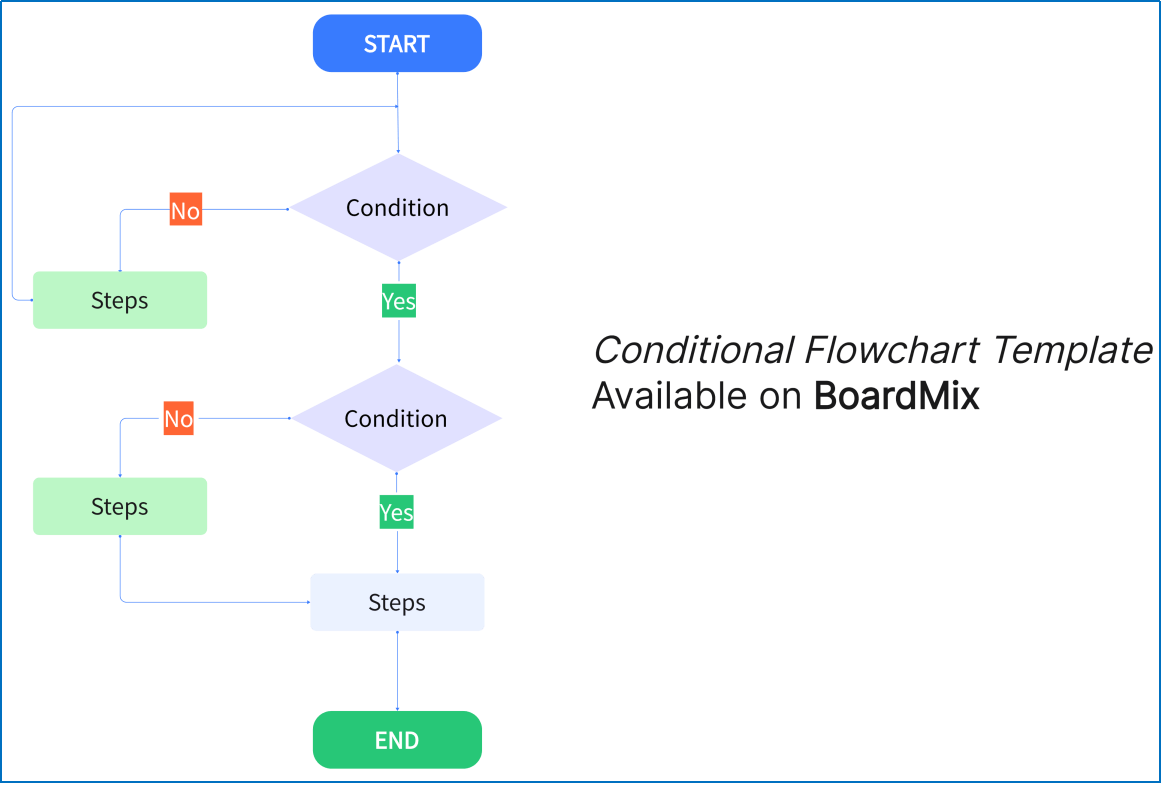
Flowcharts are a very useful tool for visually describing workflows and processes. These diagrams help decision-makers clearly see how a process or system will function. This is also why flowcharts are a great tool for training – because they can simply show the logical steps one needs to take during a process or workflow.
1.1.What is a Flowchart?
Flowcharts are neat diagrams that are built using a variety of simple shapes connected by arrows to outline a process of workflow.
In other words, flowcharts are visual representations of processes. They give a visual representation of complex ideas and help delineate these ideas for all stakeholders to understand and follow the steps within.
With flowcharts, businesses disseminate information about how a certain task is done by their teams, and how new employees coming onboard can be trained on processes, among other things. The end goal of these representations is to streamline the flow of information and boost productivity.
1.2.Basic Shapes We Use in a Flowchart
Flowcharts can be drawn to describe simple to highly complex workflows and processes. Regardless of the level of complexity, you need to learn about the components required to create a flowchart.
Essentially, a flowchart consists of two types of components:
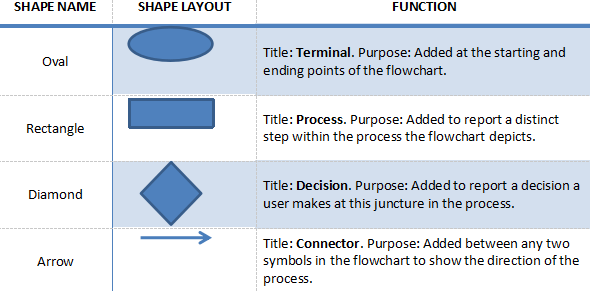
- Shapes: These are geometric shapes – sometimes also called symbols – that specify the nature of the event they report. Each shape or symbol means a certain thing in flowcharts. For instance, an oval-shaped label is used for reporting the start and end terminals of a flowchart.
- Connectors: Connectors are arrows drawn neatly between shapes to report the nature of their relationship or flow of information/work.
Depending on the nature of the process you are reporting with your flowchart, you might need a range of symbols to accurately describe a workflow. However, the following shapes are enough to create a basic flowchart.
Part 2. How to Create a Flowchart in Excel (Microsoft & WPS)
For this section, we will outline the process to create a flowchart in Excel for both MS Office and WPS (just so you know, WPS calls its tool WPS Spreadsheet). While MS Office is the first suite of applications where Excel was introduced, WPS has become a popular competitor because it offers basically the same products but for free.
Incidentally, if you want to learn how to create a flowchart in Microsoft and WPS Word, we have a detailed guide ready to help you with that too.
2.1.How to Create a Flowchart in Microsoft Excel
You can take the following steps to create an impressive flowchart in Microsoft Excel:
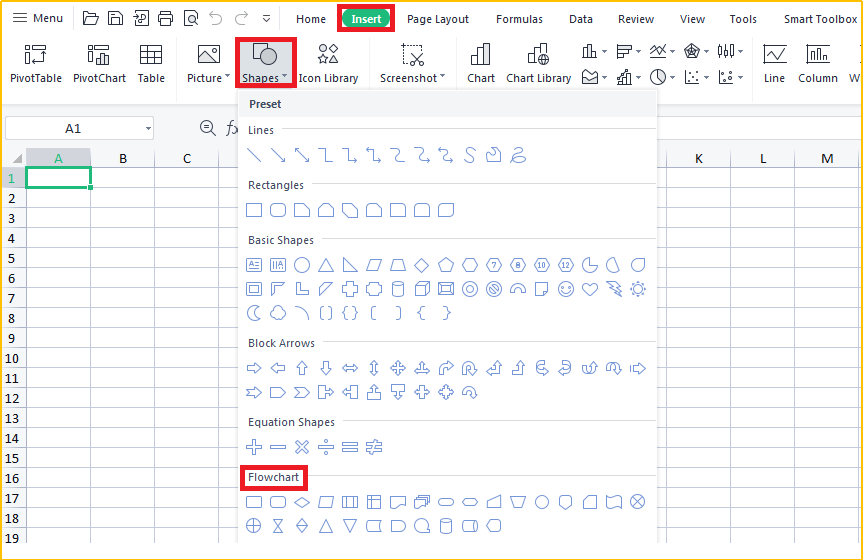
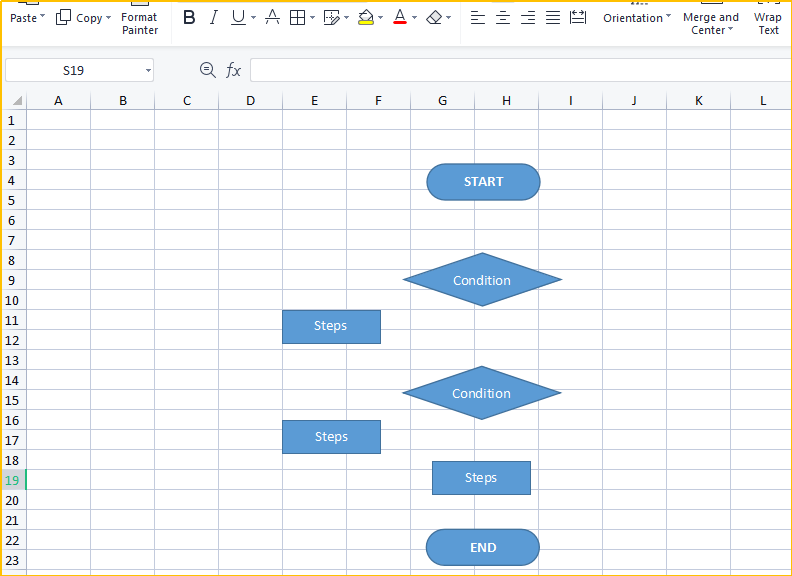
Step 1. When you open Microsoft Excel, click on the INSERT tab, then on the SHAPES button. It will show a dropdown menu with a ton of shapes and a special category titled FLOWCHART.
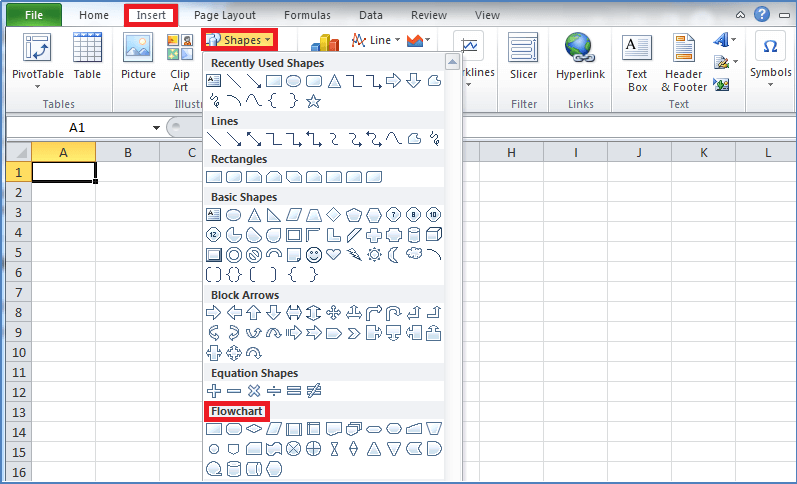
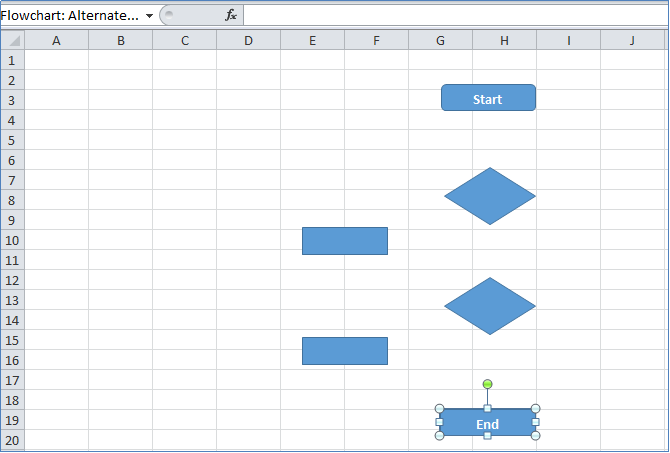
Step 2. From there, you can click on the shapes you want one after the other and draw them on the spreadsheet by dragging the mouse with the left-click button pressed the whole time. Or you can double-click the shape and it will appear in the spreadsheet (You can then use your mouse to resize the shape).
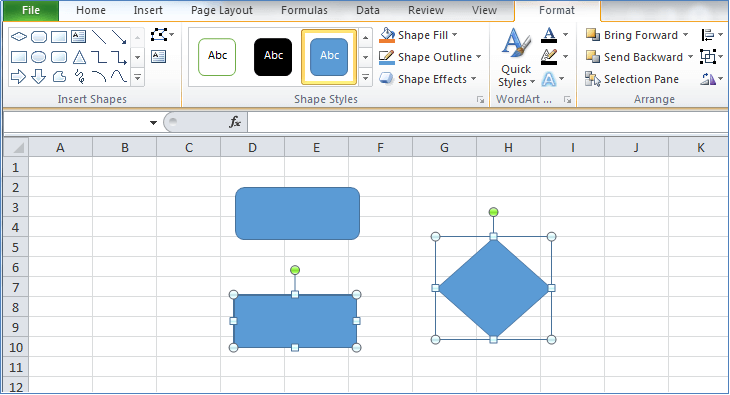
Step 3. Drag and drop shapes to rearrange them the way you need to. Then put appropriate labels on each of them by just clicking inside the shape and just starting typing.
Step 4. Then select arrows from the SHAPES menu and draw them to connect the shapes to give your flowchart the flow. You can also customize the formatting of the shapes to your liking.
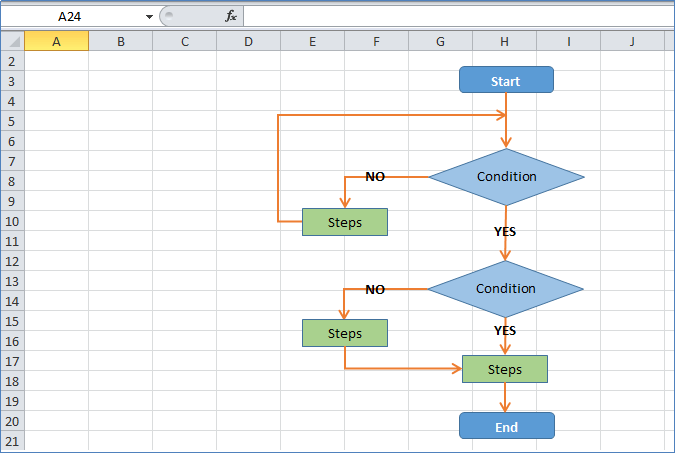
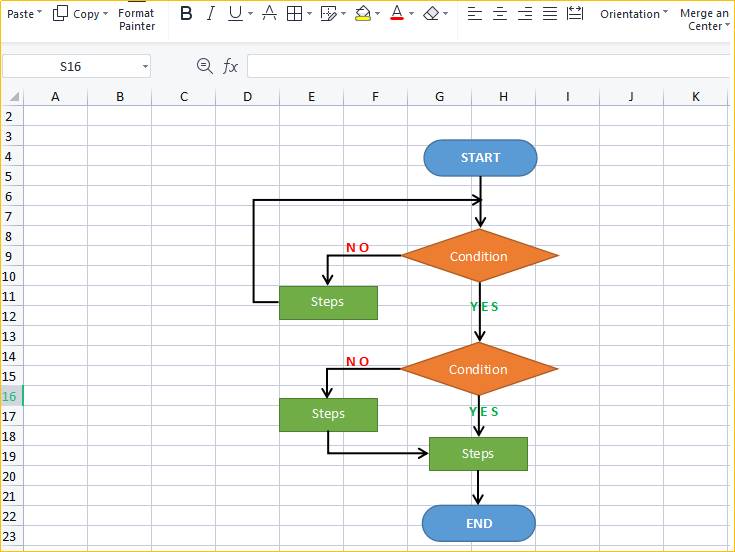
The flowchart you see in this final image above is almost exactly the same as the one we built in Boardmix and put at the top of this page. They are the same in the information they possess, not in aesthetics obviously.
Let’s try to mimic this flowchart using WPS Spreadsheet too.
2.2.How to Create a Flowchart in WPS Excel
To meet that objective, you need to open the WPS Office application suite on your desktop and follow the steps we have listed below. The good news is WPS built its platform to look a lot like MS Office, which means you will find it just as easy to create a flowchart in WPS Spreadsheet (Excel) if you are familiar with Microsoft Excel.
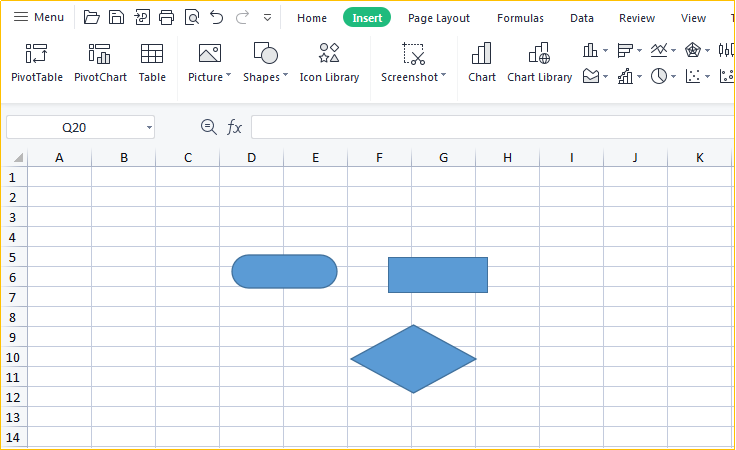
Step 1. With your WPS Spreadsheet open on the screen, click on the INSERT tab, then on the SHAPES menu, which will open a large shapes menu with around a hundred shapes and symbols with a special category titled FLOWCHART.
Step 2. Now, much like Microsoft Excel, you can click on the shapes you want and draw them on the spreadsheet. You can also double-click the shape and it will appear in the spreadsheet (You can then use your mouse to resize the shape).
Step 3. Then rearrange the shapes (You can also copy and paste the shapes you need to repeat) to create your flowchart. Labeling your shapes at this point is recommended.
Step 4. You can now add arrows from the SHAPES menu and connect your shapes. Customize the shapes to make them your own or meet your formatting goals.
Part 3. How to Easily Create a Flowchart with Free Templates
If you followed us along in creating a flowchart in either Microsoft Excel or WPS Spreadsheet, you probably think that was easy. Right? But what if we told you there’s a faster and smarter way to create a flowchart in Excel? You will not necessarily draw the flowchart in your spreadsheets, but you can easily create that impression.
You see, the flowchart we just created in this tutorial for both Microsoft and WPS Excel was a simple one. And even then it took some time to put together each of the components and create the look we wanted.
And this is the shortcoming of these two platforms. You will need to build your flowchart from scratch.
But with an online flowchart maker like Boardmix, you can create a flowchart using templates much faster and then download them as spreadsheets.
3.1. Create Flowcharts Online: Introducing Boardmix
boardmix is an innovative online team collaboration and diagramming tool that you can use to build all kinds of business-related diagrams using specialized tool sets, including flowcharts. Boardmix is free and takes a minute to sign up.
Once registered, you can go into your workspace and use the whiteboard interface to create all kinds of diagrams you need. What’s even better is you can export your diagrams in a lot of file formats, including .XLSX – the standard file format that works on both Microsoft Excel and WPS Spreadsheet.
For Boardmix, you can use the following steps to create a flowchart easily.
Method #1: Using a Ready-to-Use Flowchart Template
Step 1. Sign in to your free Boardmix account and click on the blue “Go to Workspace” button in the top right corner of the screen. ii. At the top of your workspace, you will see a visual templates menu. Click on the “Flowchart” option.
Step 2. This will open a preview window with the flowchart template. Click on the “Use” button to start customizing the template. After that, you can start customizing and make it your own. You will be done in minutes.
Method #2: Using Drawing Elements to Create Flowcharts from Scratch
Step 1. On your Boardmix workspace, choose your scene and start a “New Whiteboard”.
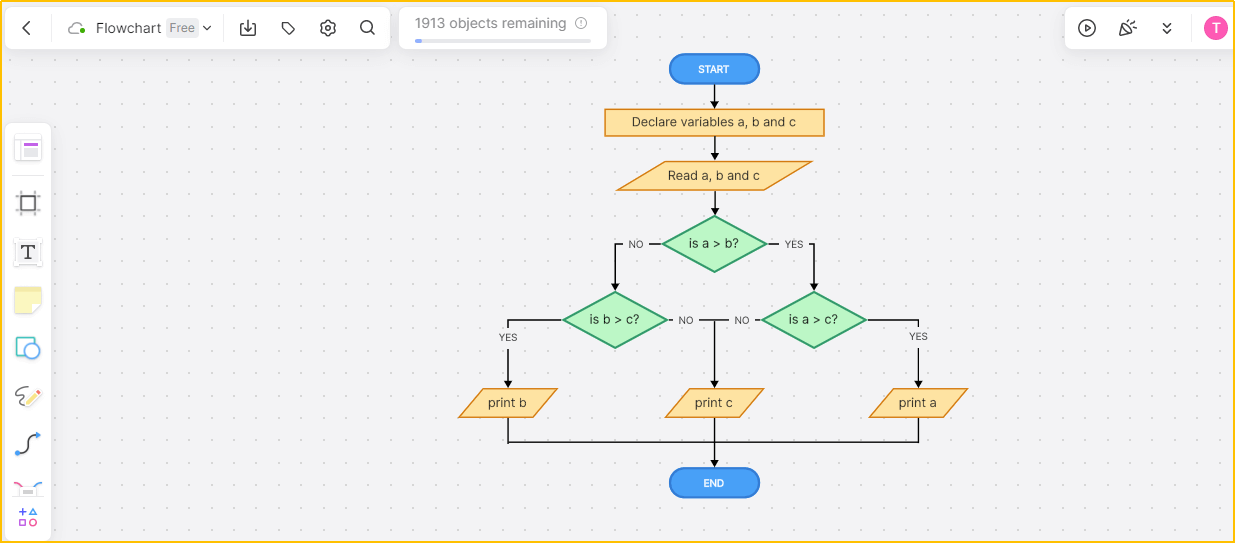
Step 2. Click on the Shapes icon in the vertical toolbar you will always see to the left side of your whiteboard. This will open the Shapes Library.

Step 3. Simply click on the shape you want to use and then double-click on the spot where you want it to appear on your whiteboard. The shape will appear with a toolbar filled with customization features for the shape and the text within.
Step 4. Add more shapes and connect them using arrows. Your flowchart will be ready in no time.

Part 4. FAQs about Creating Flowcharts in Excel
Q1. You said Excel is built to create spreadsheets. Is there a Microsoft program that’s made to create flowcharts?
You can create flowcharts in Microsoft Visio. However, making them on Boardmix is much easier due to the advantages we discussed earlier.
Q2. Does Microsoft Excel or WPS Spreadsheet have flowchart templates?
No. These platforms do not offer any flowchart templates, which is why using them to create flowcharts takes much longer than a tool like Boardmix.
Conclusion
Flowcharts are useful visual tools that help decision-makers and trainees (and other audiences) understand complex workflows and processes easily. Not a lot of people know they can create flowcharts in spreadsheet software programs, like Microsoft Excel and WPS Spreadsheet, so in this article, we’ve presented the methods of doing this. In the meantime, there’s another easier way to create a flowchart, which allows you to import the flowchart to excel as an image. Choose anyone per your needs.


