

Tired of chaotic problem-solving sessions? Teams circling surface issues, insights lost in scattered notes, and stakeholders stuck debating... sound familiar?
Any solution? Defintely. Stop the chaos: Professionally designed, editable Fishbone diagram templates are your answer. No design skills needed. Customize in minutes and download instantly to:
✅ Turn fragmented discussions into actionable clarity
✅ Visualize cause-and-effect relationships at a glance
✅ Accelerate team consensus and decisions
In this practical guide, we’ll unpack free Fishbone diagram template and show you how to apply them effectively in your analysis, workshop, or planning session. Follow our step-by-step guidance to apply free Fishbone diagram template effectively—and stop talking in circles!
1. Why Do We Use Fishbone Diagram?
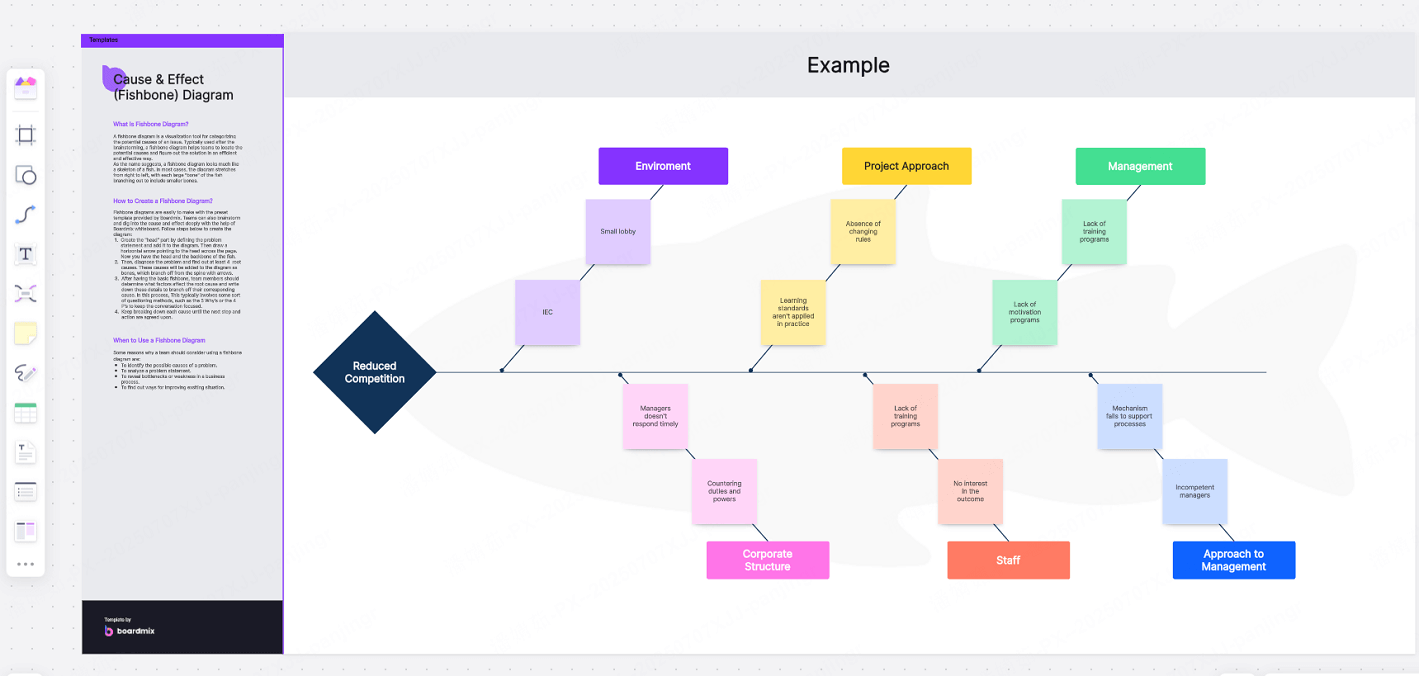
Fishbone diagrams (also known as Ishikawa fishbone diagram or cause-and-effect diagrams) are already solid problem-solvers—but add a pro template, and they become rocket fuel for your team’s clarity. No more chaotic scribbles: you get a laser-focused visual engine that slices through noise and turns messy problems into actionable maps. Here’s how Fishbone diagrams unlock next-level results:
💡 Structure That Clicks: Ditch Chaos, Embrace Clarity
Ever lost hours chasing symptoms while the real villain hides? Templates force order. They snap your core issue into logical categories (People, Process, Tech, etc.) with branching sub-causes—like untangling headphone wires in one swift tug. Suddenly, connections pop. You think sharper. Dead ends vanish.
💡 Collaboration That Flows: Unlock Team Brainpower
Imagine your last workshop: voices talking over each other, ideas scattered like confetti. Templates fix this. With a unified visual battlefield, everyone’s fingers point to the same truths. No layout debates—just pure, focused idea. Communication tightens. Consensus builds while you work.
💡 Root Cause Surgery: Cut Guessing, Hit Targets
Most teams spin wheels on surface fixes. Templates make you dig. You’ll map every sneaky cause—like a detective connecting alibis—until the real culprit stands bare. Hidden bottlenecks? Spotted. Red herrings? Tossed. Result? Less wasted sweat, more “Aha—that’s it!” moments.
💡 Flexibility That Adapts: Deploy Anywhere, Anytime
Why build from scratch when you can plug-and-play? Templates slash setup time. Product tanking? Process jammed? Campaign flopped? Drag, drop, diagnose. Quality checks, sprint postmortems, risk deep-dives—they thrive everywhere. It’s your problem-solving Swiss Army knife: always sharp, always ready.
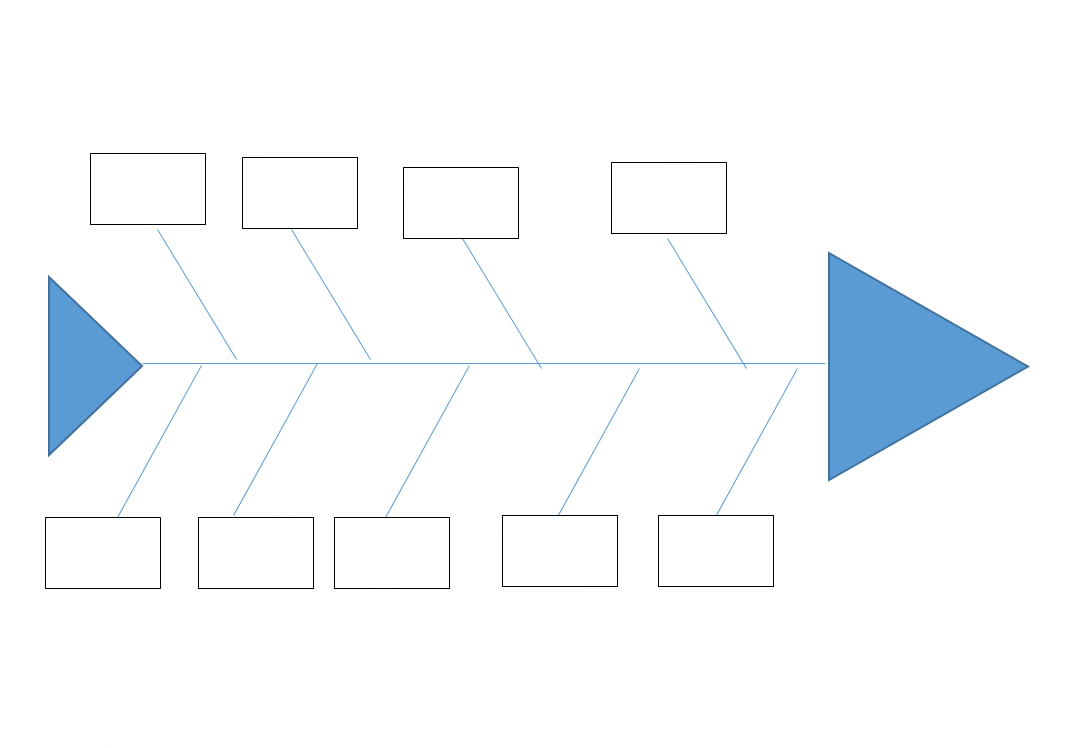
2. How to Make Fishbone Diagram in Word?
Creating a Fishbone diagram in Microsoft Word is totally doable, even without any design software. Here's a quick step-by-step guide to help you get started:
📌 Step 1: Open a Blank Document
Start by opening a new Word document. Go to the Insert tab to begin adding shapes.
📌 Step 2: Use Shapes to Build the Fishbone
Click Insert > Shapes, and choose the Line and Arrow tools to create the central spine and branches.
Draw one long horizontal arrow for the “main bone” (the central problem statement).
Add diagonal lines branching out from it at angles—these will represent categories of possible causes.
📌 Step 3: Add Text Boxes for Causes
Use Text Box (Insert > Text Box) to label each branch with categories like People, Methods, Materials, or Environment. Then, add smaller branches off those to list specific contributing factors.
📌 Step 4: Customize and Organize
Adjust colors, align elements, and group shapes together for easy movement. You can also right-click to align and distribute objects for a cleaner layout.
📌 Step 5: Save or Export
Once complete, save the diagram or export it as a PDF for easy sharing.
3. Best Free Fishbone Diagram Templates
Here's your escape route: Choosing the right template doesn't just organize ideas—it instantly transforms messy thinking into clear, compelling visuals. Skip the hours of manual clicking and jump straight to results with these 3 battle-tested Fishbone diagram templates. Edit them freely in Boardmix and export in crisp HD—turning chaos into clarity has never been easier.
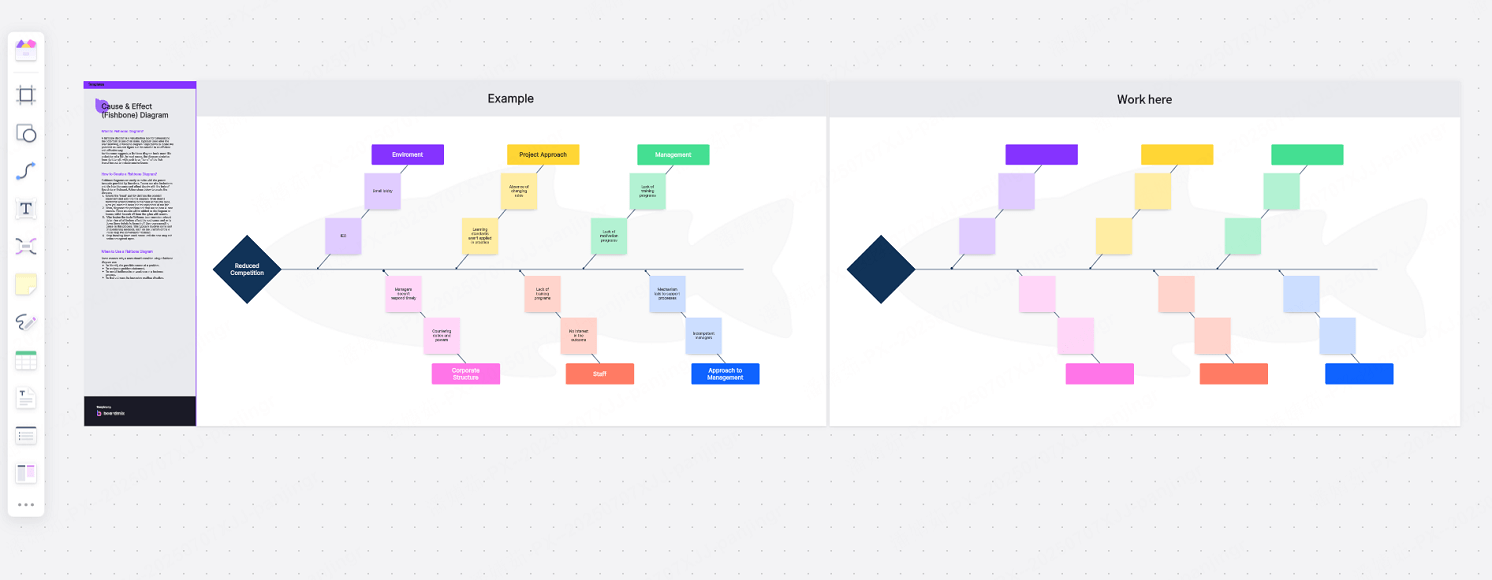
🤜 The Classic Symmetrical Fishbone Diagram: Your Go-To for Clear Foundations
• Best For: You need straightforward analysis (perfect for beginners or quick team alignment).
• Style Highlights: Clean blue-and-white design with balanced branches. Like a well-organized filing cabinet—zero visual noise, pure logic.
• Why It Shines: Gets everyone on the same page fast. Ideal for training sessions or client-facing meetings where simplicity wins.
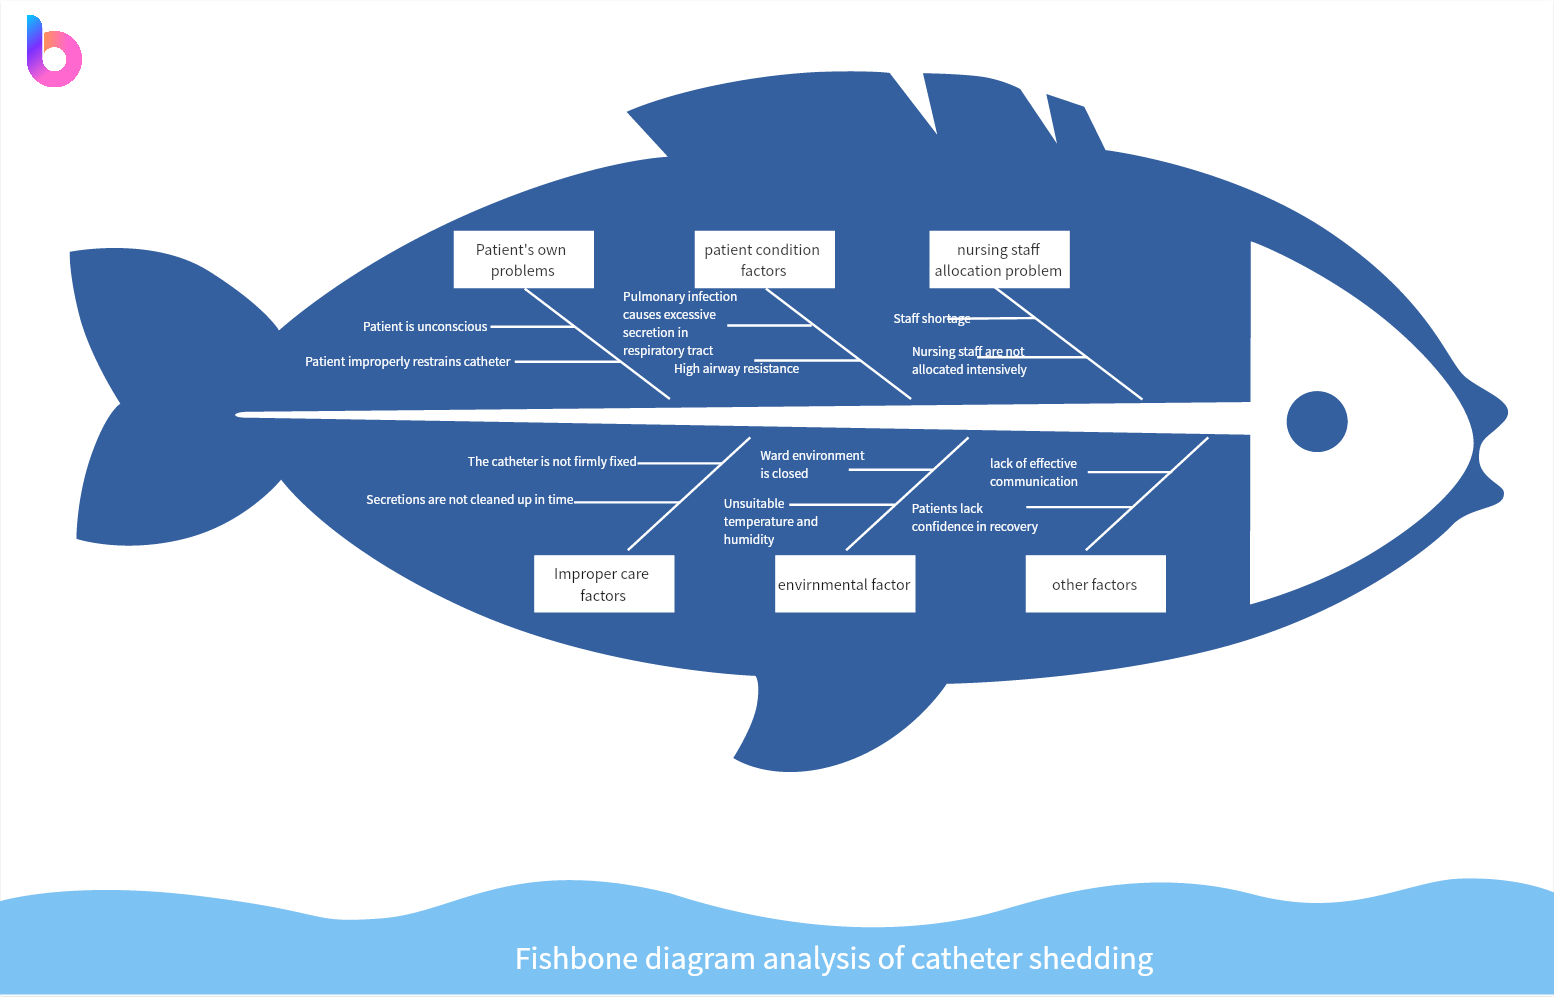
🤜 The Multi-Dimensional Cause Fishbone Diagram: Untangle Complex Chaos
• Best For: Problems span departments, causes pile up, or deep-dive workshops need structure.
• Style Highlights: Flexible branches expand like an accordion. Throw 50 ideas at it? No sweat. Add, merge, and map freely.
• Why It Shines: Keeps cross-functional teams focused during heated debates. Perfect for root cause marathons or innovation sprints.
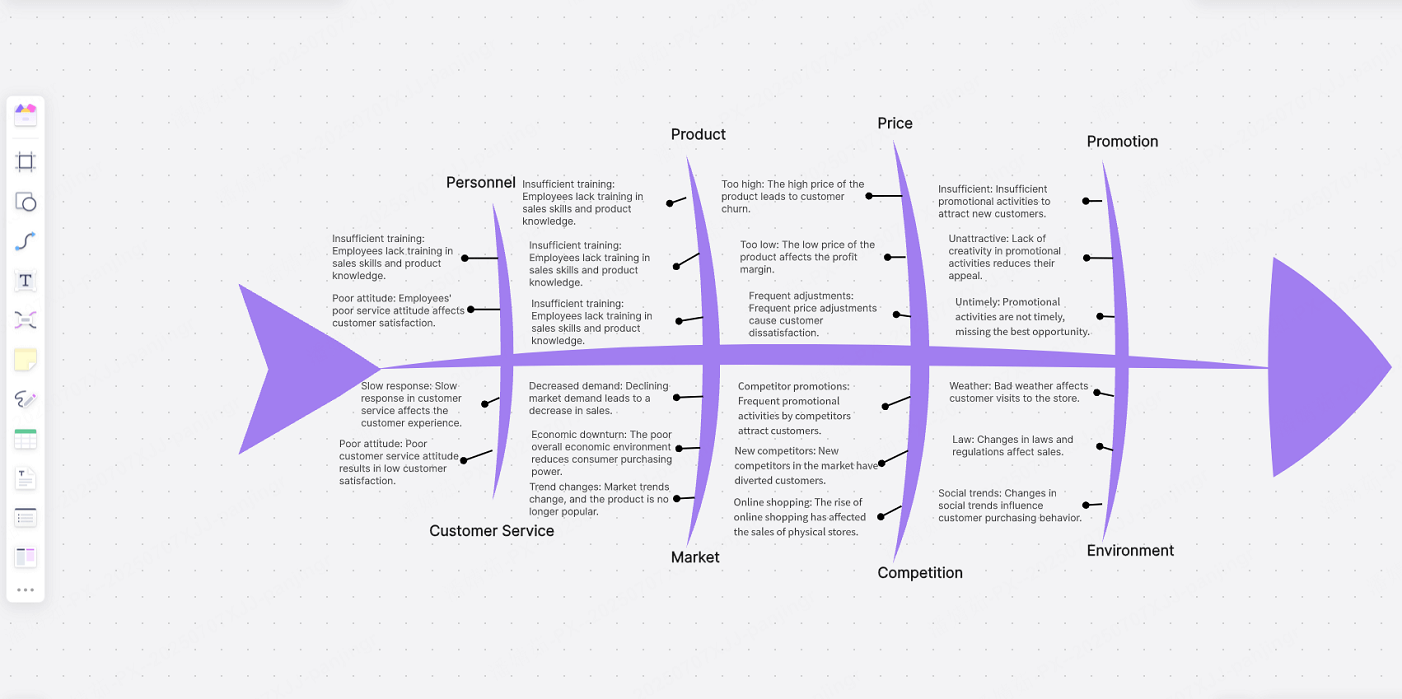
🤜 The Creative Gradient Fishbone Diagram: Make Data Unforgettable
• Best For: Presenting to execs, crafting standout reports, or turning dry analysis into "wow" moments.
• Style Highlights: Sleek color transitions and modern lines. Turns cause-effect chains into visual storytelling—no design degree needed.
• Why It Shines: Grabs attention in slides or PDFs. Your secret sauce for performance reviews or investor updates.
4. How to Use Free Fishbone Diagram Templates?
Still struggling to use expensive Fishbone diagram templates? Still struggling to find a Fishbone diagram creators? Get started quickly with intuitive tools in Boardmix and free Fishbone diagram templates. Create professional, eye-catching Fishbone diagrams effortlessly – lightning-fast, collaborative, and requiring no design skills! Here’s how to dive in:
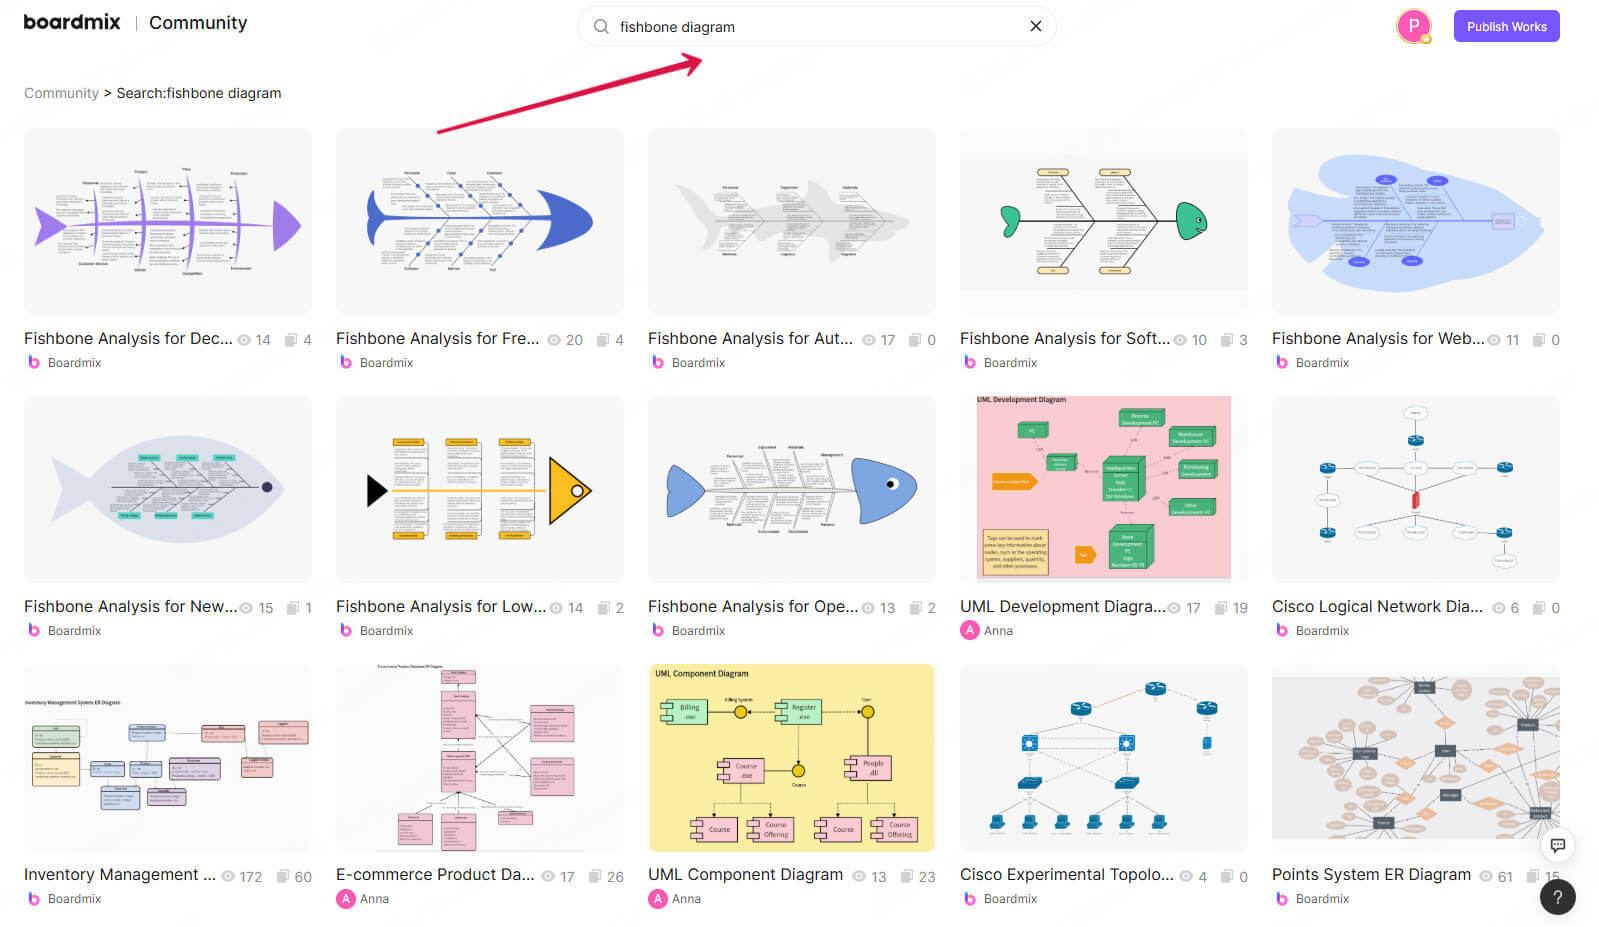
(1) Grab Templates Instantly
Head to the Boardmix Community and type keywords like "Fishbone Diagram," "Cause-and-Effect," or "Root Cause Analysis" into the search bar. Instantly browse dozens of stunning, ready-made Fishbone diagram templates. One click adds your favorite to the workspace—skip the groundwork and start editing right away!
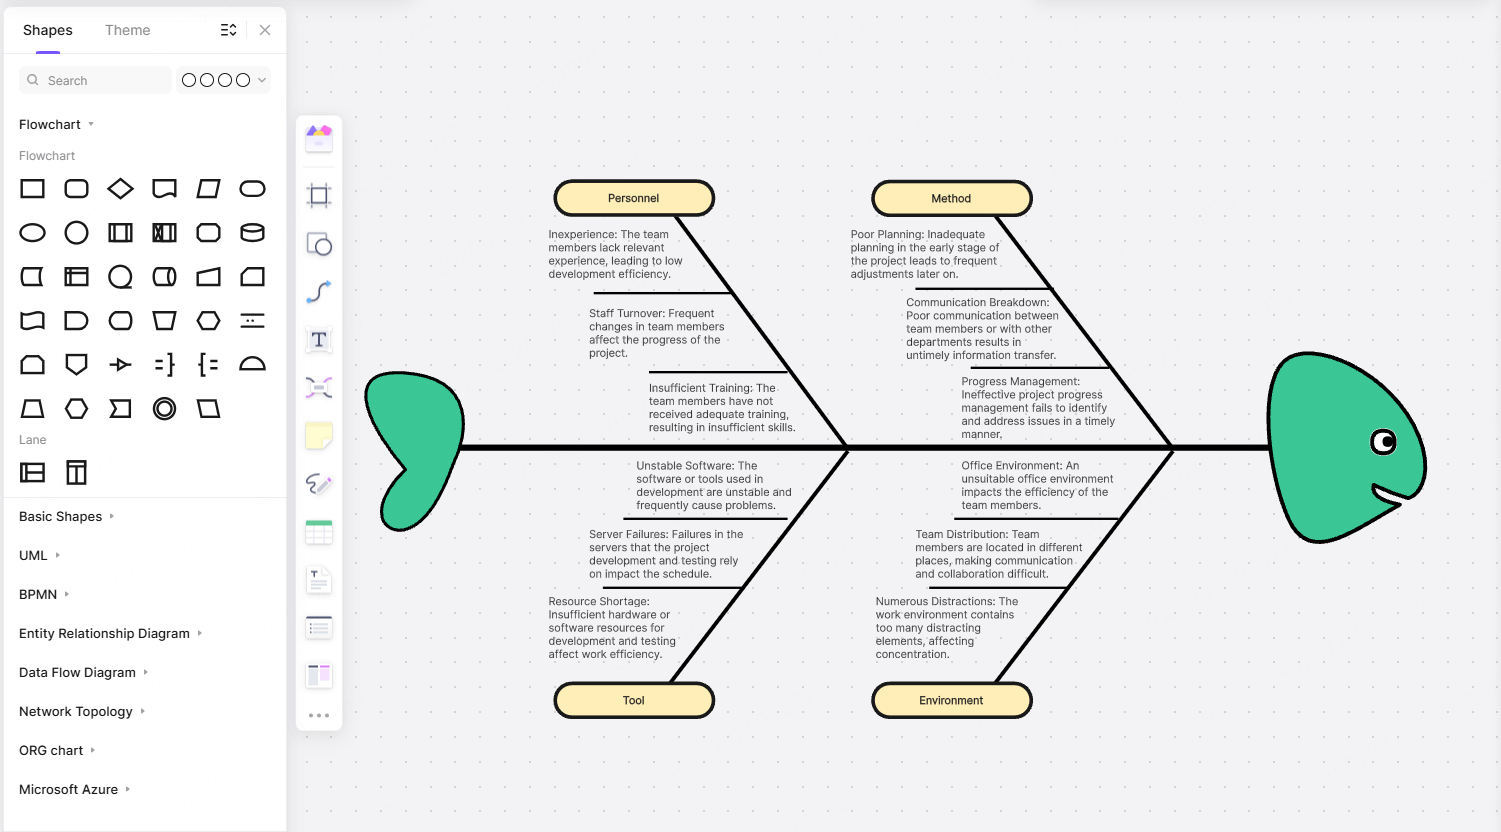
(2) Drag, Drop, Done (Zero Learning Curve)
Once inside your template, customize everything with simple drag-and-drop actions:
• Click to edit text, icons, or shapes – drag freely to rearrange
• Personalize colors, fonts, line styles, and icons to match your brand or mood.
• Need an extra branch? Just drag one in! Prune or expand sections to fit any problem’s complexity.
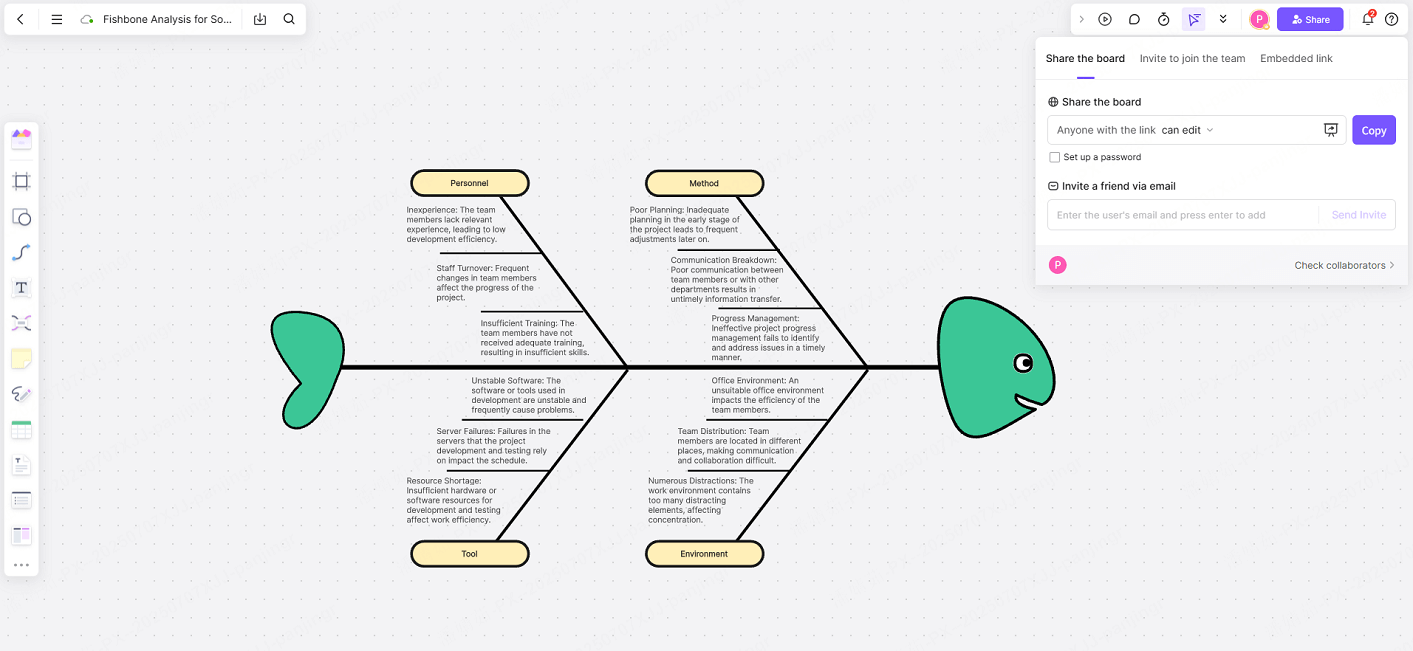
(3) Collaborate Live, Stay in Sync
Boardmix shines in team settings, making remote work or group sessions a breeze:
• Invite teammates to edit together – everyone sees changes instantly, killing delays.
• Auto-save to the cloud means no lost work. Plus, rewind to earlier versions anytime.
• Watch ideas flow in real time – perfect for brainstorming sessions, decision-making, or dissecting complex issues.
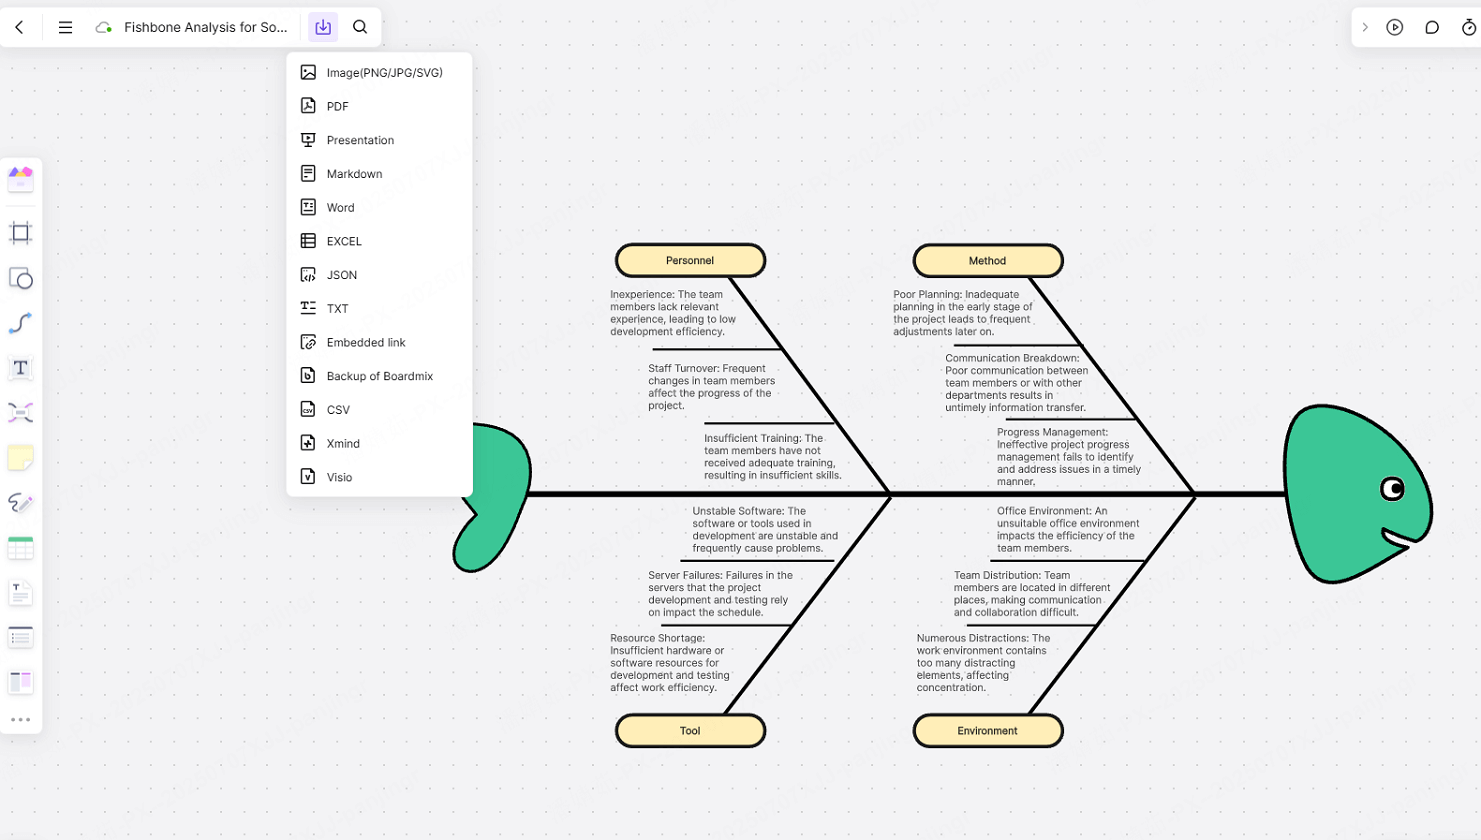
(4) Export Like a Pro, Impress Every Time
When your diagram’s polished, export it in one click as PDF, PNG, or SVG. Ideal for meetings, reports, or project documentation – serve up clear, professional visuals every time.
Conclusion: Where Logic Meets Leadership
Say goodbye to dull diagrams. With Boardmix, Fishbone templates become your shortcut to crystal-clear insights—turning complex problems into visual stories that actually stick with your team and stakeholders.
Why choose Boardmix?
👉 Build airtight logic with effortless drag-and-drop tools
👉 Present your thinking with visuals that speak louder than words
👉 Walk into any room ready to impress—before you even say a word
Stop explaining. Start leading—with clarity, confidence, and Boardmix.


