

Data flow diagrams primarily consist of external entities, data flows, processing, and data storage. Data flow diagrams are typically divided into multiple levels, gradually showing the details of the system or program from top to bottom. The top-level data flow diagram displays the interaction between the system or program and external entities, as well as the main data flow, while the lower-level diagrams show more detailed sub-processes and data flows. This article will share how to draw data flow diagrams using the professional drawing software—Boardmix.

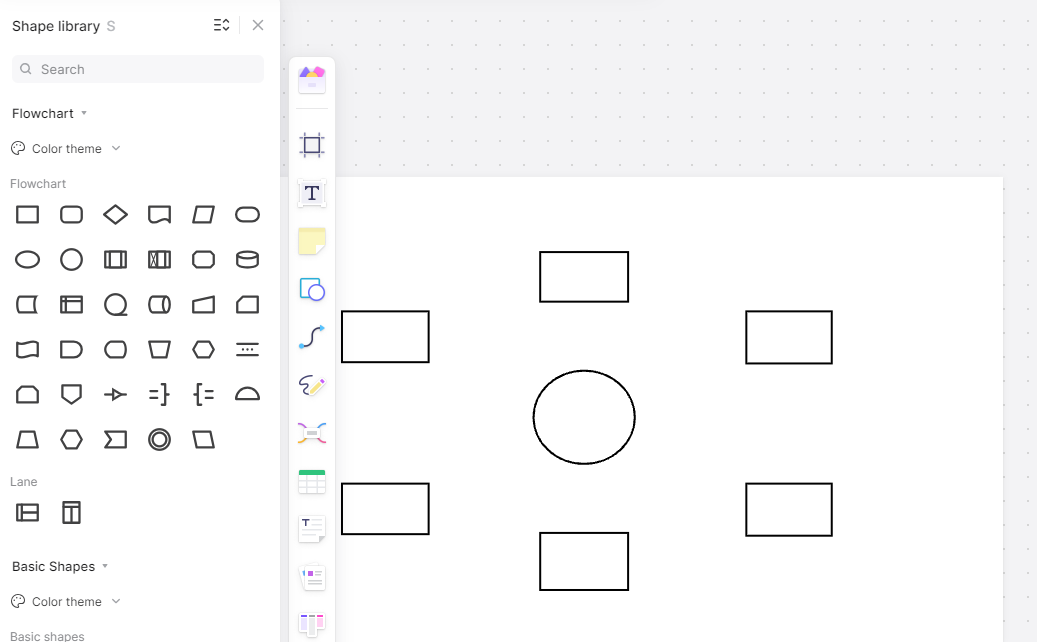
Drawing data flow diagrams can be a tedious task, but the online drawing software Boardmix offers a standard library of Data Flow Diagram symbols. It supports custom text editing, fill color, and line direction, which is very easy to use in your daily life and work.
Even better, in the community section, there are resources for data flow diagram templates that you can apply for free, significantly improving your drawing efficiency! The following introduces you to the detailed steps of the relevant data flow diagram.
1. Dentify the System
Determine the boundaries of the system you want to represent. This could be a whole organization, a single department, or even a single process.
2. Define the Processes
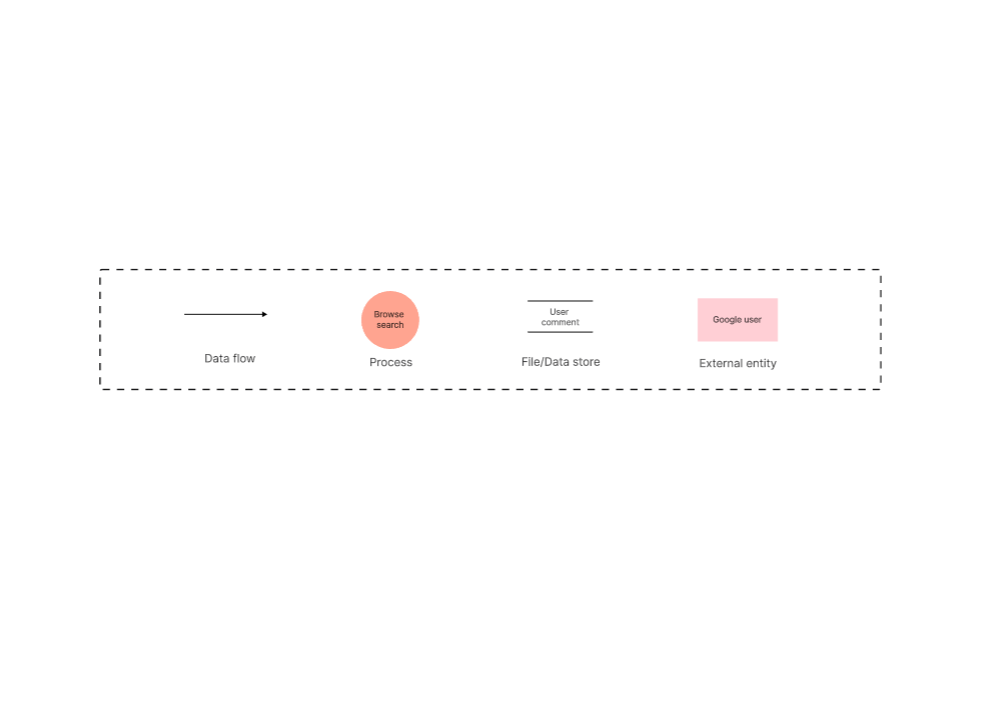
Identify all the processes that occur within the system. These are typically represented by circles or rectangles in the data flow diagram.
3. Define External Entities
Identify any external entities that interact with your system. These could be users, external systems, or data sources and destinations, and usually represented by squares or rectangles. Log in to the Boardmix web page, find the graphics tool in the toolbar, and use the built-in data flow diagram symbols to draw the data flow diagram in sequence.
4. Define Data Flows
Determine how data moves between different parts of your system and any external entities. These are represented by arrows in the DFD and remember to indicate the name of the data flow on the arrow.
5. Drawing Process
Represent the main processes as circles or ovals and write the names of the processes. The processing process receives an input data stream, processes it, and produces an output data stream.
6. Define Data Stores
Identify where data is stored within your system. These could be databases, files, or other storage mediums and are typically represented by two parallel lines.
7. Add details
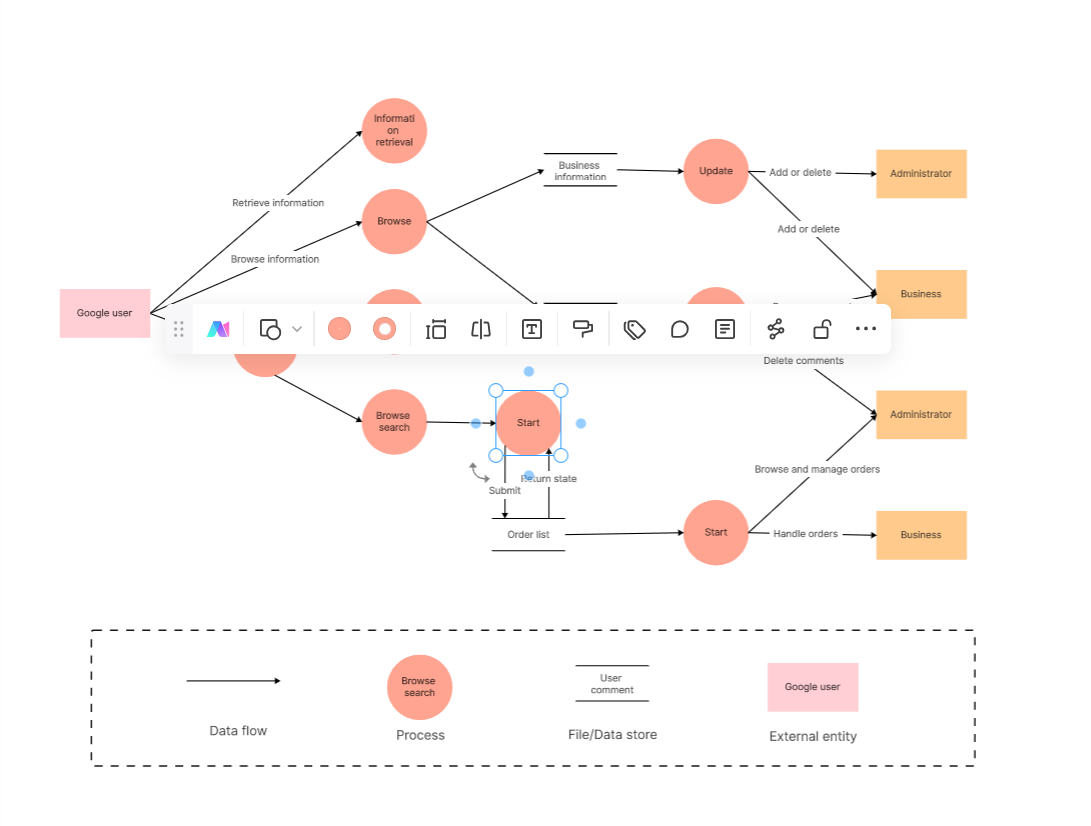
Add more data flows, processes, and data stores as needed to demonstrate more detailed data flow and processing, which will make your data flow diagram more comprehensive.
8. Determine the Hierarchy
The data flow diagram is broken down into multiple levels depending on the complexity of the system or program. Top-level data flow diagrams show overall data flow and processing, while lower-level data flow diagrams show more detailed sub-processes and data flows.
9. Review and Refine
Check your data flow diagram for accuracy and completeness. Make sure it accurately represents the system and that there are no missing components or connections.
Through data flow diagrams, you can clearly understand the source, flow, and processing of data within a system or program, aiding in system analysis, design, and communication.
After completing the data flow diagram, you can share it for collaborative review and quickly gather feedback. Boardmix also supports online comments and video meetings, making team communication and collaboration even more efficient.
Choosing the right drawing tool to create data flow diagrams can save you a lot of time and effort. Boardmix built-in essential drawing symbols and line arrows, and when you draw a data flow diagram, you can freely drag and change the size, color, style of graphics, and layout. Meanwhile, Boardmix also provides a wealth of chart template resources that you can use freely, download, share, and export.


