Affinity Diagrams serve as a beacon in the storm of overwhelming data, helping teams categorize ideas, identify patterns, and discover hidden connections. They are not just diagrams but a bridge that connects raw data to meaningful insights, transforming chaos into order. Whether you're brainstorming solutions for a challenging project or trying to decipher customer feedback, Affinity Diagrams can be your guiding compass.
About the Affinity Diagram Template
What is an Affinity Diagram?
An Affinity Diagram, also known as the KJ Method, is a tool used to organize and categorize a large amount of information or ideas into related groups. This technique is commonly used in brainstorming sessions, project management, user research, problem-solving, and decision-making processes.
Build Affinity diagram for Free
The process involves writing down ideas or data on notes (traditionally on sticky notes), which are then grouped based on their natural relationships or common themes. These groups are then labeled, providing a clear and organized overview of the information.
History of the Affinity Diagram
An affinity diagram is not new to businesses and organizations. Affinity mapping was developed by Japanese anthropologist Jiro Kawakita in the 1960s. Some call it the K-J method to honor its inventor, Kawakita.
Purpose of the Affinity Diagram
Organizations utilize an affinity diagram to make sense of large volumes of mixed facts and information like user needs, opinions, insights, brainstorms, and design concerns. Besides organizing ideas and data, the diagram is also used to develop simplified and thorough decisions or plans for specific company projects.
Why Use the Affinity Diagram Template
An affinity diagram template offers a practical and efficient way to handle complex information. It fosters collaboration, enhances communication, promotes creativity, saves time, and provides a consistent approach to problem-solving.
1. Affinity diagram provides a structured approach to organize and categorize ideas or information. Using a template, teams can easily sort their thoughts and data into related groups. This makes the analysis process more manageable and efficient.
2. An affinity diagram template facilitates collaboration. It allows all team members to participate in the brainstorming and categorizing process. This active involvement ensures that everyone's input is considered, leading to more comprehensive and balanced solutions.
3. Affinity diagram template enhances visual understanding and communication. It presents information in a clear and organized manner, making it easier for team members to grasp the bigger picture and engage in effective discussions.
4. Using a template saves time. Instead of starting from scratch each time, teams can use the same basic structure for different problems or projects. This streamlines the process and ensures consistency in handling and presenting information.
5. Affinity diagram template encourages creative thinking. Seeing how different ideas or pieces of data relate can spark new insights and lead to innovative solutions.
Benefits of Using Affinity Diagram
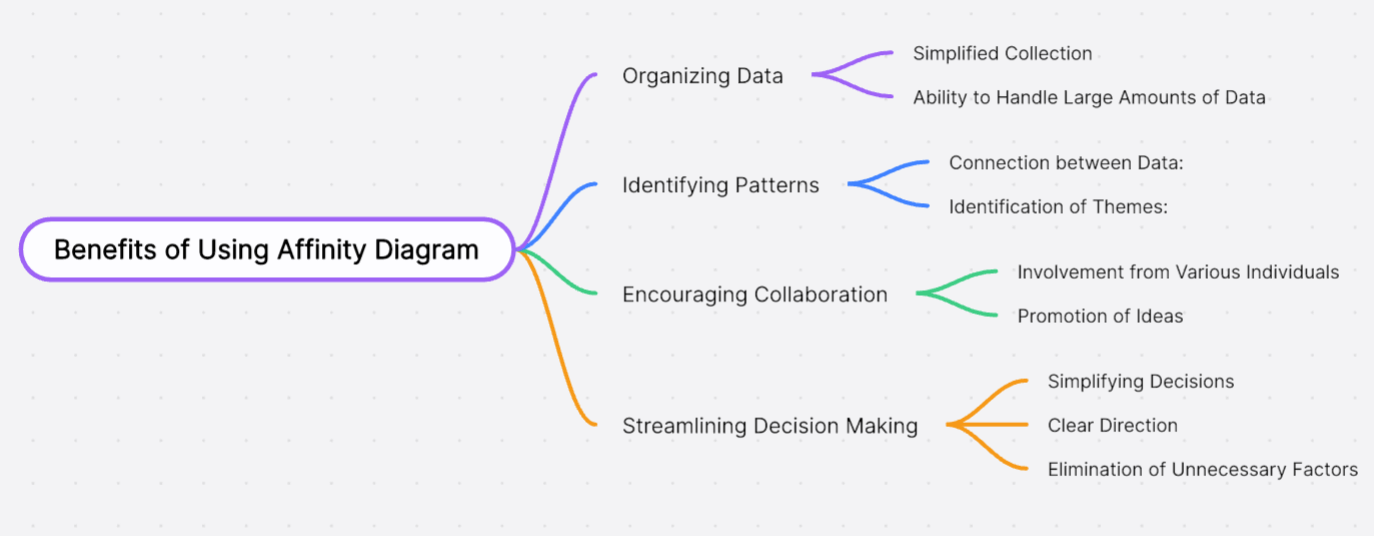
Organizing Data
Various ideas can be overwhelming, even for more prominent organizations. The affinity diagram allows you to group similar information for a more simplified and concise data collection.
Identifying Patterns
As you review these ideas and data, groups can make significant connections between them or identify recurring themes that could have been more evident initially. These themes and patterns are useful in creating initiatives to realize specific company goals.
Encouraging Collaboration
Whether it is about gathering data from peers, team members, or surveys, creating the affinity diagram template will involve various individuals. As a result, it encourages all those involved to give suggestions, inputs, and other ideas to create a better diagram for the group. As you already know, the more ideas, the better it is for the organization.
Streamlining Decision Making
Since the diagram allows you to simplify the volume of data collected, it makes decision-making easier. The affinity diagram clearly illustrates the group's direction in reaching a specific target or goal. It will also save you from unnecessary factors affecting the organization's decision-making.
When to Use the Affinity Diagram Template
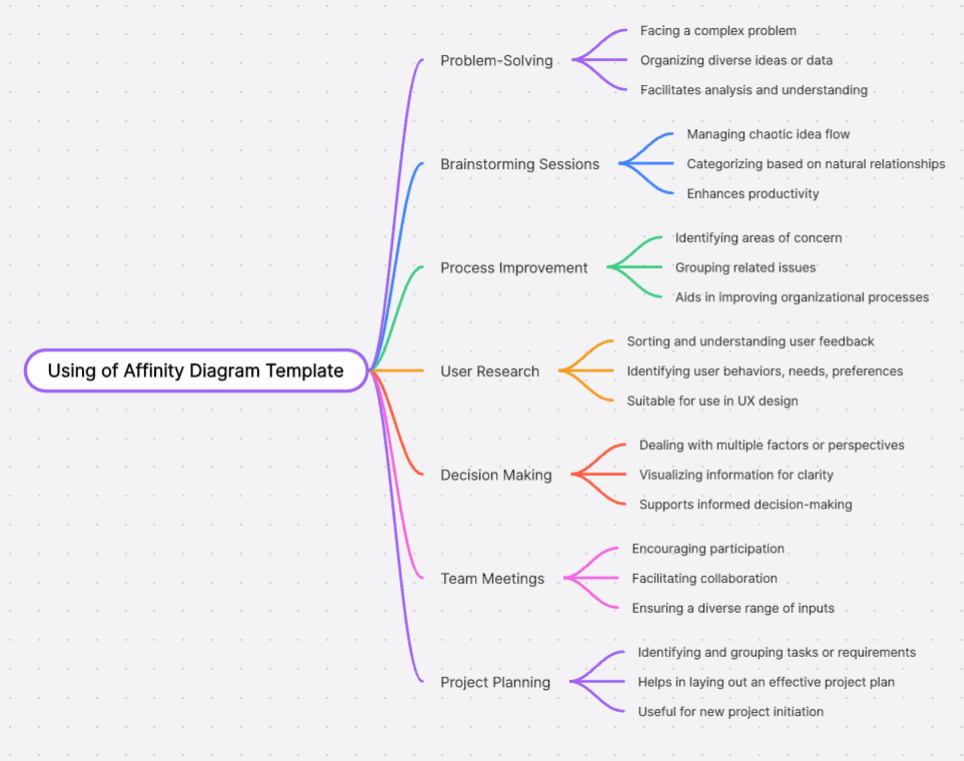
The Affinity Diagram Template can be used in various situations, each with its unique advantages. Here are a few scenarios:
Problem-Solving: When you're facing a complex problem and have a plethora of ideas or data to sift through, an affinity diagram template can help organize and analyze information effectively.
Brainstorming Sessions: During brainstorming, ideas often flow chaotically. An affinity diagram template aids in categorizing these ideas based on their natural relationships, making the session more productive.
Process Improvement: If you're looking to improve a process within your organization, the template can help identify areas of concern by grouping related issues.
User Research: In user research or UX design, an affinity diagram template can be used to sort and understand user feedback, behaviors, needs, and preferences.
Decision Making: For decisions that involve considering multiple factors or perspectives, the template can help visualize the information clearly and facilitate informed decision-making.
Team Meetings: To ensure everyone's voice is heard during team discussions, using the template can encourage participation and collaboration.
Project Planning: When initiating a new project, the template can help identify and group tasks or requirements, aiding in effective project planning.
Examples of Affinity Diagrams
Business Applications
Build Affinity diagram for Free
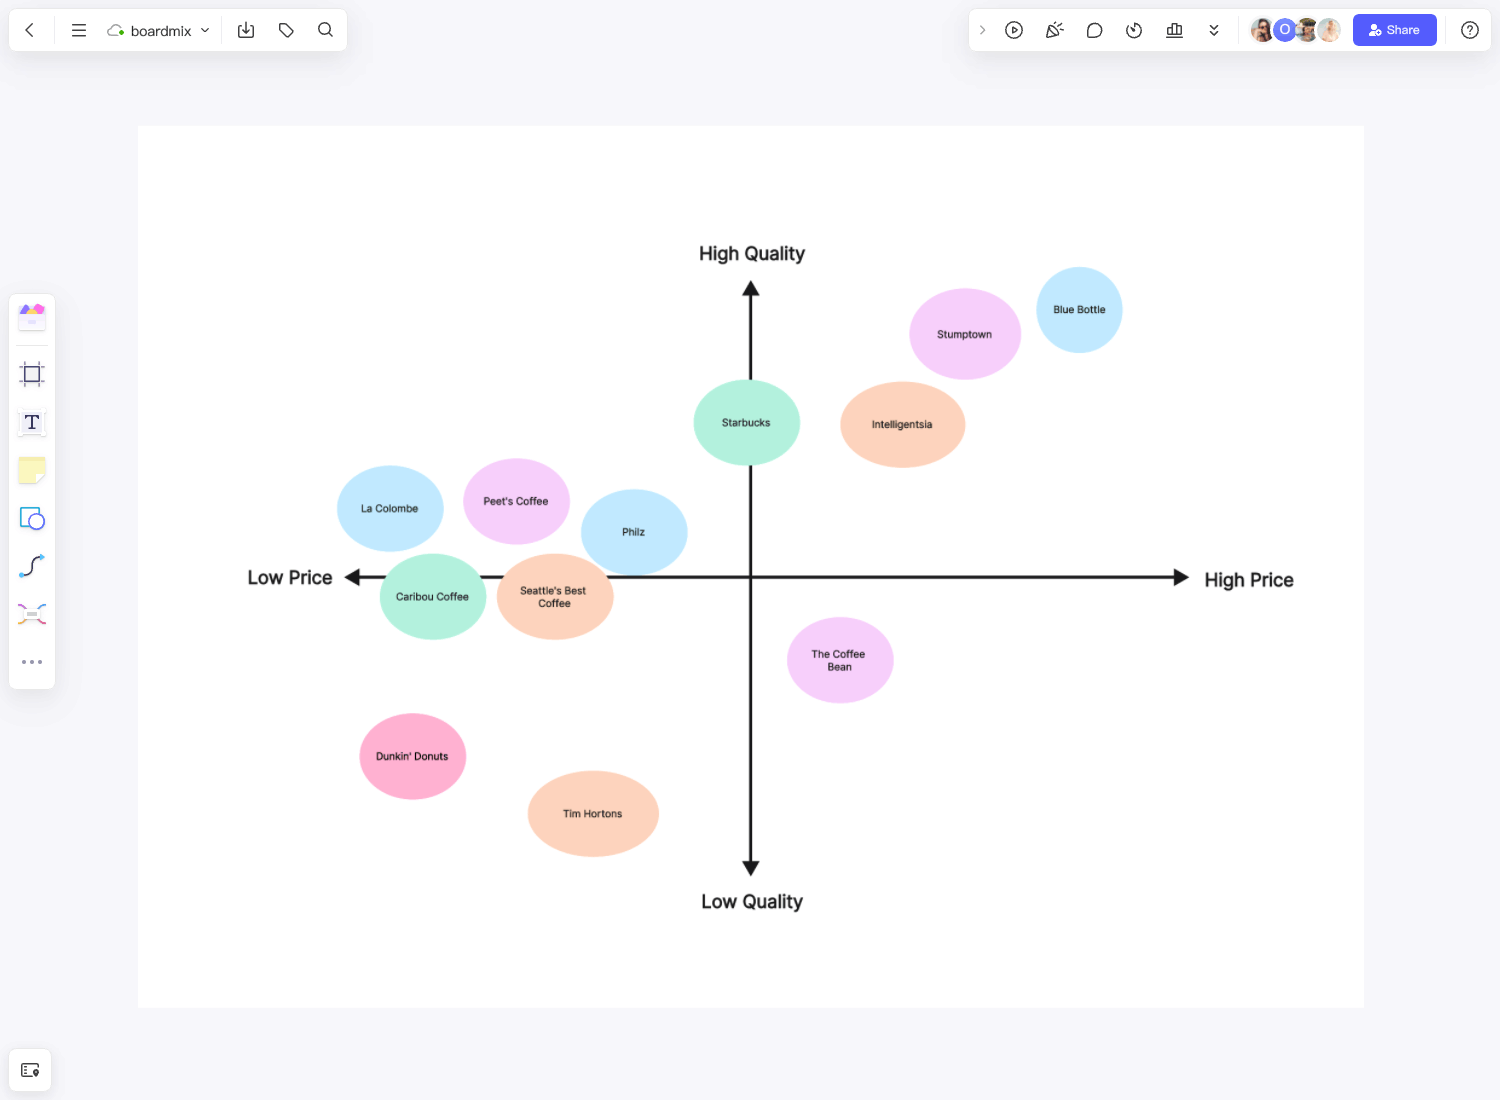
Below is an example of an affinity diagram that aims to promote one's business to its market. The creator used various colors for every main category to identify the differences quickly. The diagram looks simple, but remember, when creating a marketing strategy for a brand, it is better to add subcategories for a more specific approach. Most diagramming software today allows you to do that, so you must maximize it.
Educational Applications
School lessons like literature and math equations can be a handful for some learners. Students and teachers alike can use an affinity diagram template to create relationships among specific sets of equations. This way, you need not review a whole book to familiarize yourself with solving problems. Also, you can create summaries of books and other literary pieces using the diagram.
Healthcare Applications
Charting is essential in the medical field. It's where the medical and personal information of patients are recorded. In most cases, clinics and hospitals need it to track patient conditions. Below is an example of an affinity diagram that medical practitioners can use to record fundamental records of patients. While this may be different from the charts used by most hospitals, the diagram can come in handy if you want a more straightforward and specified patient information sheet.
Government Applications
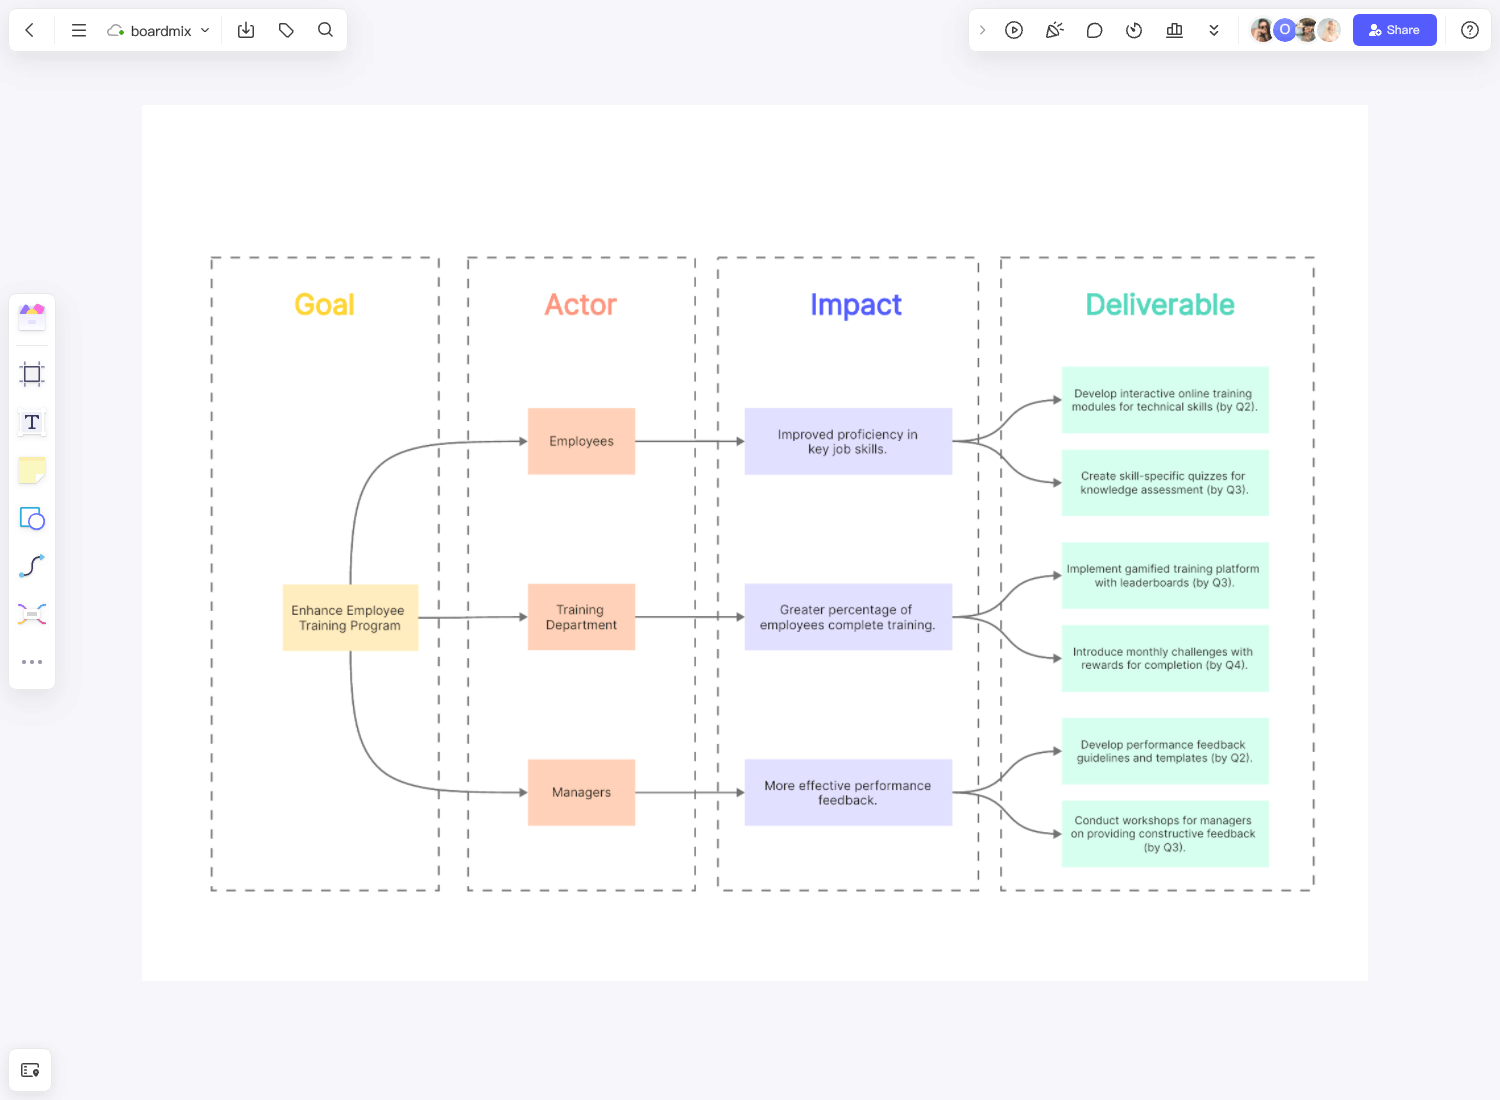
This is a relatively simple illustration of assessing a town's logistics initiatives. The affinity diagram template involves four main categories; however, you can add more if you think there are other significant factors to consider. Besides evaluating the effectiveness of the city's logistics, this tool also allows institutions to improve their processes if the evaluation does not pass the criteria.
Process of Creating an Affinity Diagram
Gathering data
A company must have data to organize. This data does not necessarily have to be in the final diagram output. In most cases, the information can be written on paper, cards, or sticky notes, which will be organized in the later stages of creating the diagram.
Brainstorming
Discussion among your members is essential to come up with ideas and data for the affinity diagram. The data generated here are still raw and will need further discussion as you go along the process. However, it must be considered that ideas must be related to the core paths the group is focusing on during brainstorming.
Observation
Along with brainstorming, teams must also look into whether the information is enough to cover the organization's goal. During this stage, members can also decide the type of affinity diagram template they can use once they have organized all the information.
Surveys
Organizations gather data through surveys from specific respondents. Surveys are usually useful to assess the likelihood of a target market to a particular service or product. As you already know, there are various types of surveys, and you must categorize them based on specific project goals.
Applications of the Affinity Diagram
Problem-Solving
You can create resolutions of concerns and issues within an organization using an affinity diagram template. Teams can organize the specific problems, their causes, possible solutions, and the process to achieve these solutions to solve the problem. The diagram can also list possible effects for every resolution. This way, teams can assess which answers are the most effective.
Project Planning
Ultimately, the affinity diagram is one of the planning and management tools. Companies usually rely on the chart to create a better direction before they launch the project. Some categories that are present in the diagram include target market, logistics, and marketing campaigns.
Process Improvement
As markets and technology evolve, an organization's processes will also change. With affinity diagrams, companies can assess whether their current processes are efficient enough; otherwise, they can figure out other methods to improve organizational processes. It looks like a problem-solving affinity diagram, but the focus is not so much on the existing problem.
Market Research
You can also use an affinity diagram to identify the preferences and needs of your company's target market. Market research is essential in keeping your company's competitiveness among other brands within your niche. Most importantly, you can also develop ways to reach more target markets as you go along.
Creating the Affinity Diagram
By using BoardMix's templates, you can create an Affinity Diagram that not only organizes complex information but also fosters collaboration and enhances communication within your team.
Building the diagram skeleton
While you can rely on a premade affinity diagram template for your skeleton, other organizations prefer to design their own. Whichever you choose, it will all boil down to making the draft as simple and as comprehensive as possible. You must consider the main categories and their hierarchy on the skeleton.
Placing Items into Categories
Since you have already organized similar items, you only need to place them under the exact categories. Most software today allows you to draw diagrams with your PCs and laptops and input the essential items for every box on your diagram. Ensure you will not leave any data behind, which can also affect the final diagram output.
Refining the Diagram
Besides looking into the overall look of the affinity diagram template, it pays to review the issues you have made in the diagram. This ensures that the data placed in the diagram gears toward the group's primary goal. Otherwise, you can make the necessary changes before the final approval.
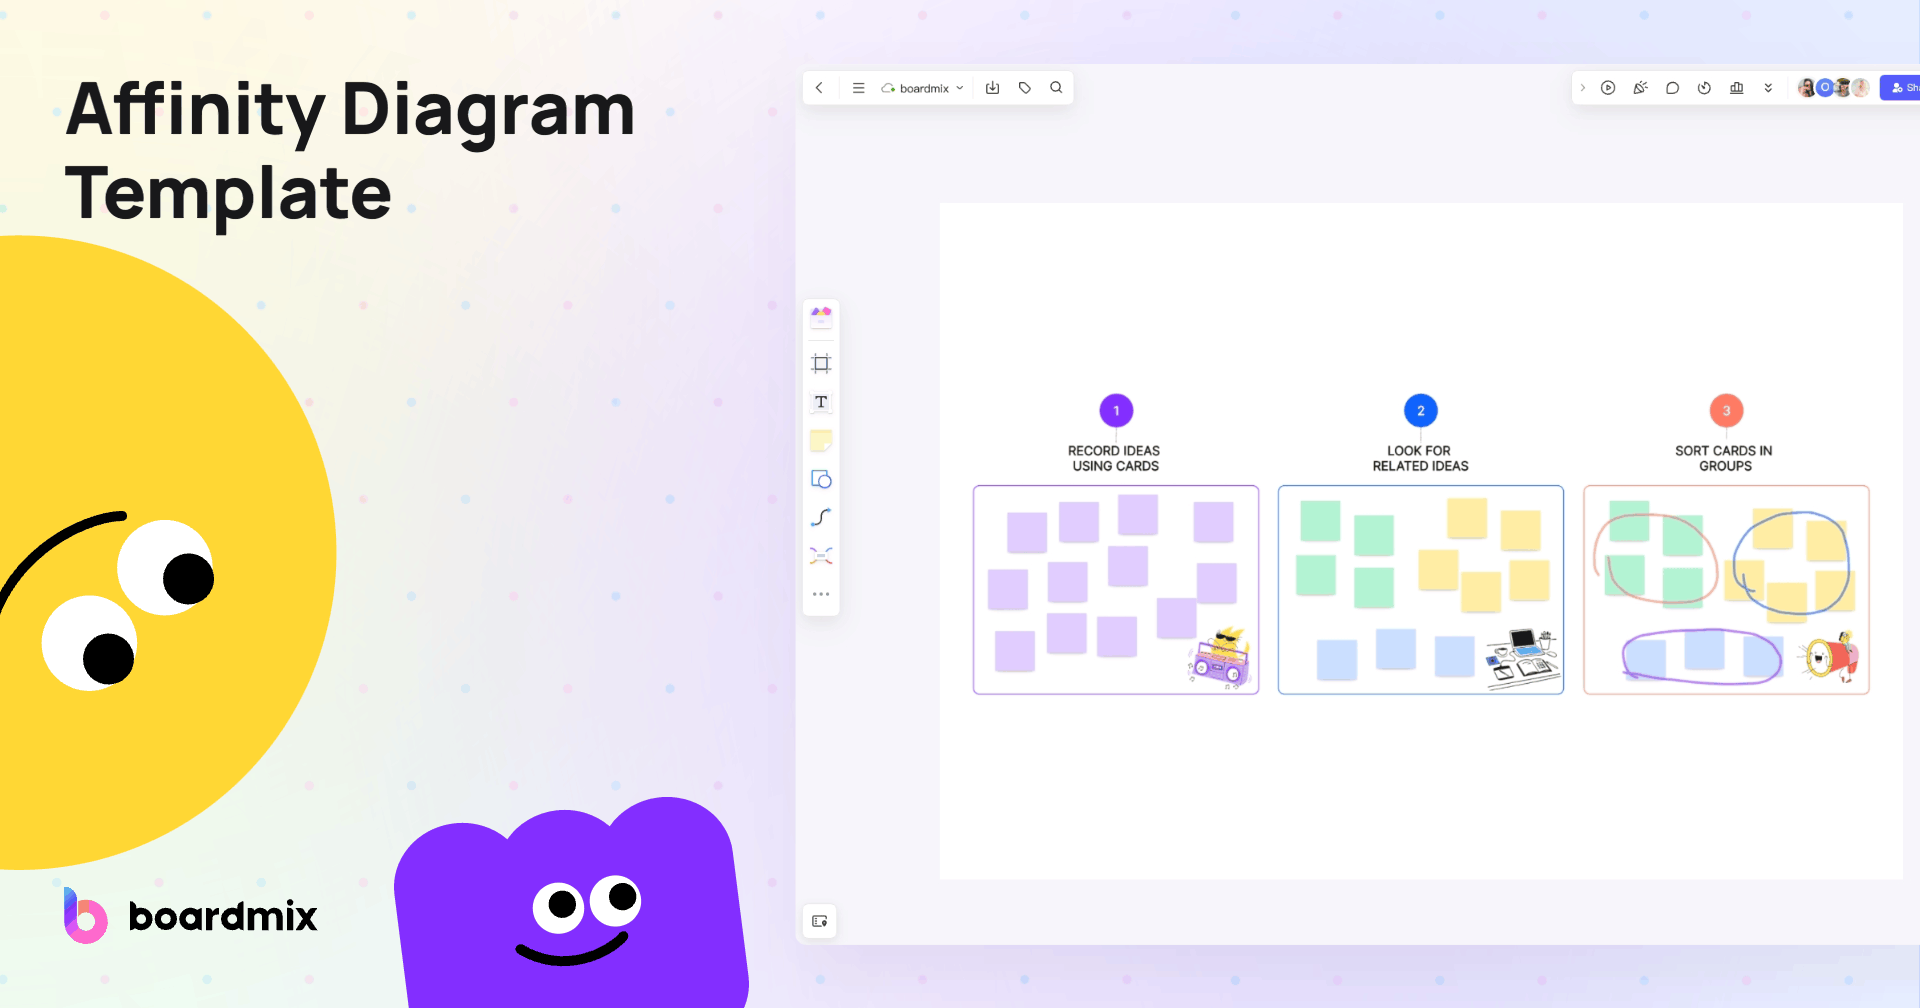
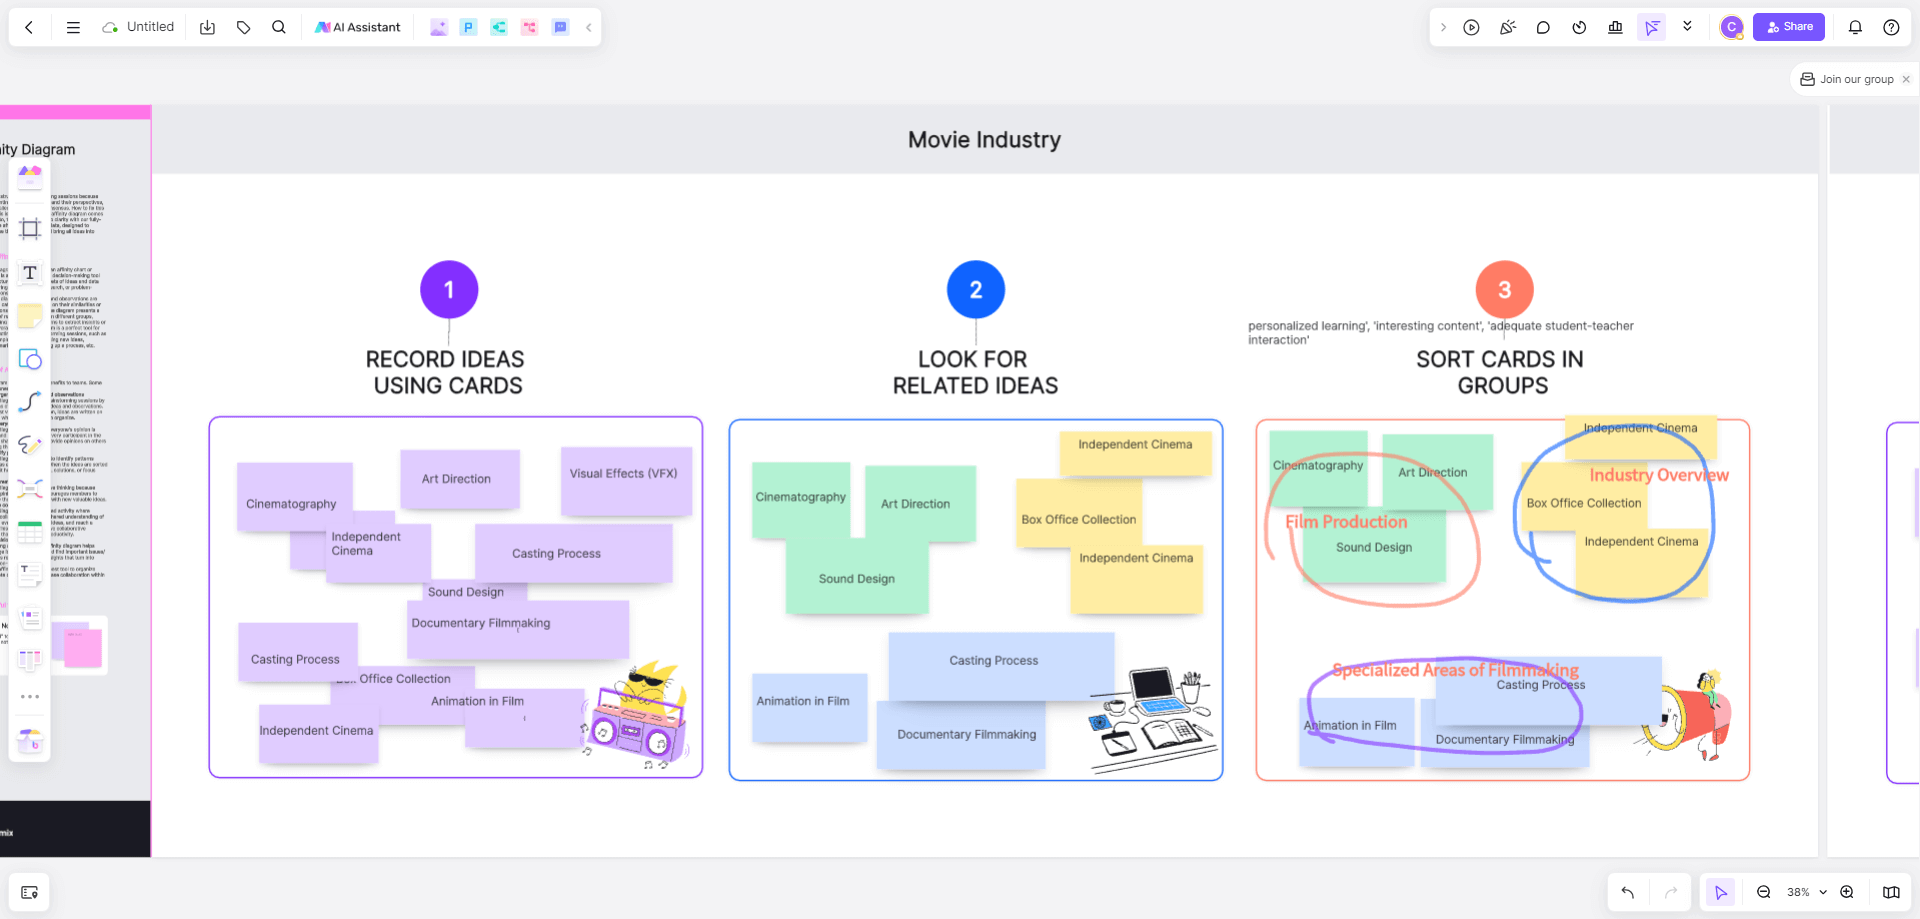
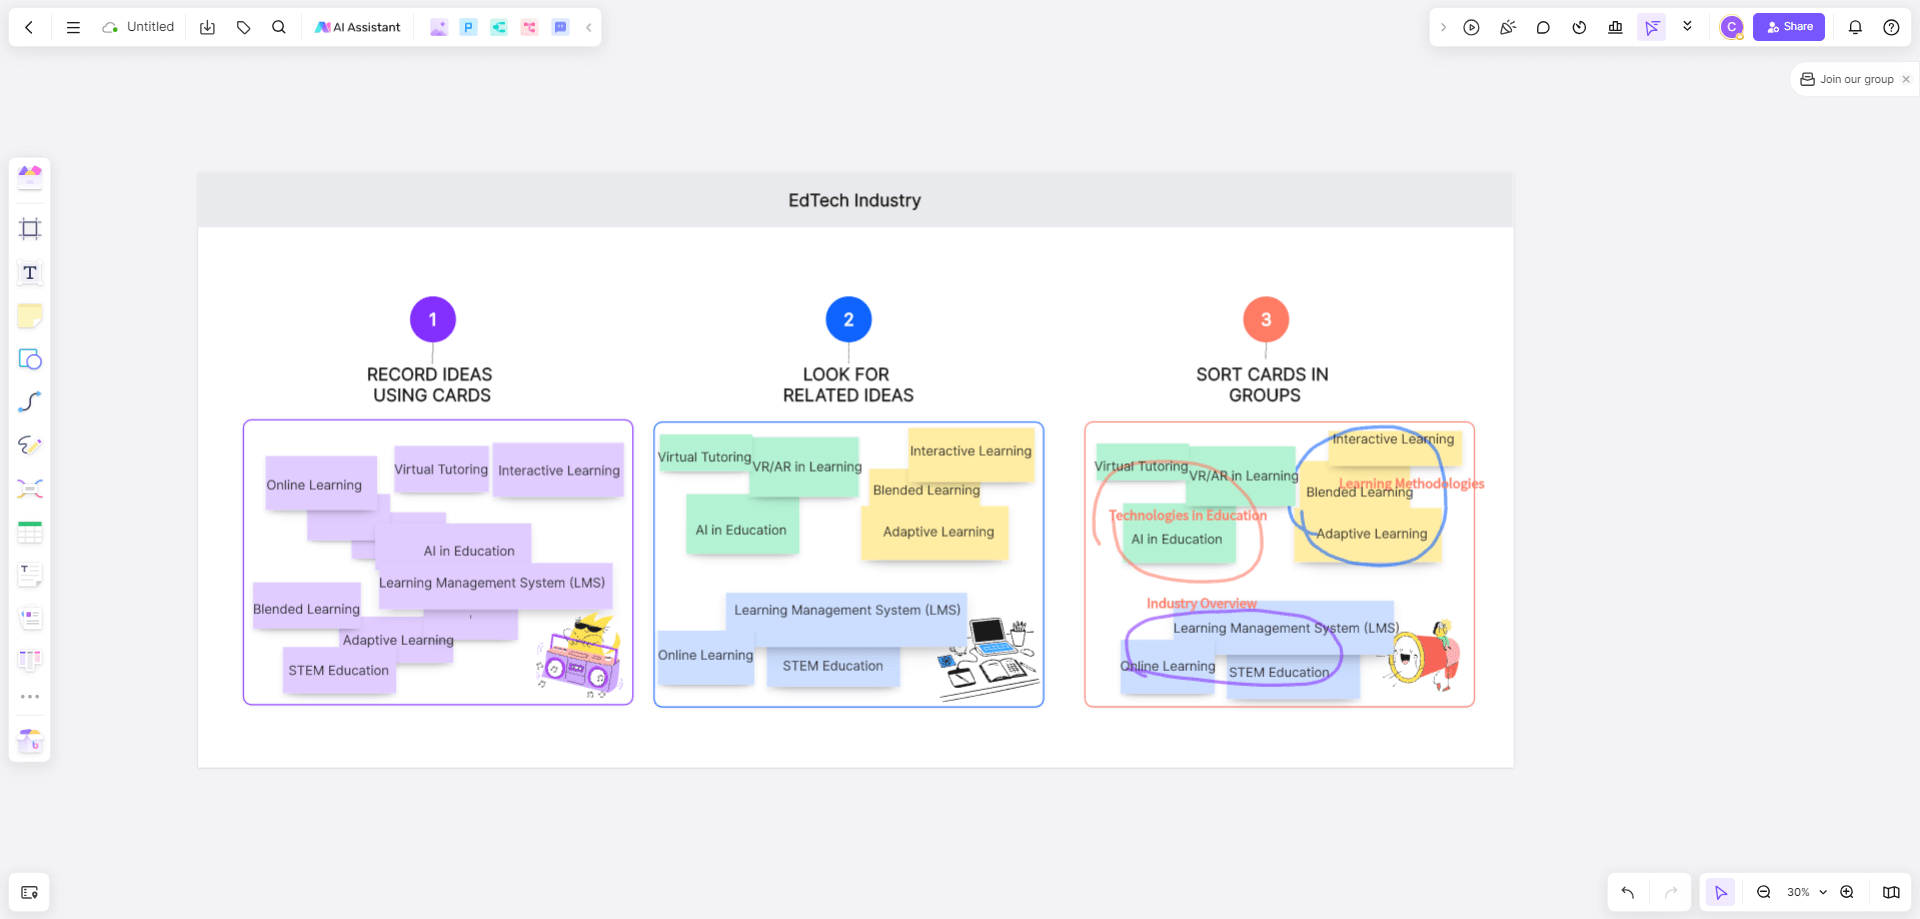
Step-by-Step Guide: Creating Your Affinity Diagram with Boardmix
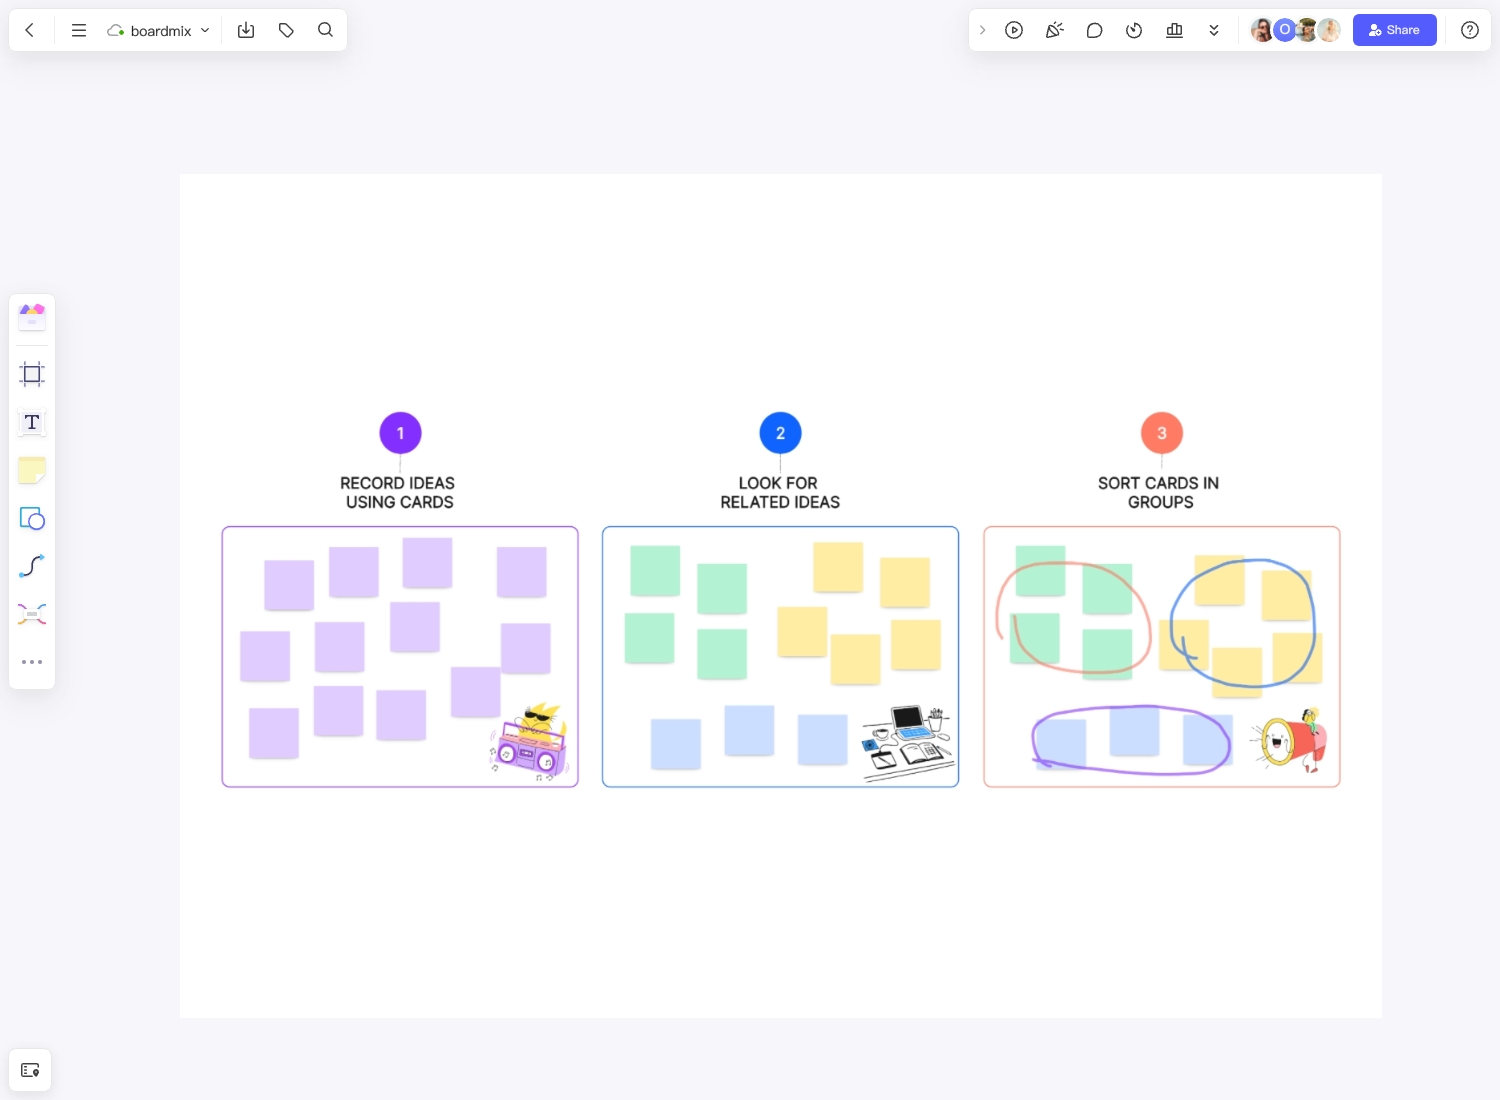
Creating an Affinity Diagram is an essential part of user experience design. It is a tool that organizes user research data into a digestible format. One popular platform for creating such diagrams is Boardmix. Here's a step-by-step guide to creating your Affinity Diagram using Boardmix.
Create Notes for Each Piece
On Boardmix, each piece of your data will be represented by a 'note'. Make sure each note contains a concise summary of a specific piece of data or insight from your research.
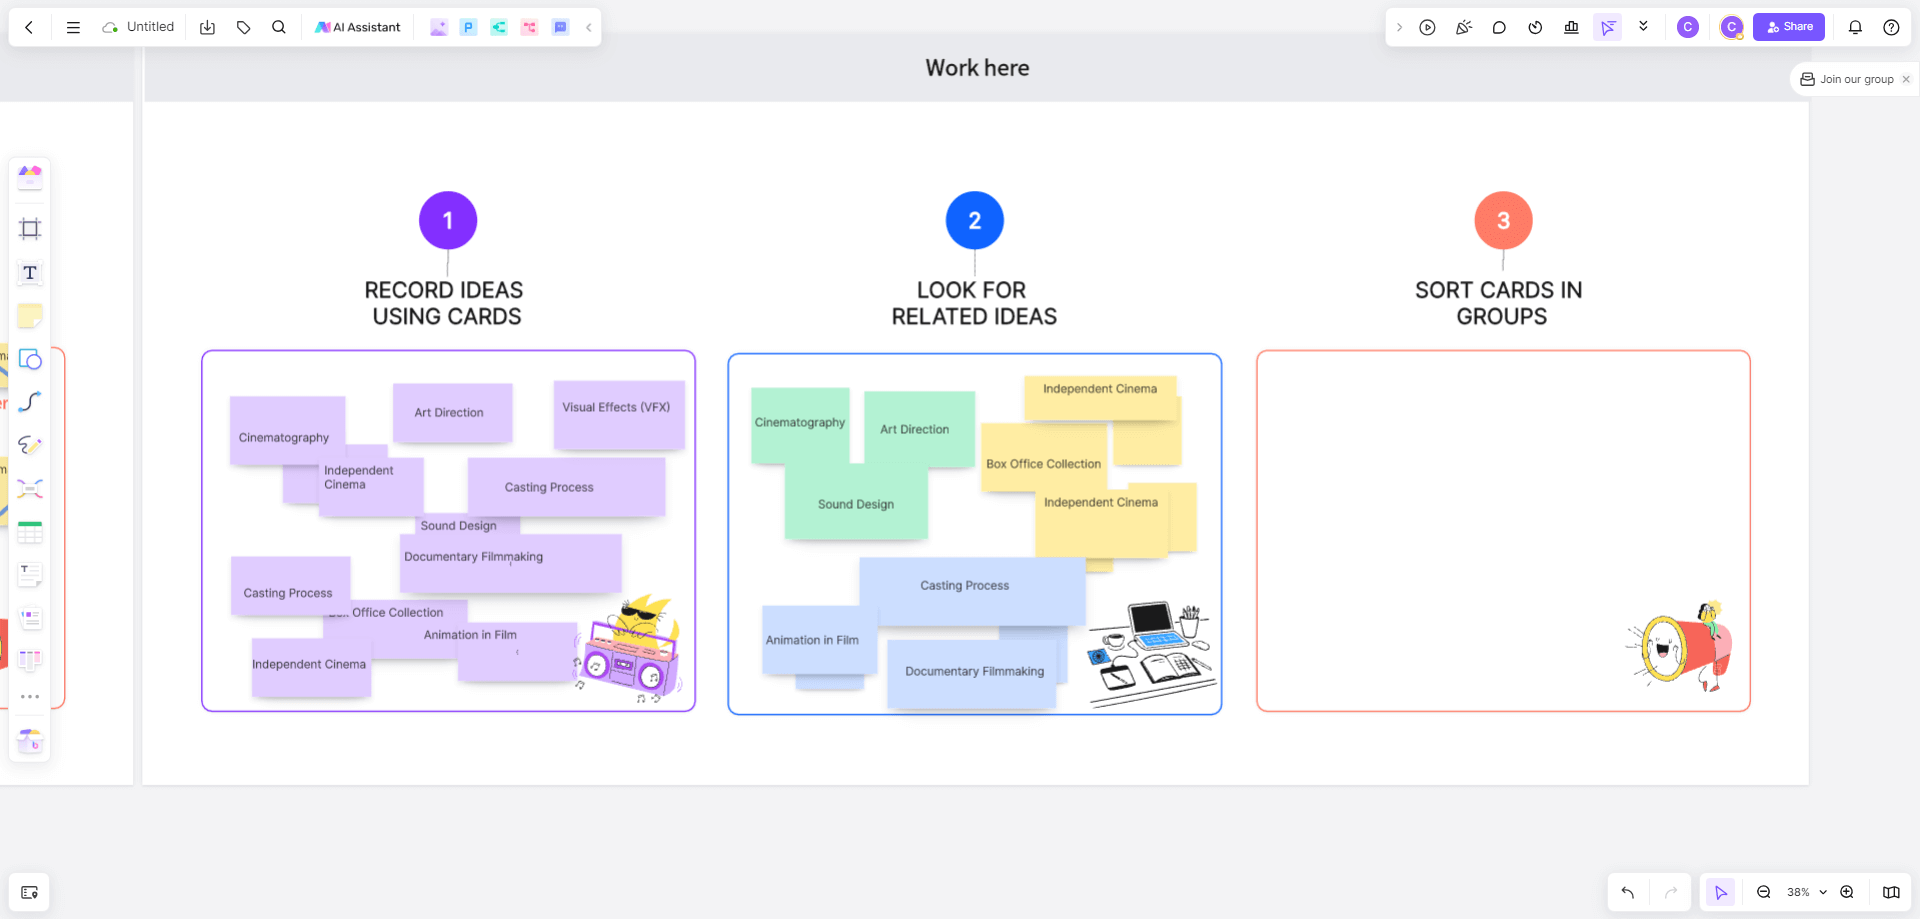
Organize Notes into Groups and Name Each Group
The core of creating an Affinity Diagram involves organizing the notes into meaningful groups. Start by moving similar notes close to each other. As patterns emerge, group related notes together. This process can be done manually or with the help of the 'auto-group' feature on Boardmix.
Once you have created groups, name each group in a way that captures the essence of the data it contains. This will serve as the theme for that group and help users understand what kind of insights the group holds.
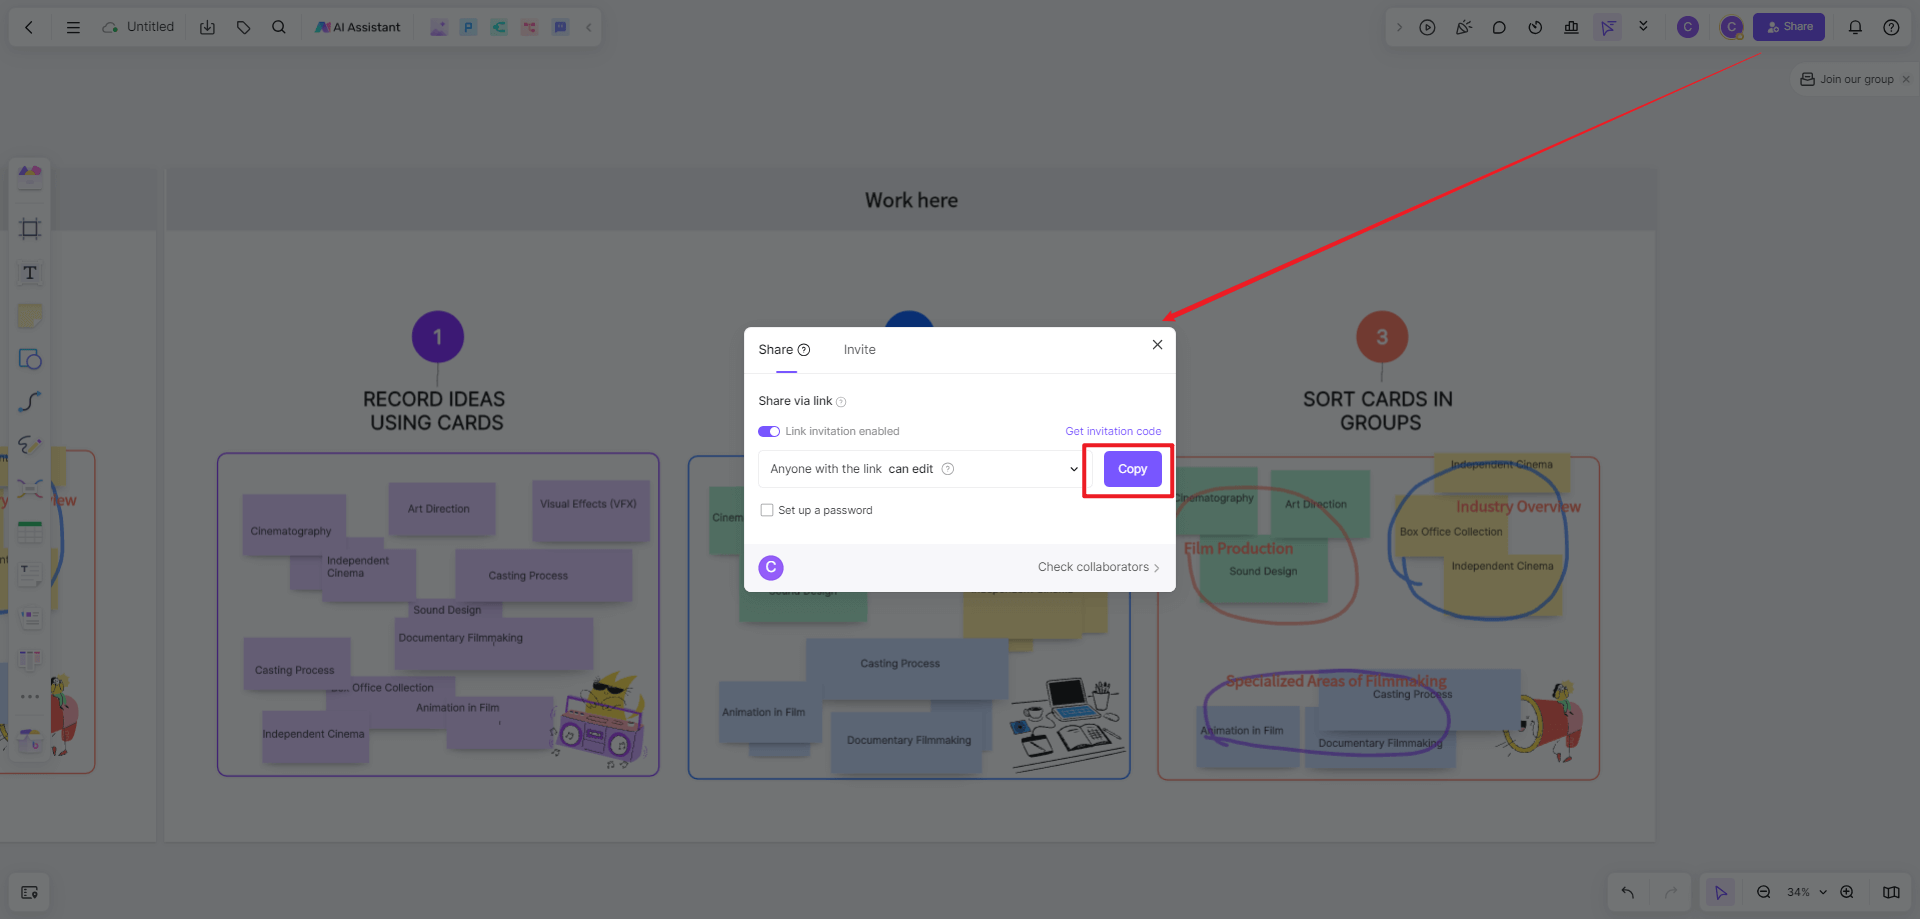
Review, Refine, and Share Your Affinity Diagram
After all groups are named, take some time to review and refine your diagram. This may involve reorganizing some notes, regrouping them, or renaming the groups for clarity. Once you are satisfied with your Affinity Diagram, you can share it with your team directly from Boardmix. The platform offers multiple sharing options including sharing via email, generating a shareable link, or exporting it as an image or PDF.
Creating an Affinity Diagram on Boardmix not only organizes user research data but also enhances team collaboration in understanding user needs and creating effective solutions.