The RICE prioritization framework helps a product team compare feature ideas with the same set of questions: how many people will experience the change, how much will it affect them, how confident are we in the estimate, and how much Effort will it take? The score is a conversation aid, not a forecast. Use it to expose assumptions and decide what to validate next.
If you are organizing a broader backlog, start with project priority management and then use RICE for the short list that needs a more explicit comparison.

What the RICE framework measures
RICE has four inputs. Define the unit and time window before you score anything, then use the same definitions for every row.
| Input | Question | A useful definition |
|---|---|---|
| Reach | How many people or accounts will experience the change? | Count a defined audience during a stated period, such as active accounts in one quarter. |
| Impact | How much difference will it make for each reached person? | Use a small, team-defined scale and explain what each level means. |
| Confidence | How strong is the evidence for Reach and Impact? | Record a percentage or band as an uncertainty judgment, not as a measurement. |
| Effort | How much team capacity will the work consume? | Use one unit consistently, such as person-weeks or team-weeks. |
The usual calculation is (Reach × Impact × Confidence) ÷ Effort. If Confidence is written as 80%, use 0.8 in the calculation. The exact Impact scale is a local agreement; do not copy a scale without defining it.
Intercom’s original RICE method uses person-months for effort. This example uses team-weeks for one team with fixed staffing; do not compare these scores with a table that uses a different effort unit.
A worked RICE example
Imagine a small SaaS team considering three improvements for the next quarter. This is an illustrative example, not a prediction about any product. The team defines Reach as active accounts in the quarter, Impact as 0.25 for minimal, 0.5 for low, 1 for medium, 2 for high, and 3 for massive, and Effort as team-weeks.
| Idea | Reach | Impact | Confidence | Effort | RICE score |
|---|---|---|---|---|---|
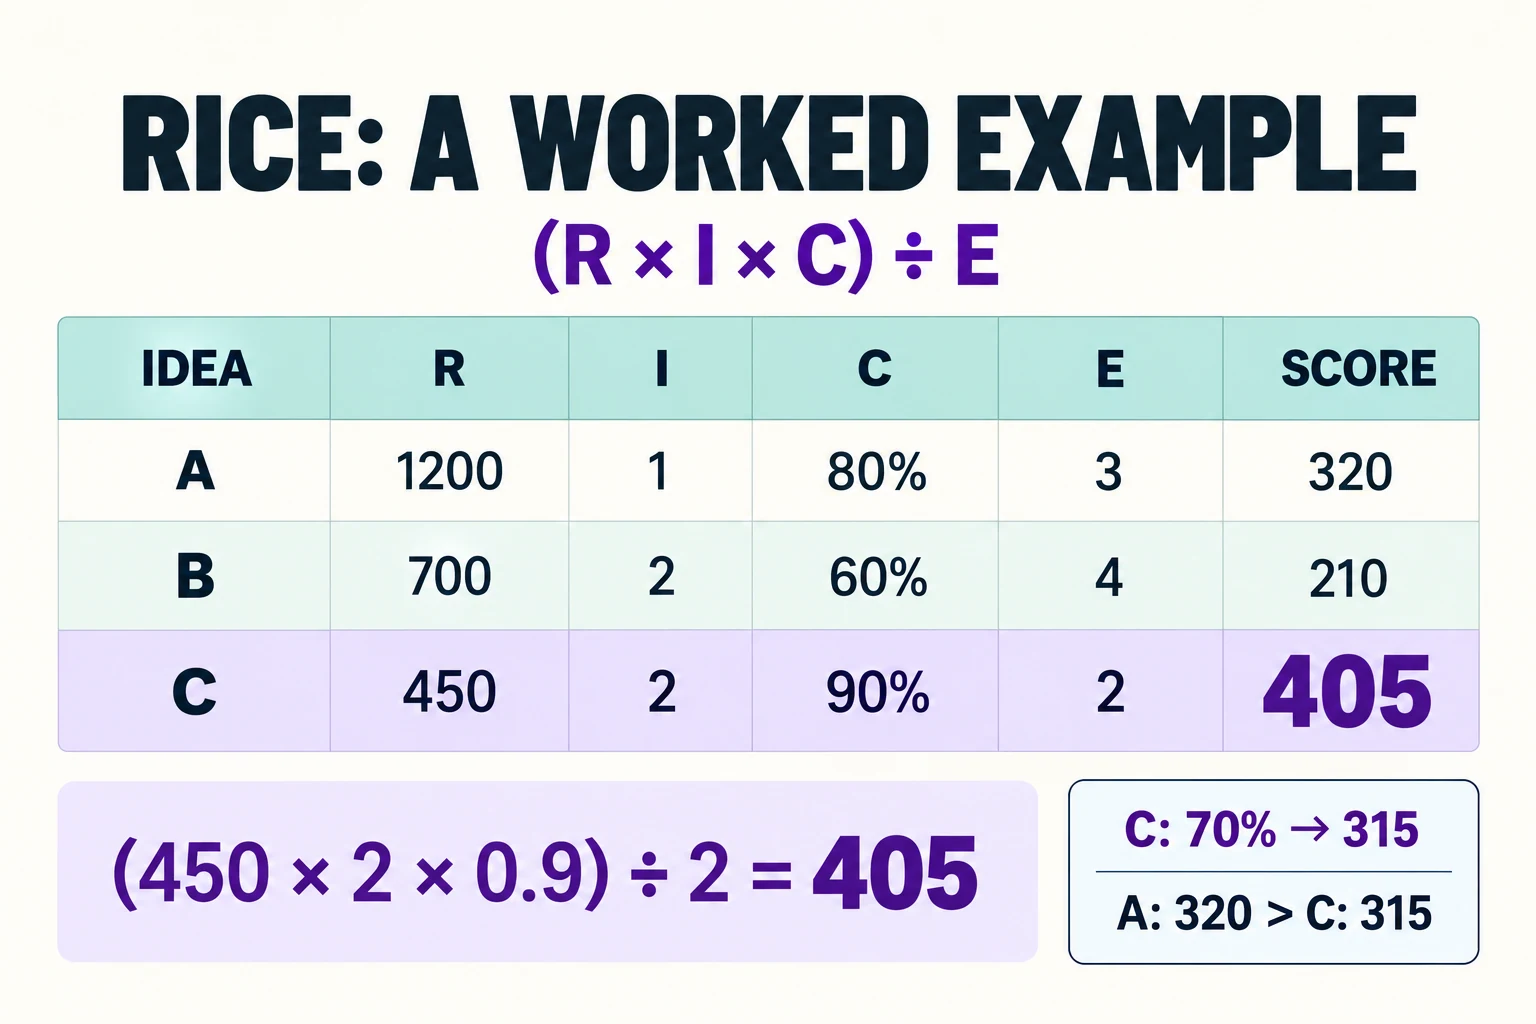
| Saved board views | 1,200 | 1 | 0.8 | 3 | 320 |
| Faster guest access | 700 | 2 | 0.6 | 4 | 210 |
| Export quality improvements | 450 | 2 | 0.9 | 2 | 405 |
For “Export quality improvements,” the arithmetic is (450 × 2 × 0.9) ÷ 2 = 405. The high score does not prove that it is the right work. It tells the team why the idea deserves a closer look: a defined audience, a meaningful problem, relatively strong evidence, and a smaller estimated effort. The team should still check feasibility, dependencies, accessibility, and the consequences for current commitments.
Test the ranking before committing. If confidence in the export estimate falls from 0.9 to 0.7, its score becomes (450 × 2 × 0.7) ÷ 2 = 315, below saved board views at 320. The useful next step is to check the export evidence; the apparent lead is sensitive to that estimate.
Make assumptions visible
A score becomes misleading when an estimate looks like a fact. Add an evidence and assumption column beside the four inputs. Write “support tickets from the last review period” instead of “users want it,” and write “engineering estimate after a technical spike” instead of “two weeks” when that is what the number represents.
Confidence is useful when it changes the next action. A high-impact idea with low confidence may need a short interview round, prototype, log review, or technical spike before it is scheduled. Do not raise a score simply because a stakeholder is enthusiastic. Lower confidence is information about what remains unknown.
Keep unlike units out of one calculation. Do not mix monthly users with quarterly accounts, individual hours with team-weeks, or an impact scale that changes halfway through the table. If two teams need different definitions, keep separate tables and explain why their scores cannot be ranked directly.
Copyable RICE table
| Idea | Reach and period | Impact definition | Confidence and evidence | Effort unit | Next validation | RICE score |
|---|---|---|---|---|---|---|
| Idea A | — | — | — | — | — | — |
| Idea B | — | — | — | — | — | — |
| Idea C | — | — | — | — | — | — |
Record the scoring date and the people who supplied the estimates. When new information changes an input, recalculate the affected row and compare the order again.
Use a shared board to discuss the score
On a Boardmix board, place the three ideas in rows and add the Reach, Impact, Confidence, Effort, and Score columns. Put the supporting note beside each estimate. Keep a separate shortlist so the team can distinguish the numerical order from its chosen delivery order.
Open a Boardmix board when the team is ready to compare a real shortlist. Use the score to make a decision easier to explain, not to hide the judgment that still belongs to the team.