During team meetings and discussions, organizing ideas and observations from different members is often challenging. However, it is important to identify the areas of overlap or divergence between ideas for effective decision-making. This is exactly where the Venn diagram comes into action. This template provides a fully customized Venn diagram layout that you can use to understand and find similarities and differences between different observations and data sets.
What Is Venn Diagram?
A Venn diagram is a visual representation of similarities and differences between ideas and data sets using overlapping circles. Each circle in a Venn diagram represents a separate term, and the overlapping regions are the areas where they resemble or show similarities. Therefore, Venn diagrams are widely used to show how different data sets overlap to identify patterns and extract relationships.
Venn diagrams were first popularized by English logician John Venn in the late 19th century. Also known as set or logic diagrams, today Venn diagrams are used in a variety of fields, such as computer science, statistics, and mathematics. Moreover, since the Venn diagram is easy to create and provides the simplest way to visualize ideas, it is used in plenty of other contexts, such as brainstorming, problem-solving, project management, marketing, etc.
When to Use Venn Diagrams?
Venn diagrams are the perfect graphical tool to organize data sets into visually appealing and digestible forms. Owing to that, Venn diagrams can be used in a wide range of applications. Talking specifically about the business context, some of the common use cases of Venn diagrams are as follows:
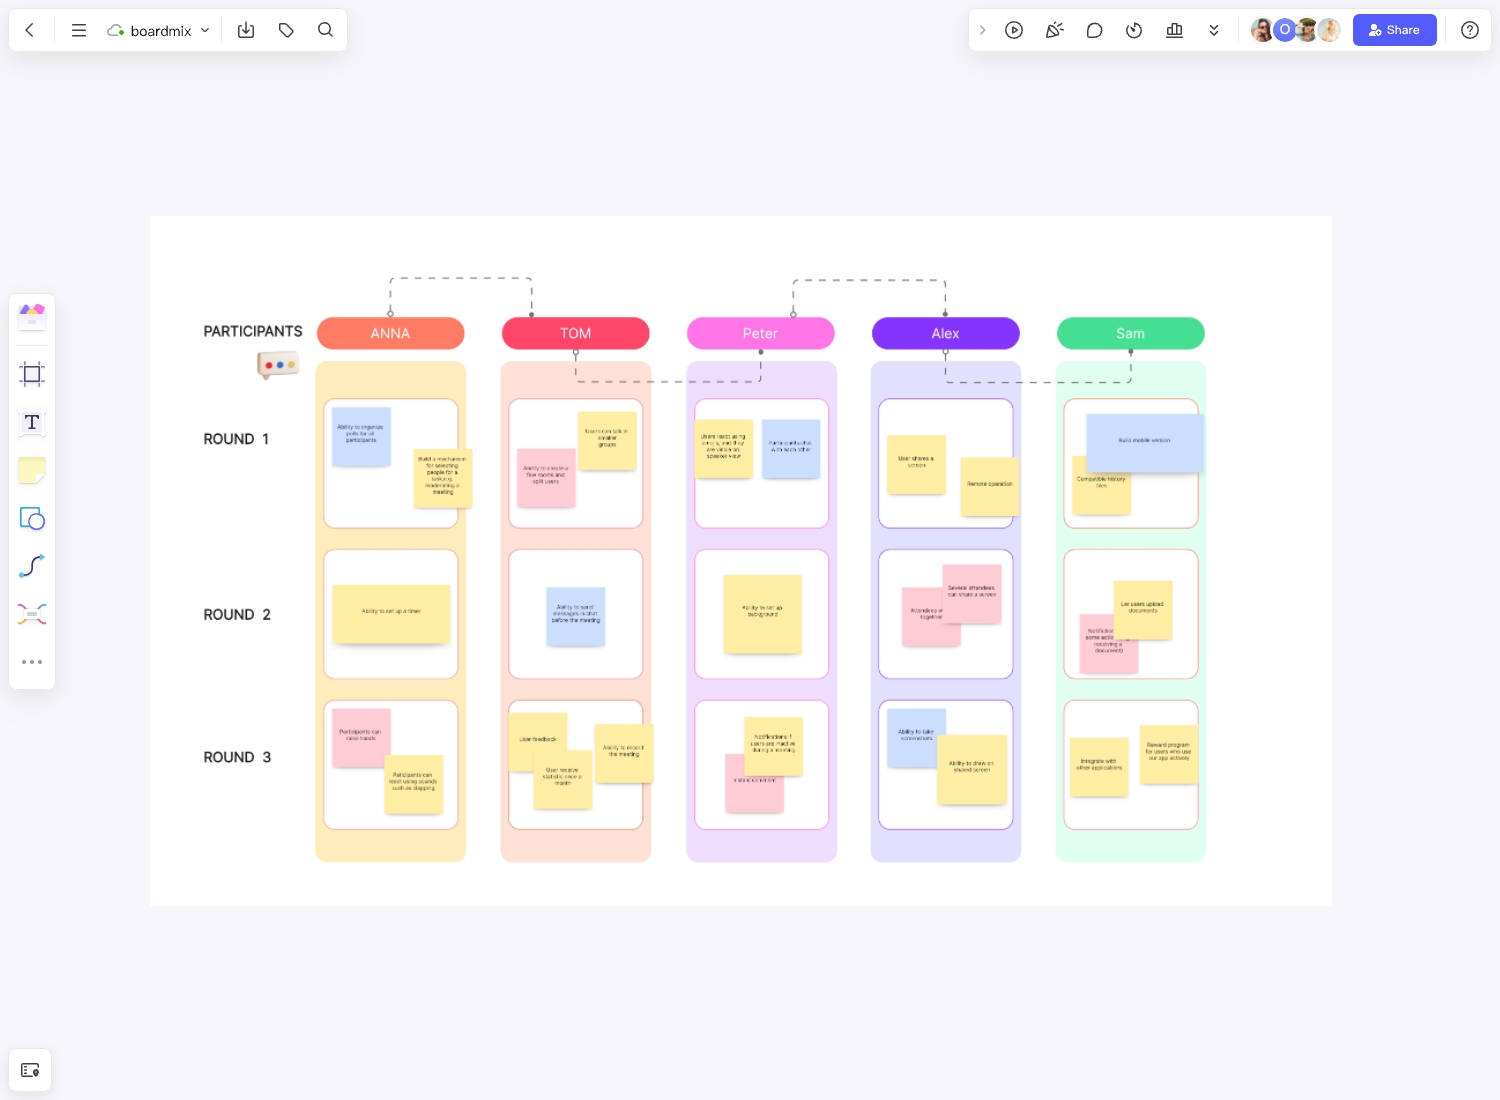
- Decision Making: Venn diagrams can be used to assist teams in the decision-making process. During meetings, Venn diagrams can be used to organize ideas and observations and then make more informed decisions by looking at the overlapping and distinguishing areas.
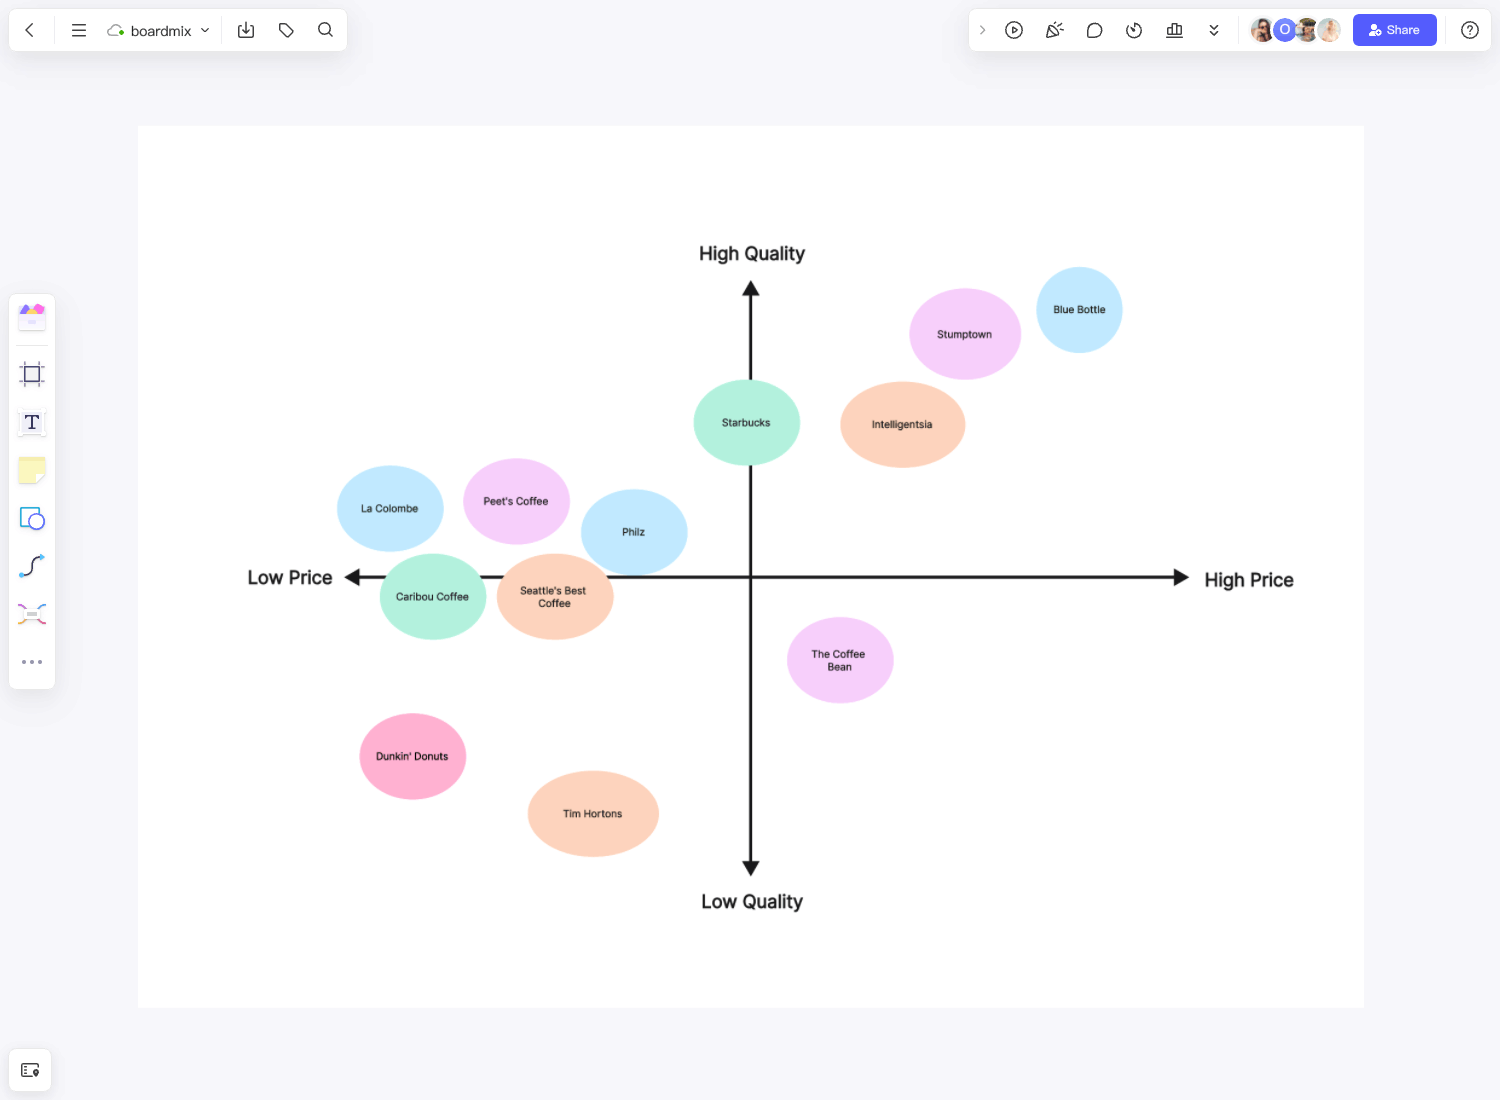
- Product Analysis: Venn diagrams can be used to compare different products and pinpoint the areas to improve or find innovation opportunities.
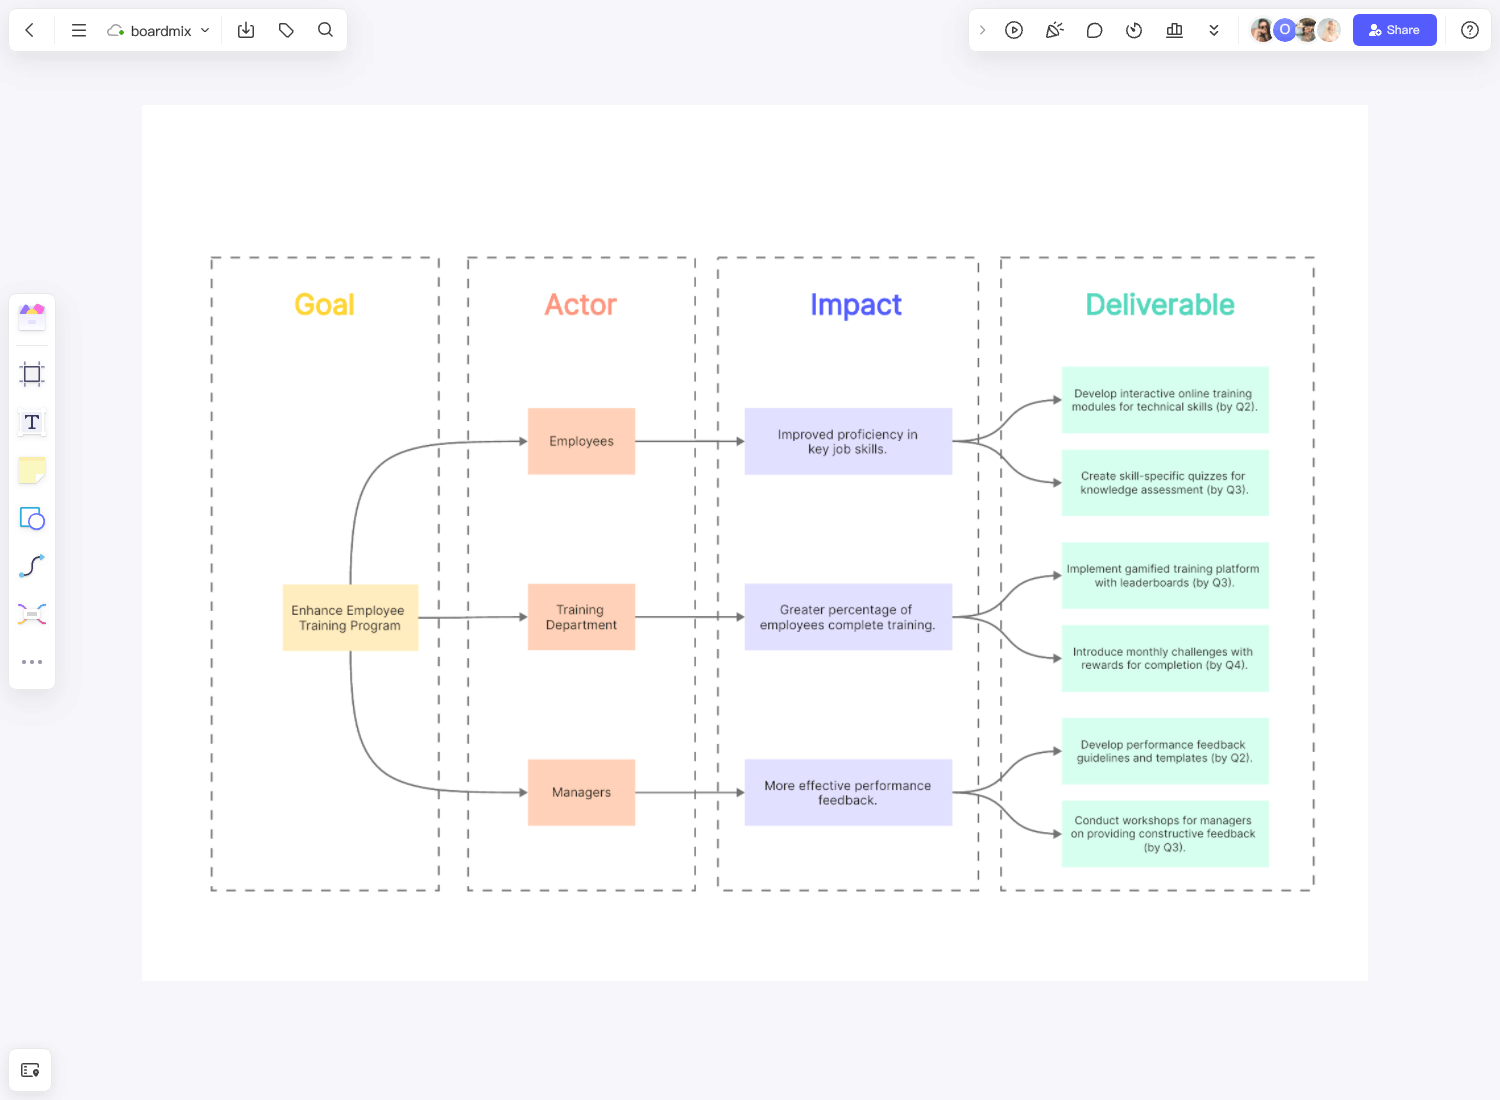
- Project Management: Venn diagrams can be used in project management to find dependencies between tasks and similar other attributes.
- Marketing: Venn diagrams can be used to graphically visualize different marketing aspects, such as purchasing behavior, traffic flow, geographic location of customers, and other elements for setting effective marketing campaigns.
- Competitive Analysis: Venn diagrams can be used to compare competitors and look into their strengths and weaknesses to identify opportunities.
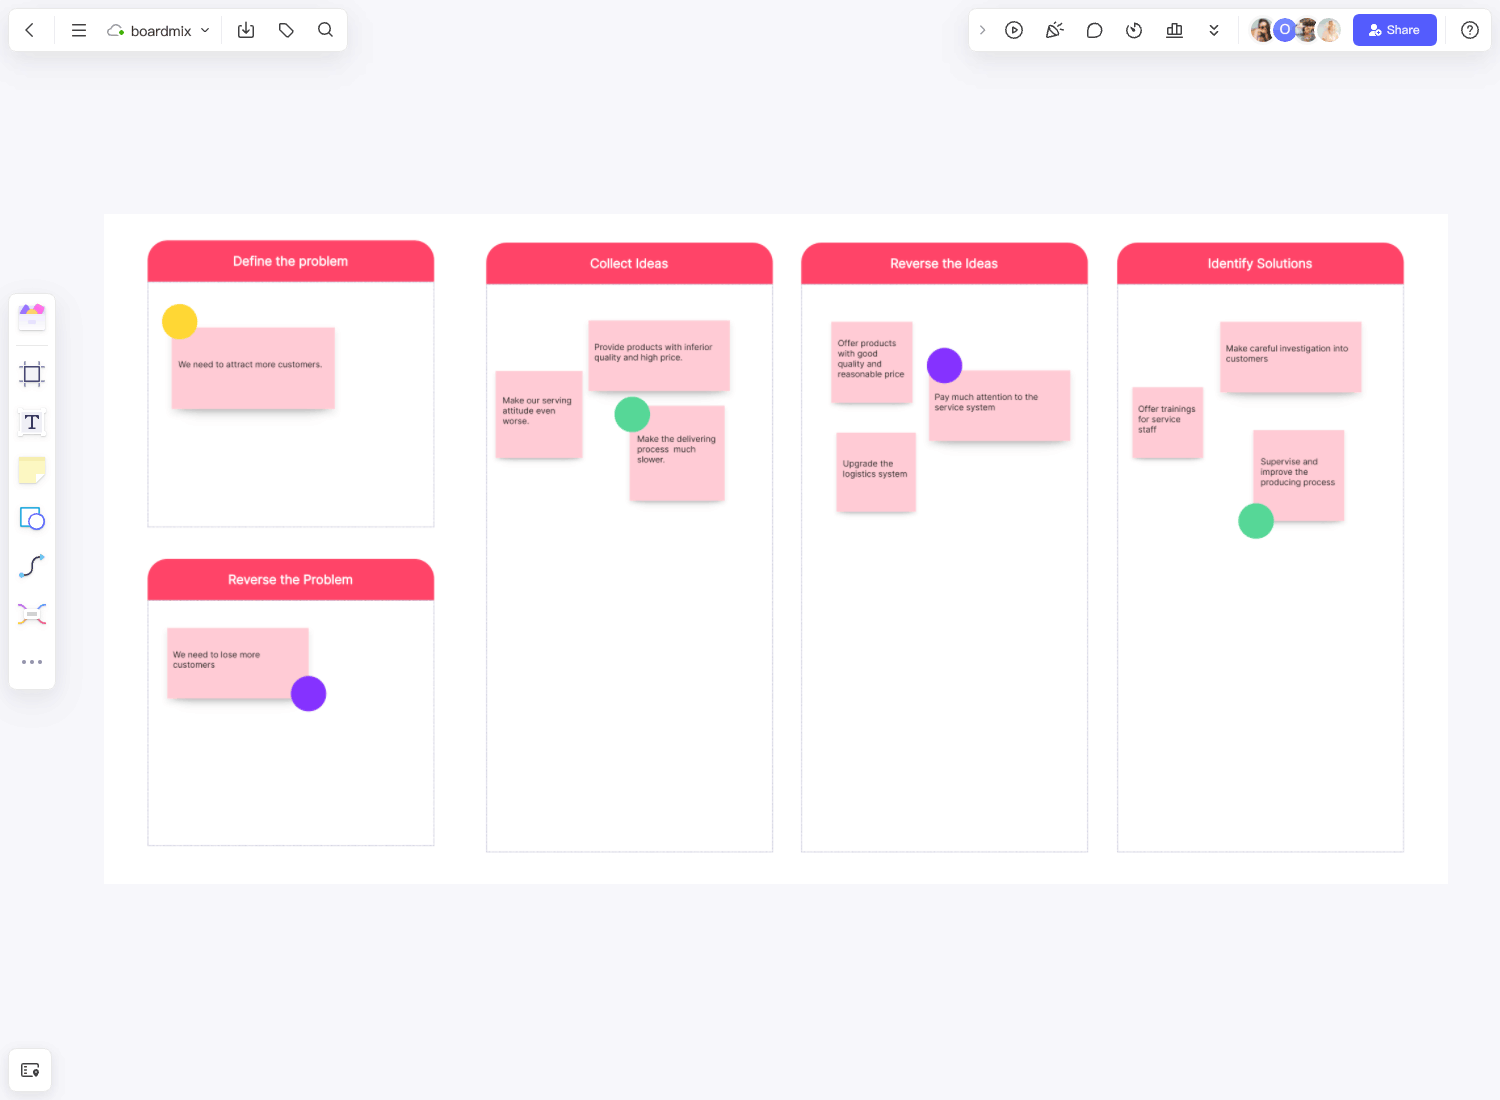
- Optimize Processes: Venn diagrams can be used to map processes, like a sales process or customer journey process. This helps to find gaps and improvement areas to optimize workflows.
- Presentation: Venn diagrams help present complex concepts or workflows to stakeholders or other groups for easy understanding.
In short, Venn diagrams find plenty of applications and help businesses visualize overlaps and differences to make data-driven decisions.
Benefits of Using Venn Diagrams
There are plenty of benefits of using Venn diagrams. Some of the key ones are as follows:
Clear Information Presentation
Venn diagram is an excellent visualization tool to present simple to complex information in a clear graphical form with detailed visualization of similarities and differences.
Easy to Understand
Venn diagram makes it easy to understand and interpret data or ideas through visual representation.
Better Decision-Making
Venn diagram presents all the relations between the data sets in a central place. This helps in better decision-making.
Improve Communication
Venn diagram makes it easy to communicate concepts to team members and stakeholders.
Resolve Conflicts
If there are conflicting opinions between team members, a Venn diagram can be used to record all those opinions and then find similarities and differences, eventually helping to resolve conflicts.
Practical Examples of a Venn Diagram in Different Fields
From mathematics to business strategy, from computer science to social studies, this simple yet powerful tool has found its way into various domains. So, are you ready to explore the fascinating world of Venn Diagrams through these practical examples? Let's dive in!
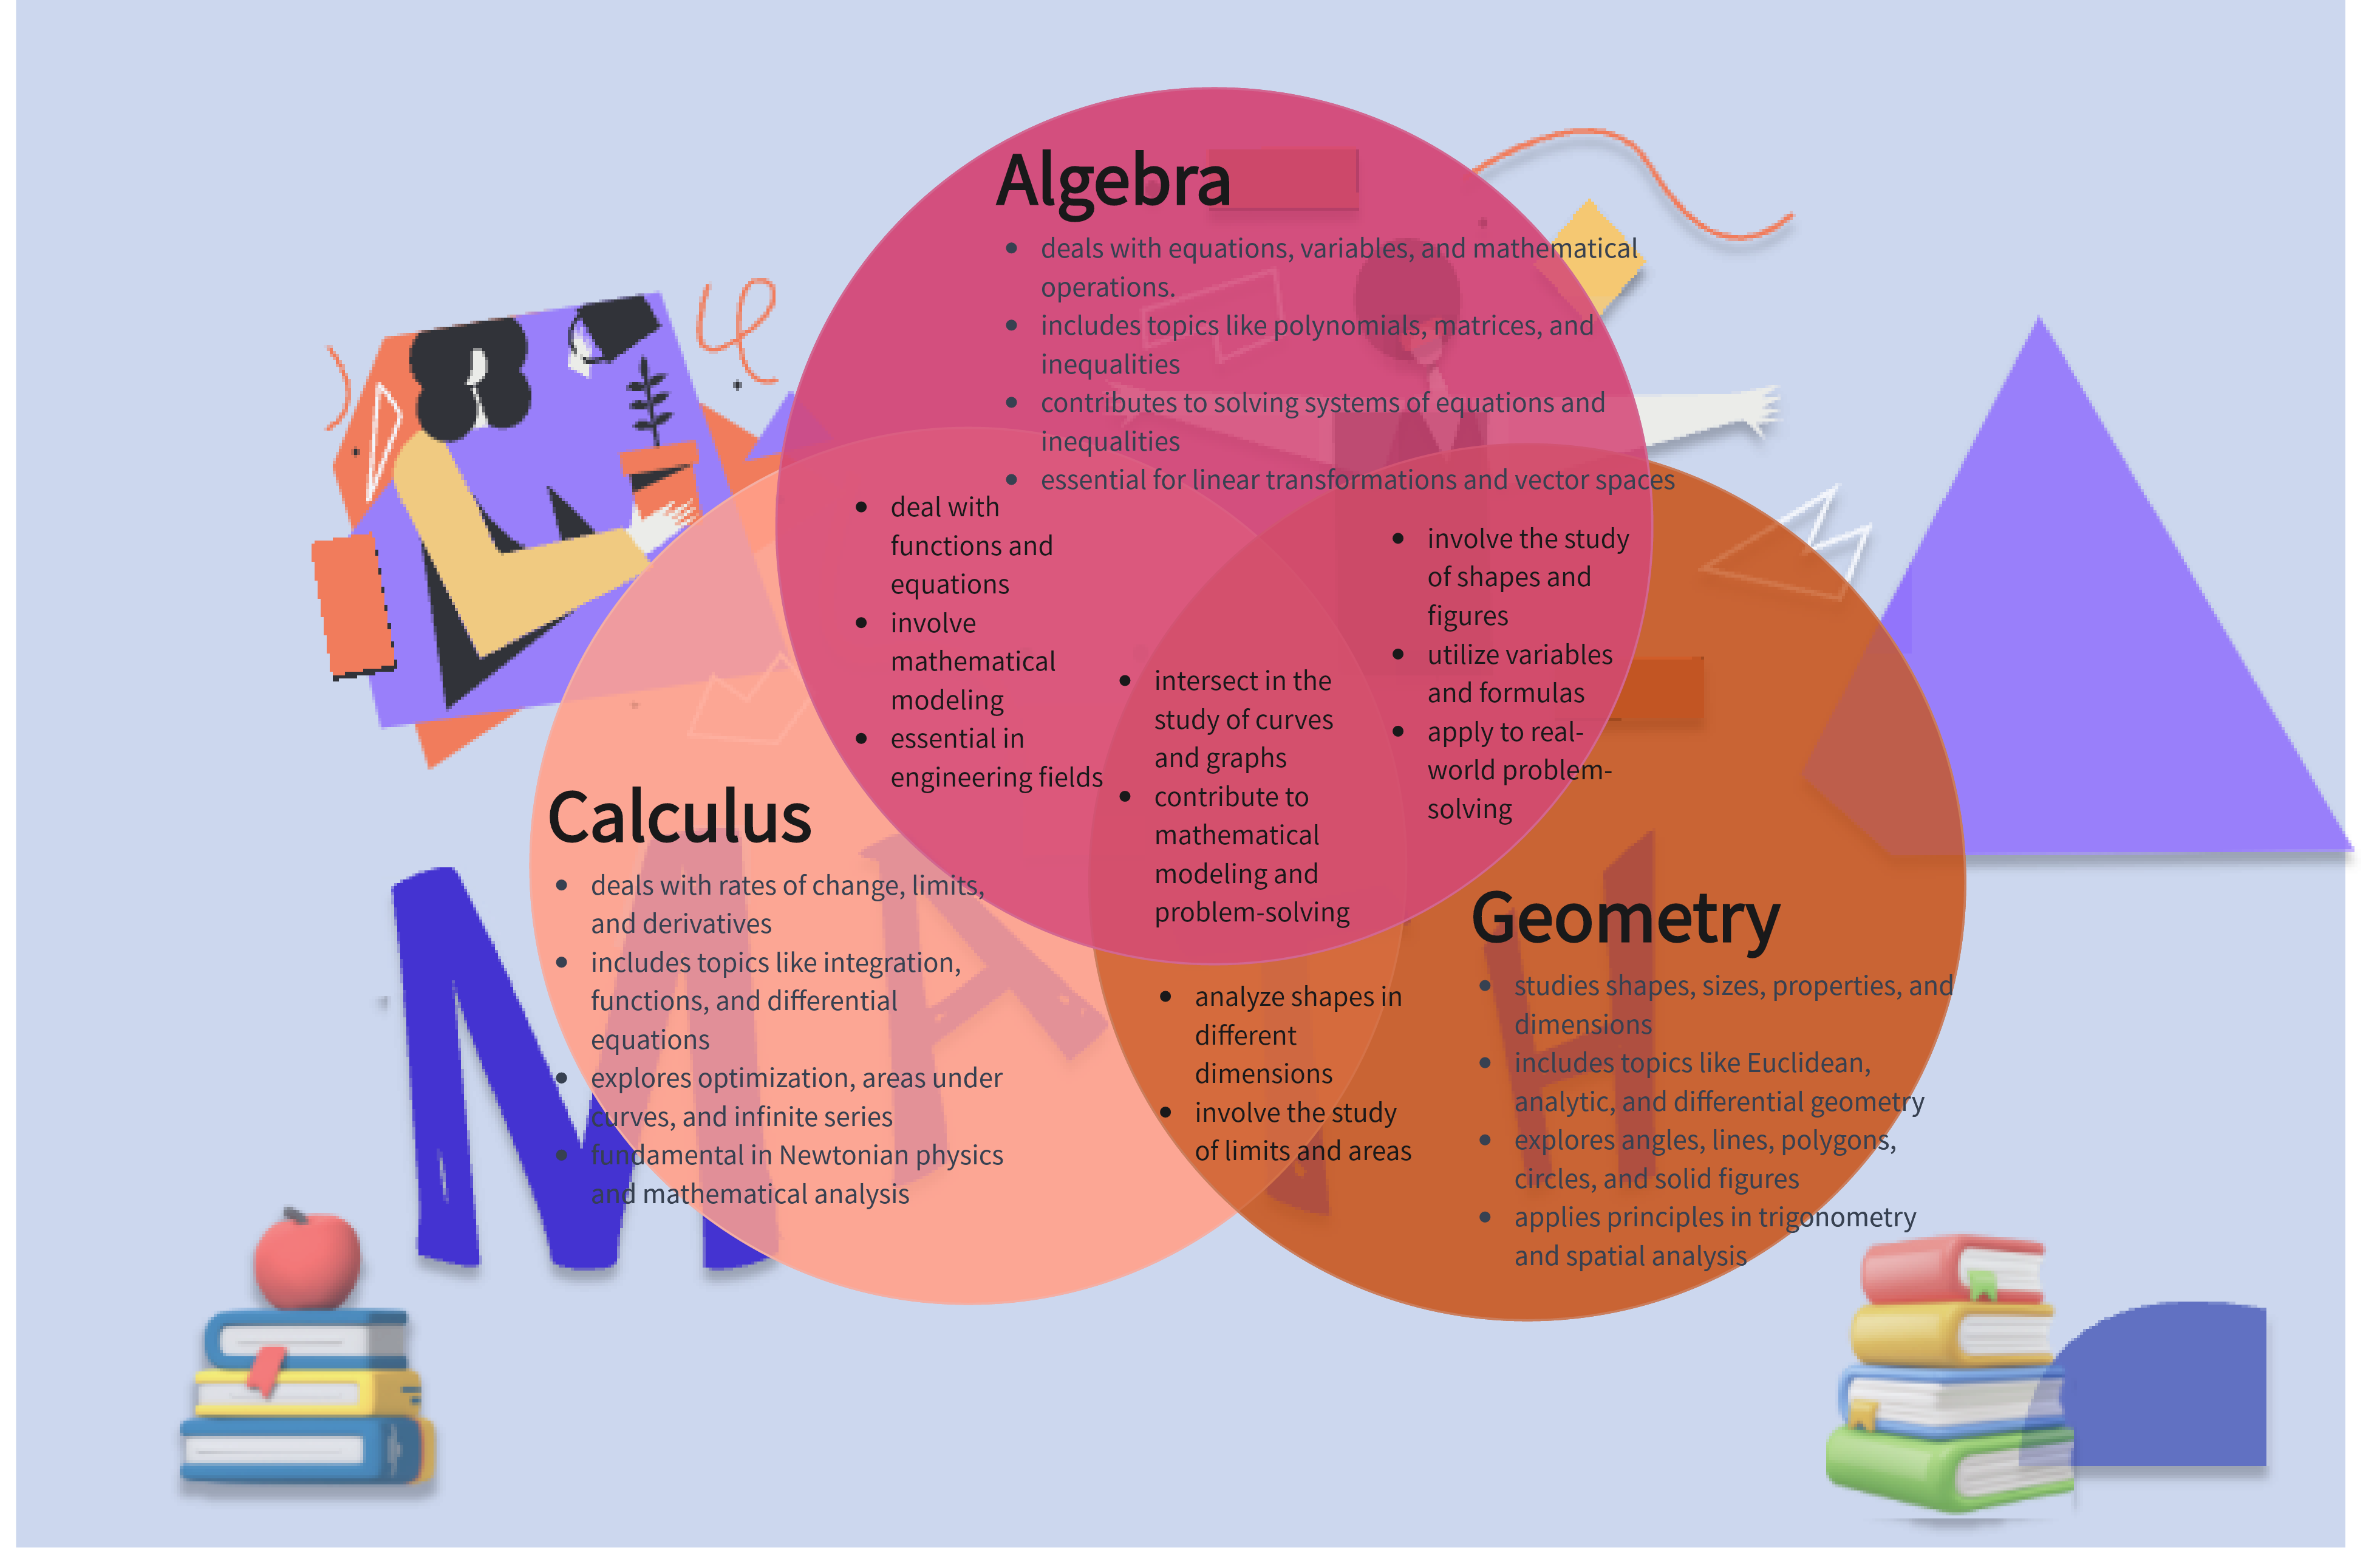
Example of a Venn Diagram in Math
In mathematics, a Venn diagram is a graphical representation of the relationships between sets. It is commonly used to illustrate the logical relationships between different sets, demonstrating the intersections and differences between them. They provide a visual and intuitive way to understand set theory concepts, including union, intersection, and complement.
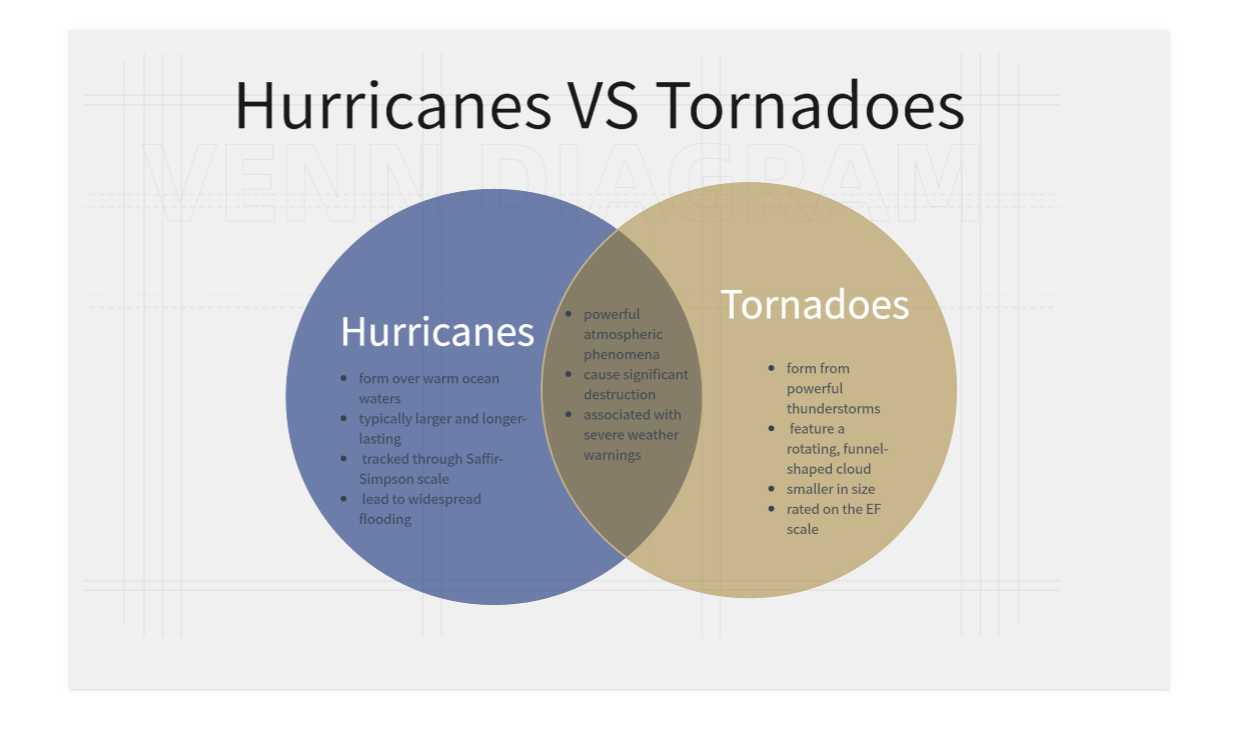
Example of Venn Diagram in Weather
A Venn diagram is a graphical representation commonly used in weather analysis to illustrate the relationships and commonalities between different weather phenomena or variables. Venn diagrams in weather analysis help communicate how various meteorological elements coincide or influence each other in specific weather conditions.
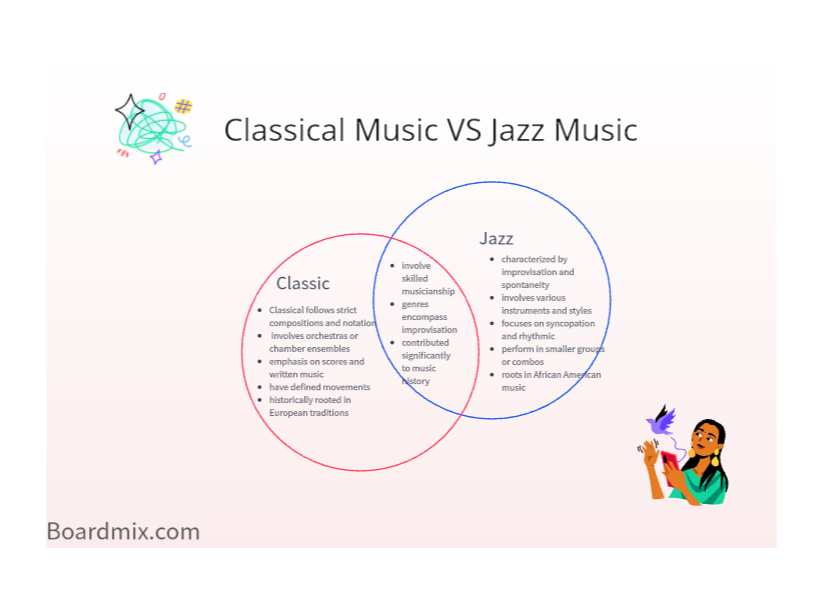
Example of Venn Diagram in Music
In the context of music, a Venn diagram is a visual representation that illustrates the relationships and commonalities between different musical elements, genres, or styles. It uses overlapping circles to show the intersection of these elements, highlighting areas of similarity or influence.
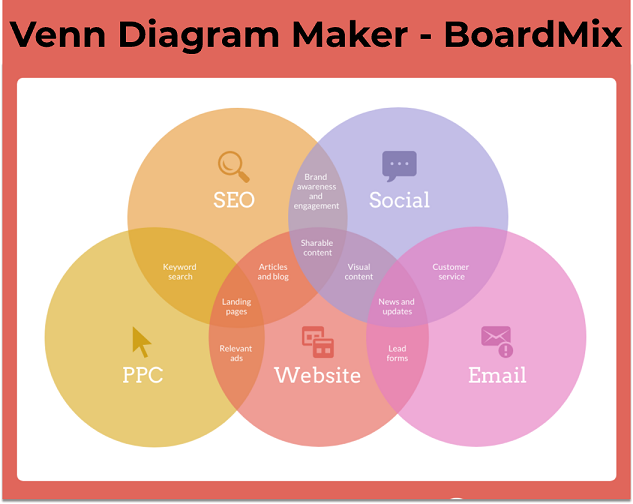
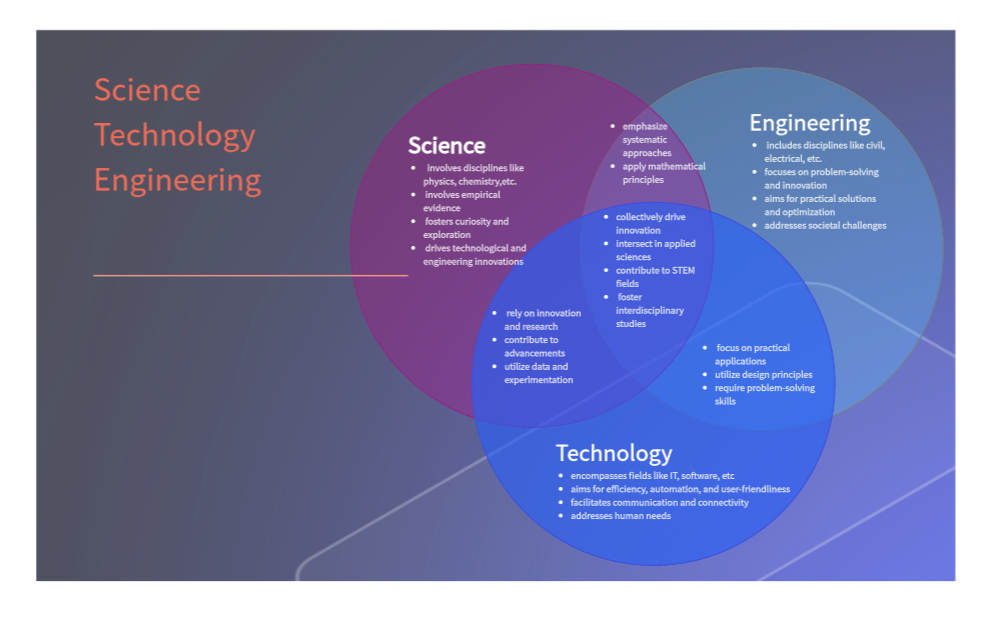
Example of Venn Diagram in Technology
In technology, a Venn diagram is a graphical representation that uses circles to illustrate the relationships and commonalities between different sets or categories. It visually demonstrates the overlap and distinctions among various elements, helping to analyze data, identify patterns, and showcase intersections between different technological components or concepts.
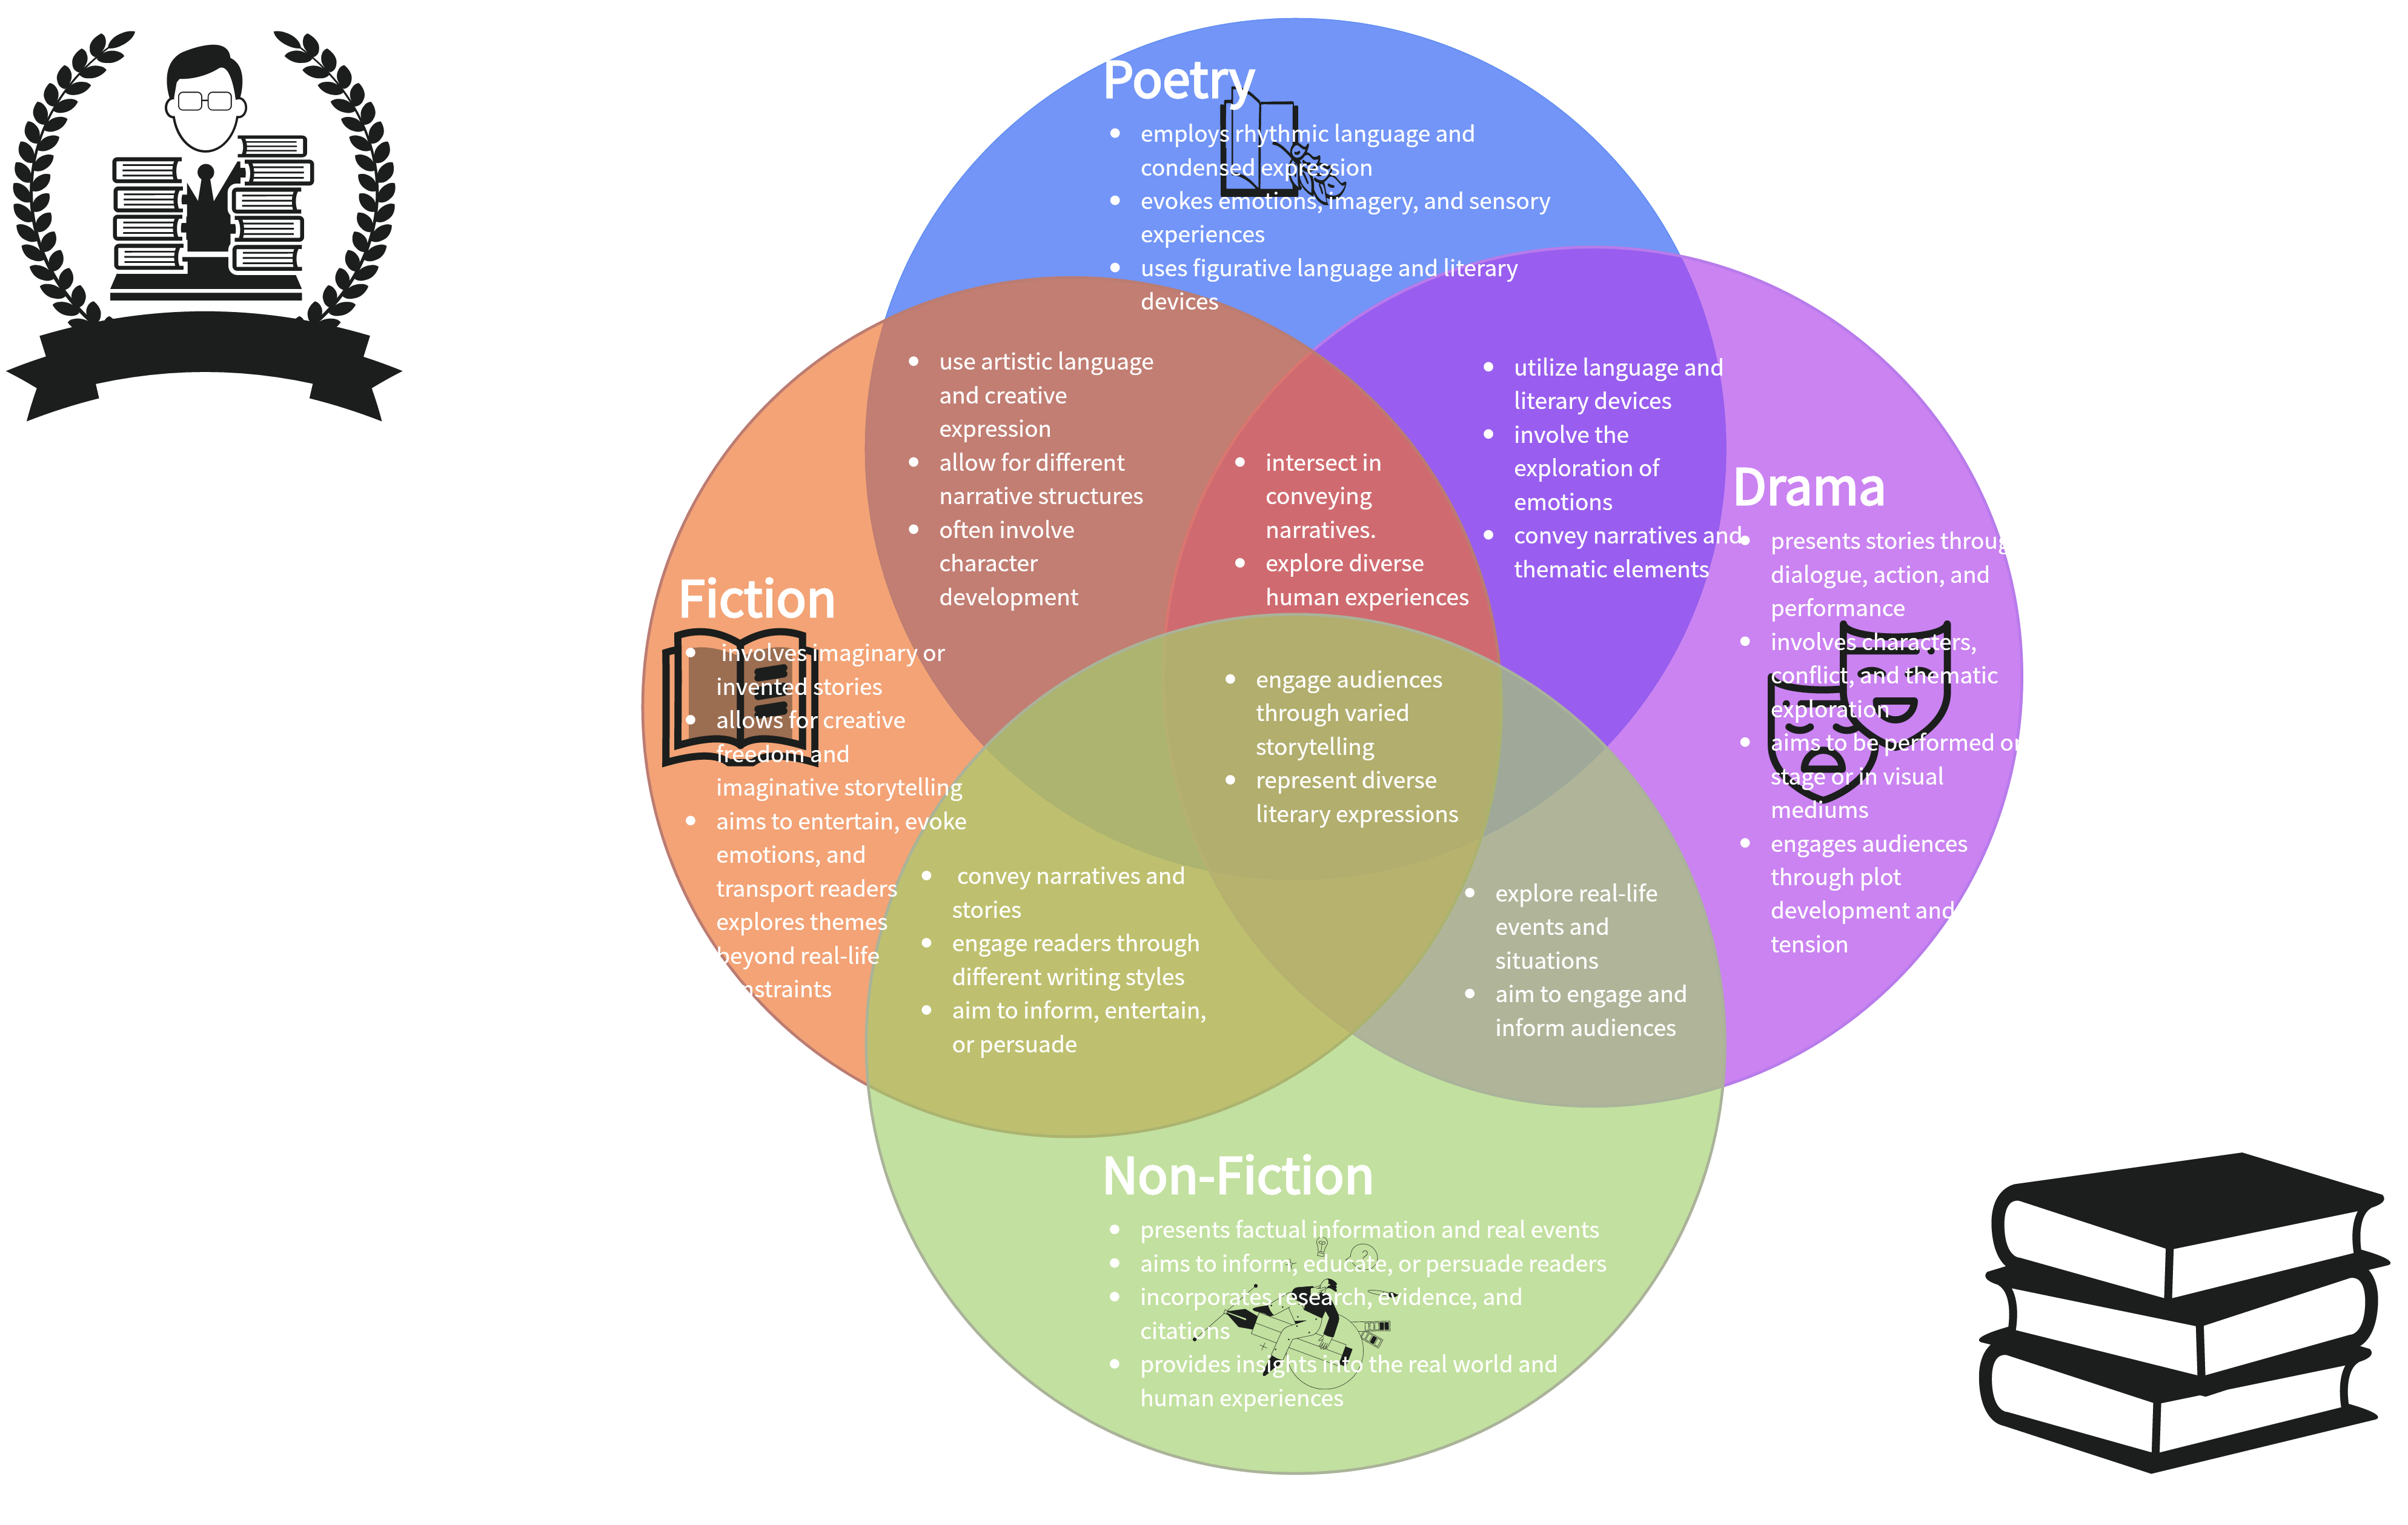
Example of Venn Diagram in Literature
A Venn diagram is a graphical representation that uses overlapping circles to illustrate the relationships or commonalities between different literary genres. Each circle represents a specific genre, and the overlapping areas highlight where genres share common characteristics or themes. This visual tool is employed in literary analysis to showcase the connections and distinctions among genres, aiding in the understanding of their shared elements or unique features.
How to Create a Venn Diagram?
1. Identify the Data to Represent
Identify the data sets you want to represent in the Venn diagram. Finalize the number of unique data sets so that you can create that number of circles.
2. Pick the Template
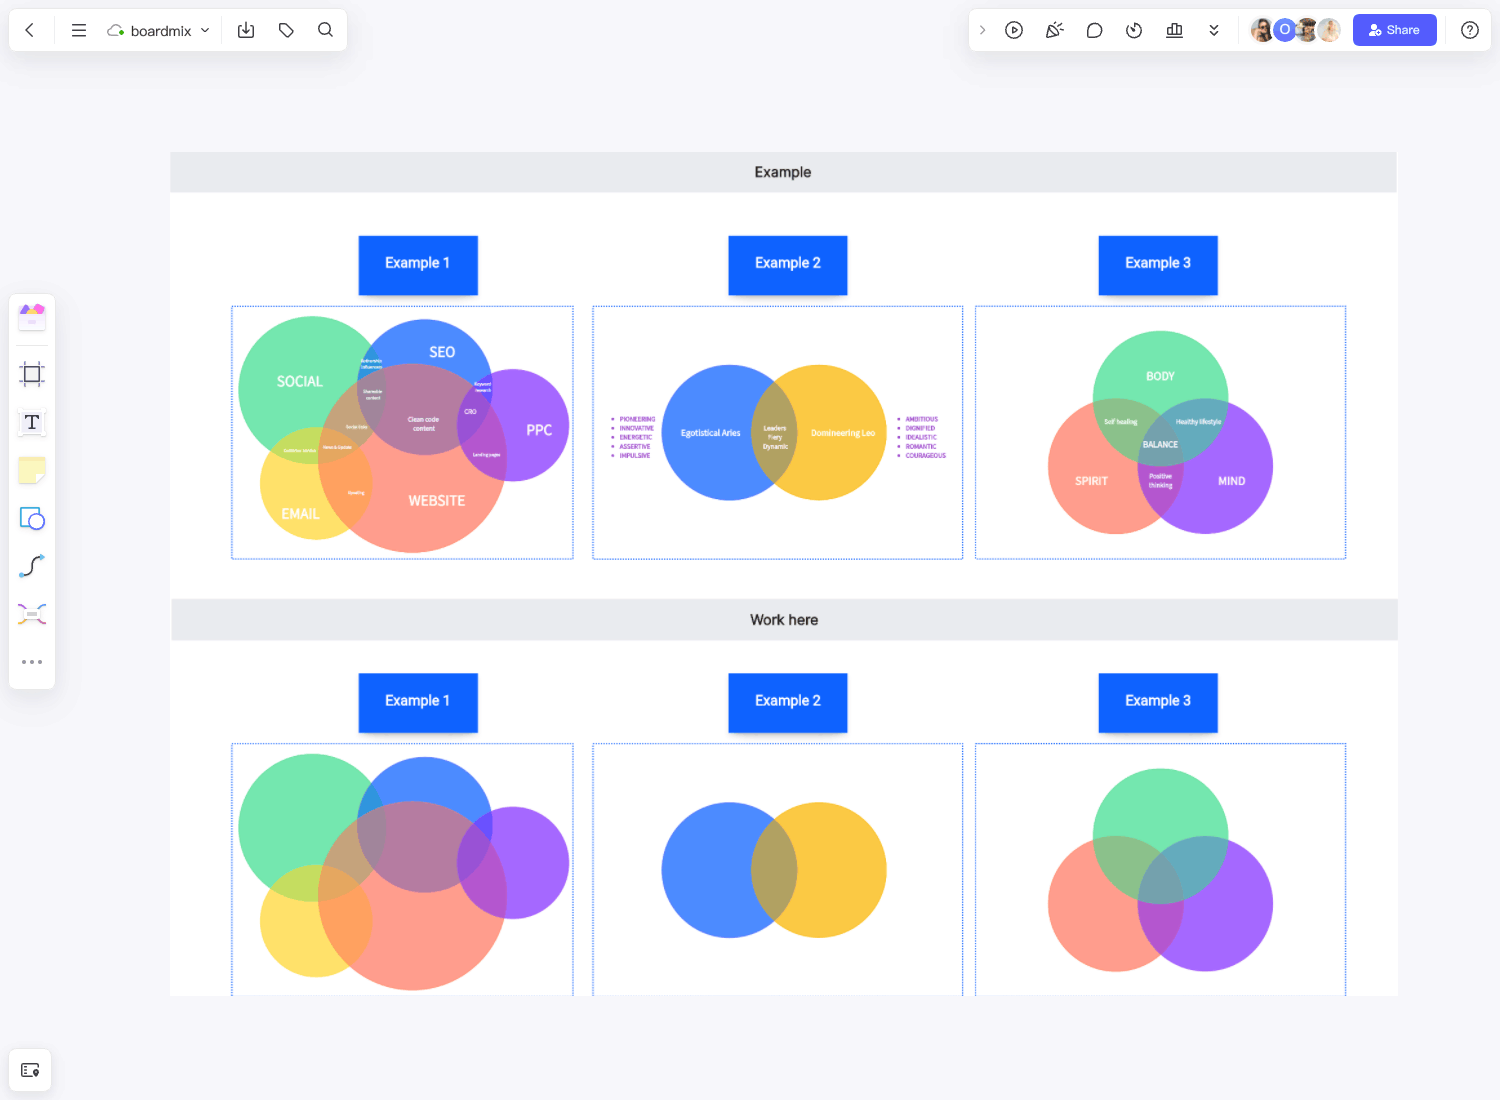
Although you can create a Venn diagram from scratch, using pre-made templates makes the whole process efficient. Boardmix provides a fully customizable Venn diagram template that lets you instantly make a Venn diagram. It provides 5-circles, 3-circles, and 2-circles Venn diagrams, but you can remove or add more circles as you want.
3. Add the Data Sets
Once you have picked the template, add the main data sets in each circle and label them properly.
4. Present the Similarities and Differences
Now add the similarities in those overlapping areas. Similarly, add the differentiating attributes in areas of the circles that do not overlap.
5. Customize and Share the Venn Diagram
Customize the Venn diagram to make it appealing and easy to understand. You can change the size and color of circles and make other customizations. Once done, share the diagram with others.
How to Create Venn Diagram: A Step-by-step Guide
Boardmix offers a user-friendly platform that allows users to create custom diagrams, infographics, charts, and more. Its unique selling point lies in its simplicity, making it an ideal choice for beginners and professionals alike. The built-in Venn diagram template and rich shape resources are particularly useful, allowing users to visualize relationships between different sets or groups easily.
Here, we present a step-by-step guide on creating your own Venn diagram using Boardmix.
Step 1: Login or Register
Begin by accessing the Boardmix website and logging into your account. If you're a new user, sign up for a free account.

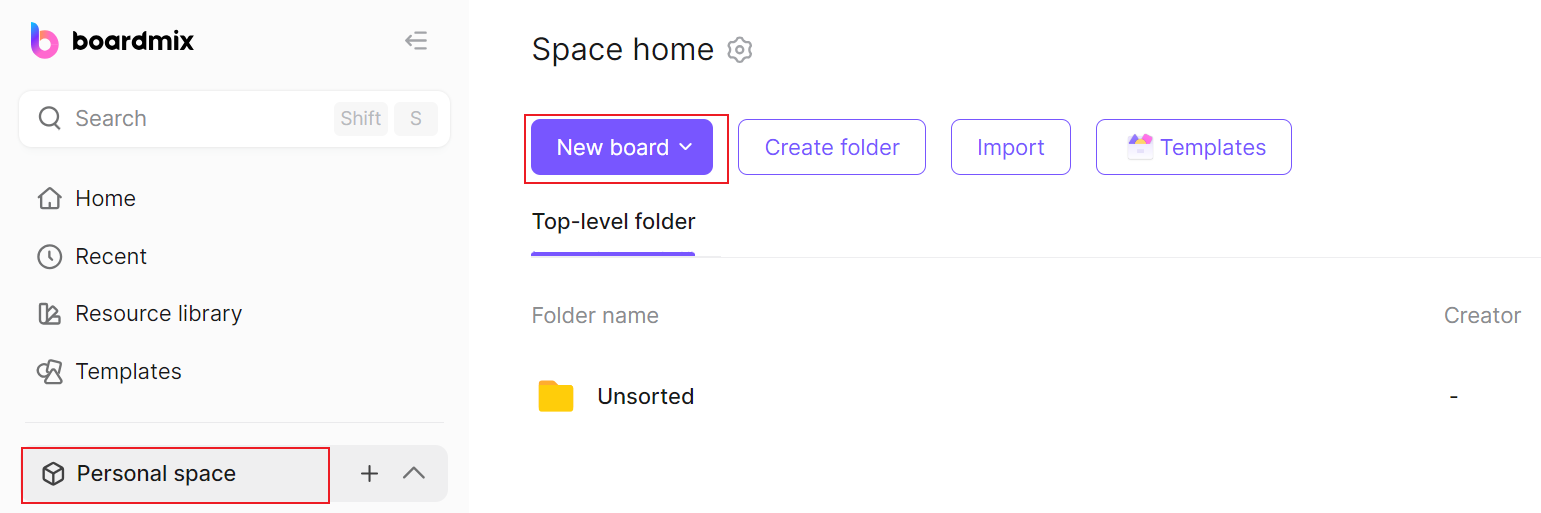
Step 2: Create a New Board
After logging in, click on the "New board" button, and then you’ll be directed to an editor with all the tools you need.
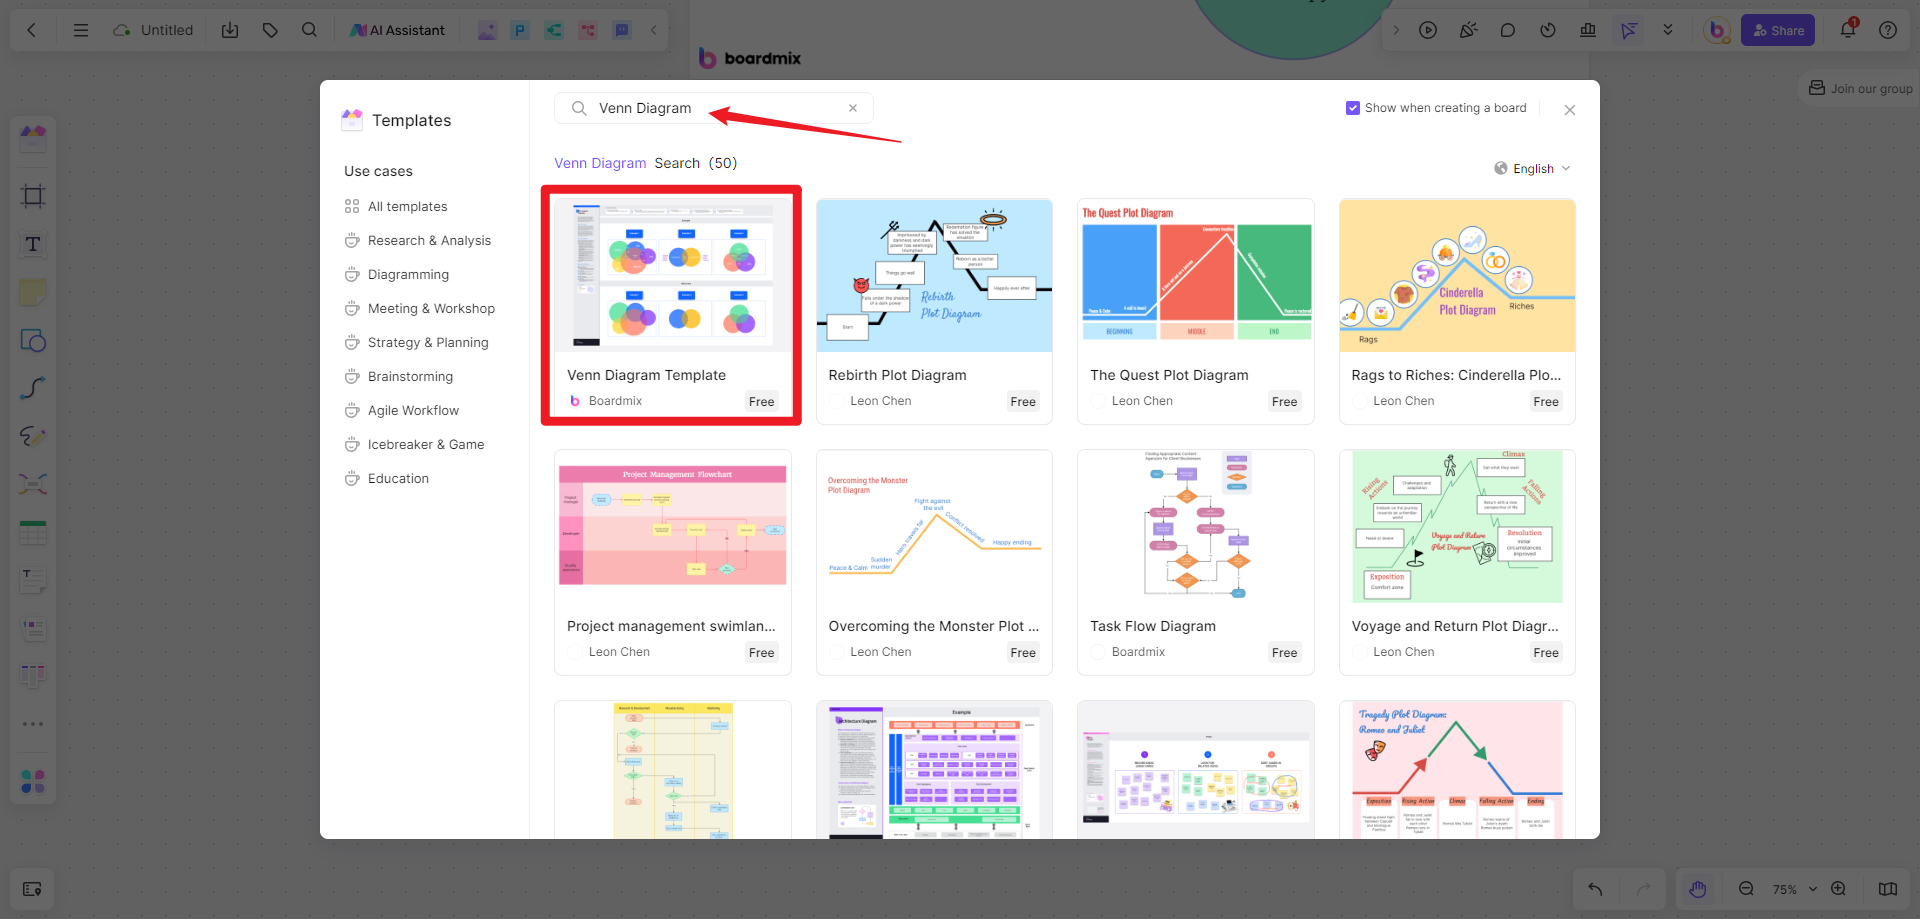
Step 3: Use the Venn Diagram Template
From the left panel, click “Template”, then search for the Venn diagram. Directly use the template after locating it, and you’ll have a preset framework.
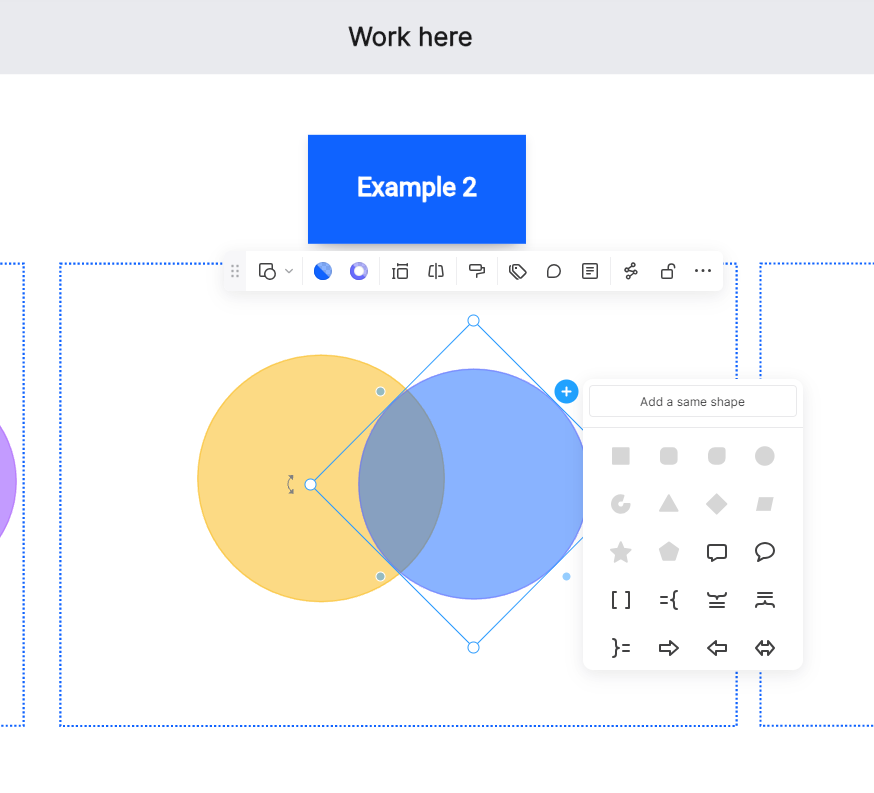
Step 4: Adjust the Size and Position of the Circles
By default, Boardmix provides two circles for a simple Venn diagram. Add more circles as needed by clicking on "Shapes". Customize the size of the circles by dragging their corners. Arrange them to represent the relationships among your sets.
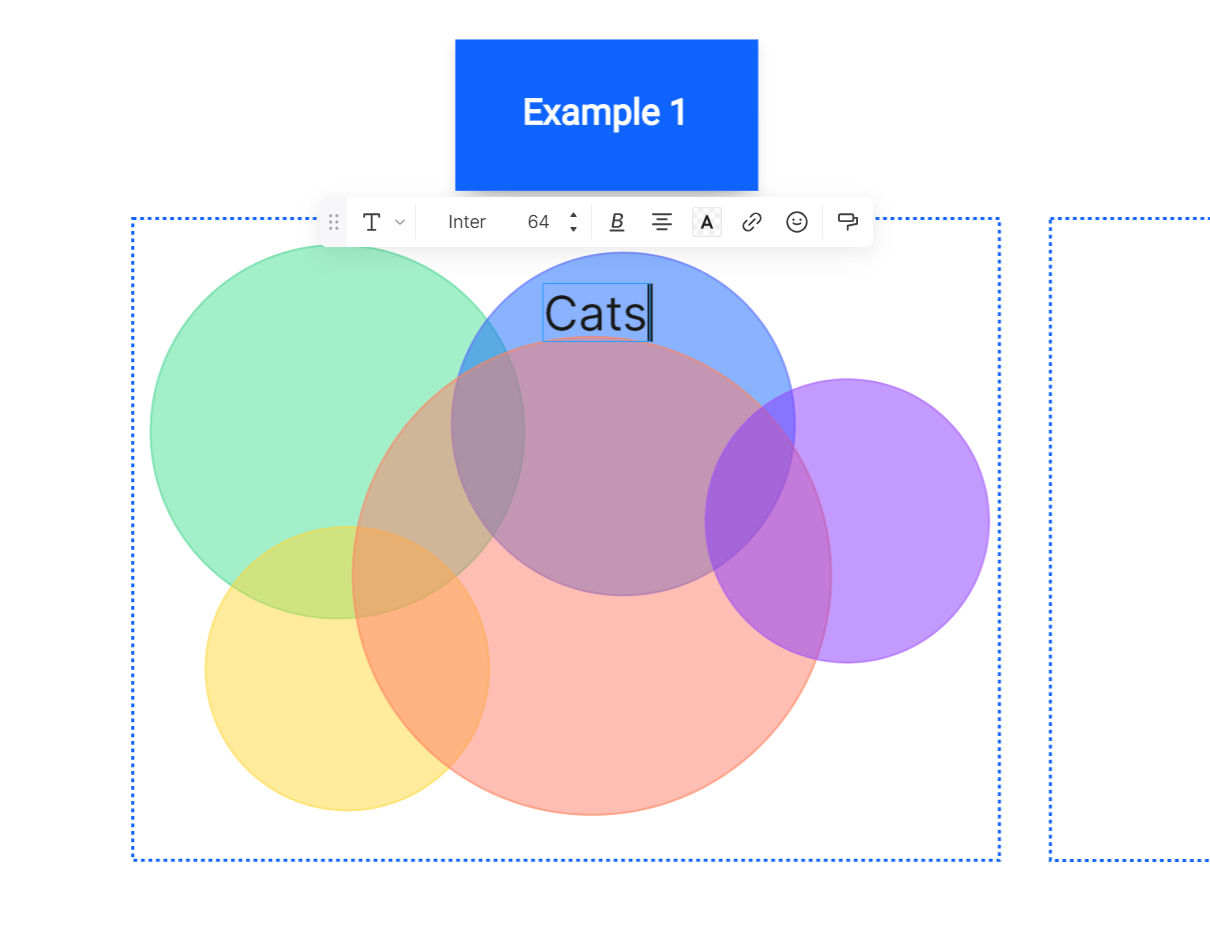
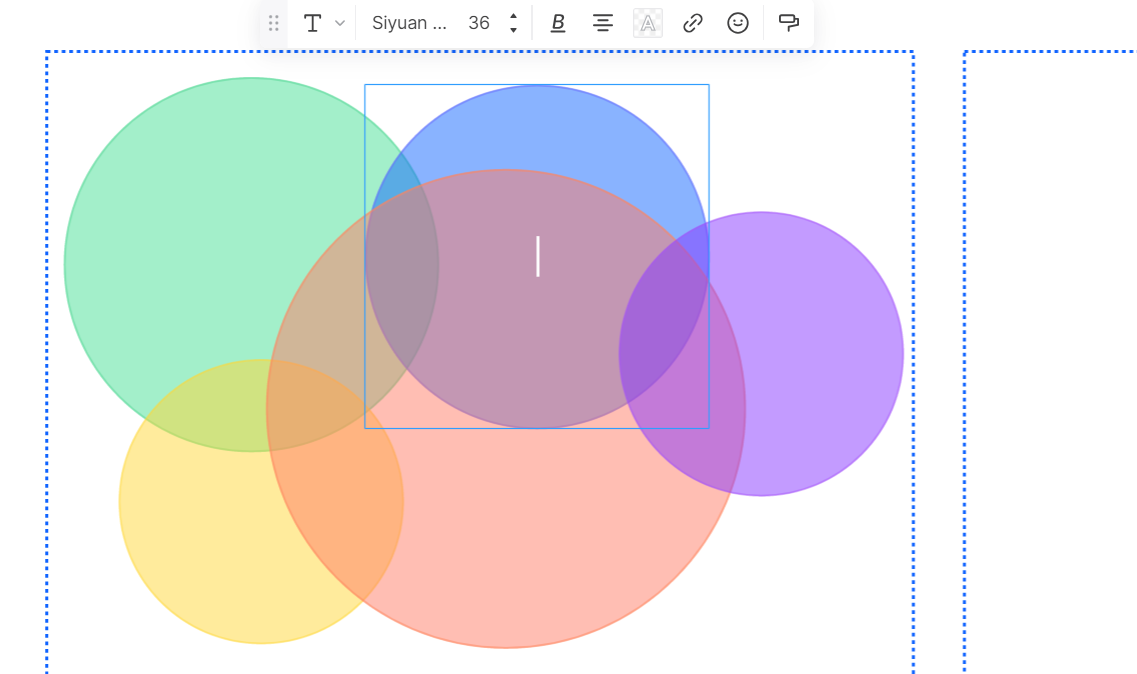
Step 5: Label Your Circles
Use the text tool to add labels to your circles. These labels should represent the different groups or sets in your diagram.
Step 6: Fill in Your Diagram
Click inside each section of your diagram to add values. You can also copy and paste data from other documents into the diagram.
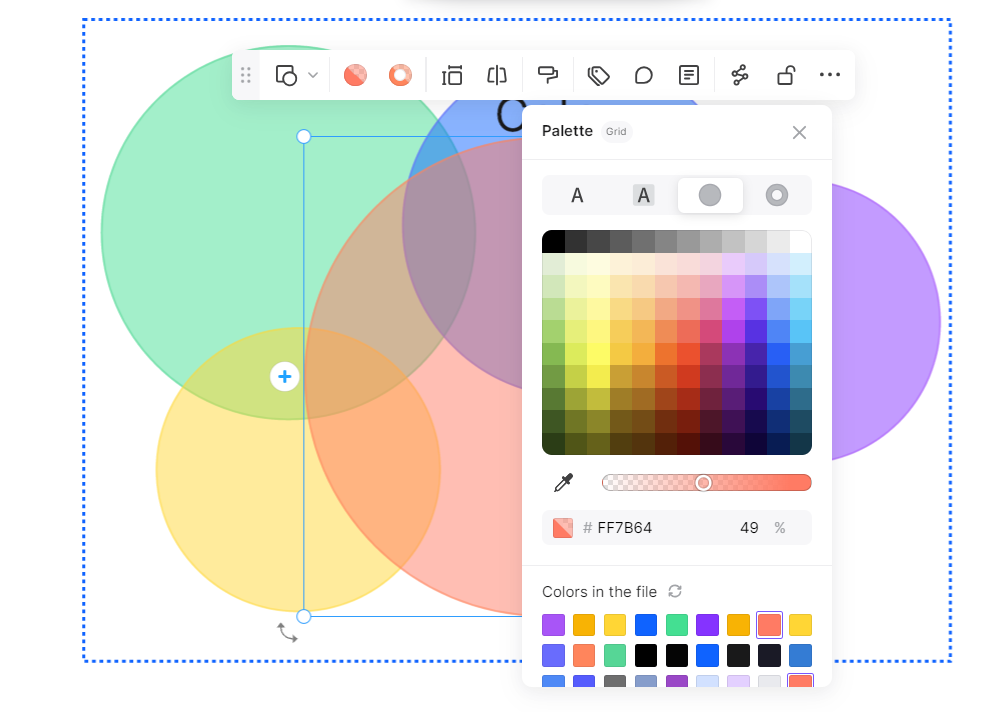
Step 7: Customize Your Diagram's Appearance
Boardmix allows you to customize the appearance of your diagram by changing color schemes, font styles, and sizes.
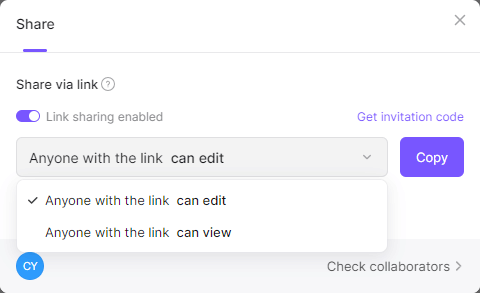
Step 8: Share and Export Your Diagram
Once you've finished your Venn diagram, share it with your teammates via a link or export it in a suitable format (PDF, PNG, JPEG) for printing.
By following these simple steps, anyone can create a professional-looking Venn diagram using Boardmix's intuitive platform. Is it easy-peasy? Go ahead and give Boardmix a try!