Flowcharts are the visual language that translates complex sequences into a series of logical, easy-to-follow steps. Whether you're mapping out a new software development process, planning a marketing campaign, or simply trying to understand a new concept, flowcharts provide a clear and concise way to organize and communicate information. In this comprehensive guide, we will delve into the various types of flowcharts, explore their applications, and learn how to create them effectively using Boardmix. We'll also provide tips on choosing the most suitable flowcharts types for your specific needs, ensuring that your visual communication is as effective as possible.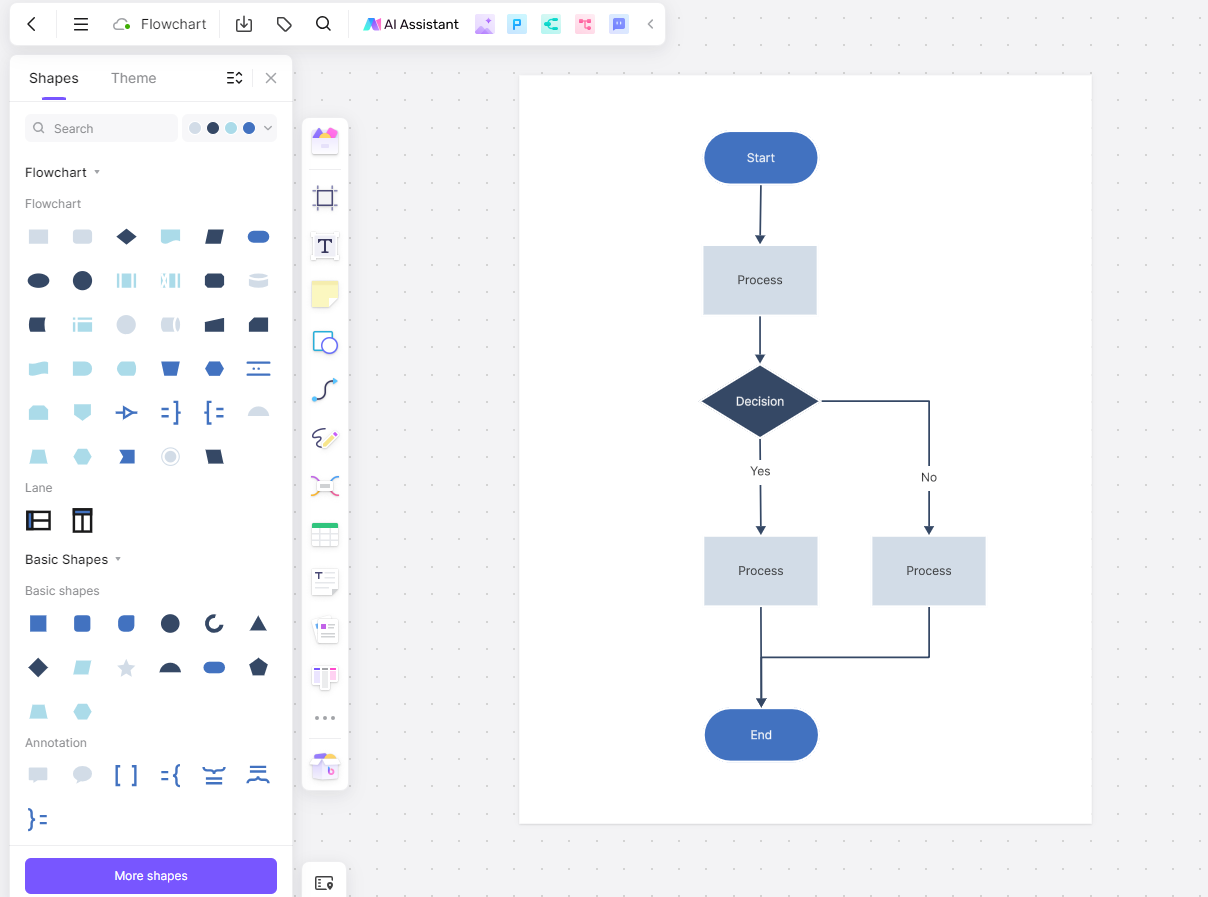

What Are Flowcharts and What can They Do?
Flowcharts are more than just a collection of shapes and arrows; they are a comprehensive language that translates intricate processes into a universally understood visual format. At their core, flowcharts are graphical representations of algorithms or processes, where each step is represented as a shape, and the order of operations is indicated by arrows. They serve as a bridge between the abstract and the concrete, making complex systems and procedures accessible and comprehensible.
The Essence of Flowcharts
Flowcharts are used to model complex systems by breaking them down into a series of manageable components. They outline procedures by providing a step-by-step guide that is easy to follow, which is particularly useful in training and instructional materials
Benefits of Using Flowcharts
- Clarity and Simplicity
One of the primary benefits of flowcharts is their ability to present information in a straightforward, easy-to-understand manner.
- Improved Communication
Flowcharts facilitate better understanding among team members and stakeholders by providing a shared visual reference point. This is especially valuable in cross-functional teams.
- Efficiency
Visualizing processes through flowcharts helps in identifying bottlenecks and areas for improvement. By mapping out each step, it becomes easier to spot inefficiencies, redundancies, or points of failure.
- Collaboration
Flowcharts serve as a common ground for team discussions and brainstorming sessions. They provide a visual framework that encourages collaboration and the sharing of ideas.
- Error Reduction
Flowcharts can help reduce errors by providing a clear, step-by-step guide that can be followed by anyone involved in the process.
9 Flowchart and Related Diagram Examples
These nine examples include process flowcharts and related diagrams for workflows, data, user goals, and project dependencies. They answer different questions, so choose the notation that matches what you need to explain.
Process Flow Diagrams
Use this process flow diagram template
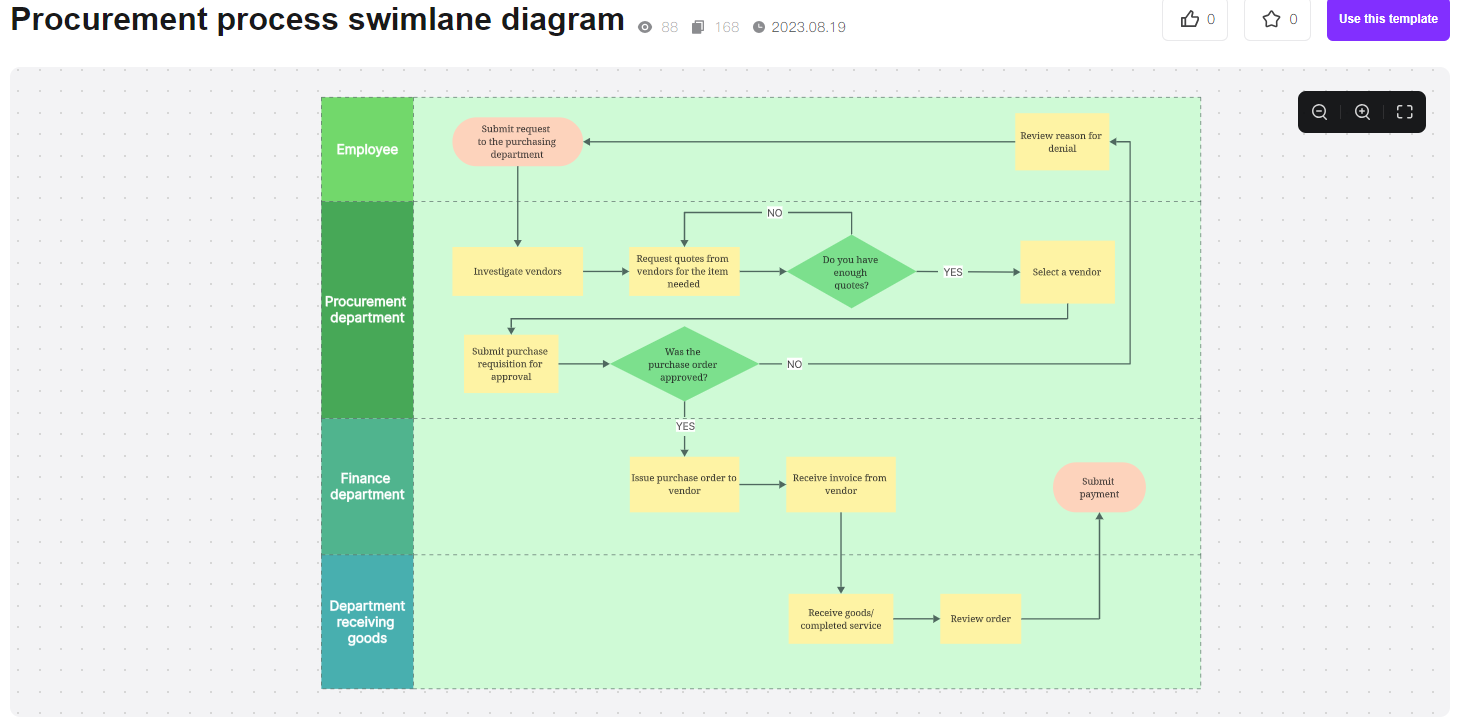
Process flow diagrams show the steps and decisions in a process. The procurement example above also uses swimlanes to identify who handles each step. Timelines and resource details can be added when useful, but they are not inherent requirements of a process flowchart.
Workflow Diagrams
Use this workflow diagram template
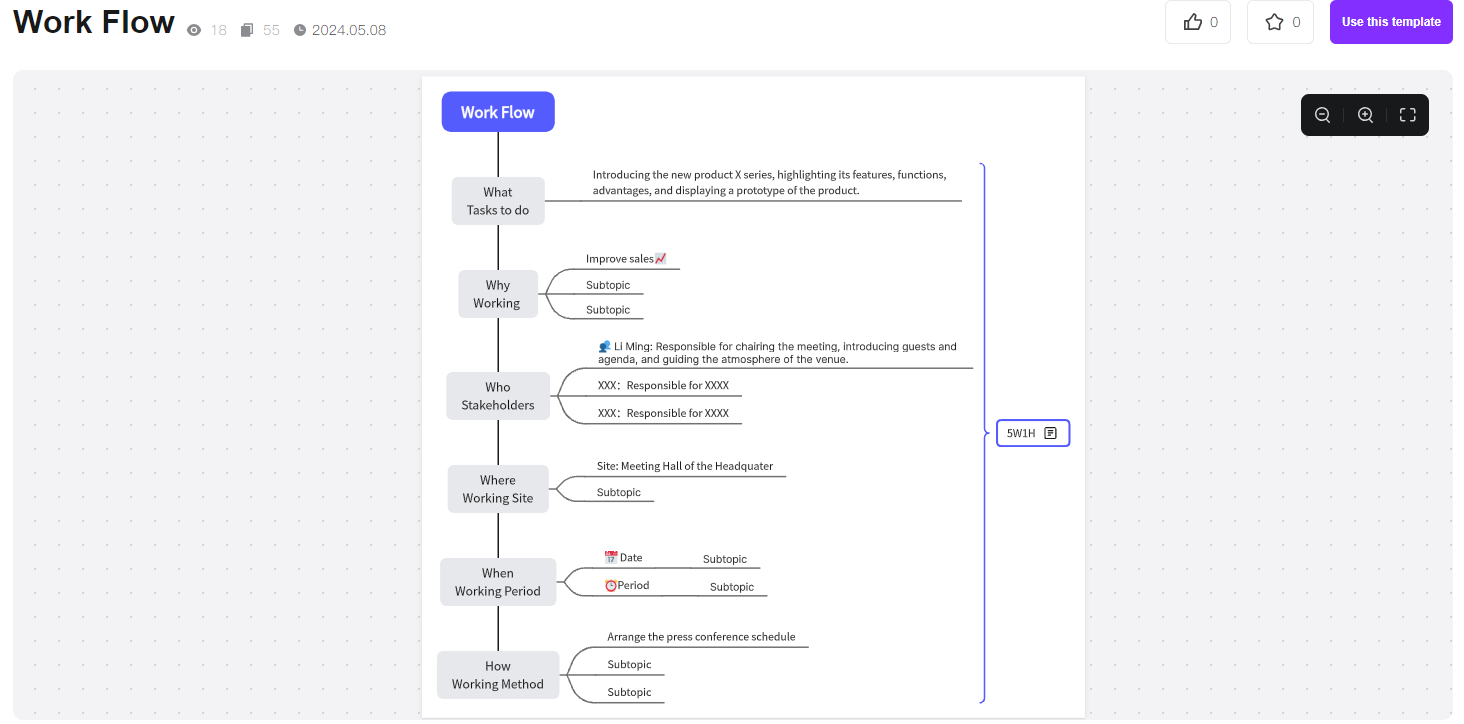
Workflow diagrams show task order and handoffs between people or teams. The example above is a workflow planning map: it groups questions about what, why, who, where, when, and how. Use connected process steps when you need to show the execution sequence.
Data Flow Diagrams (DFDs)
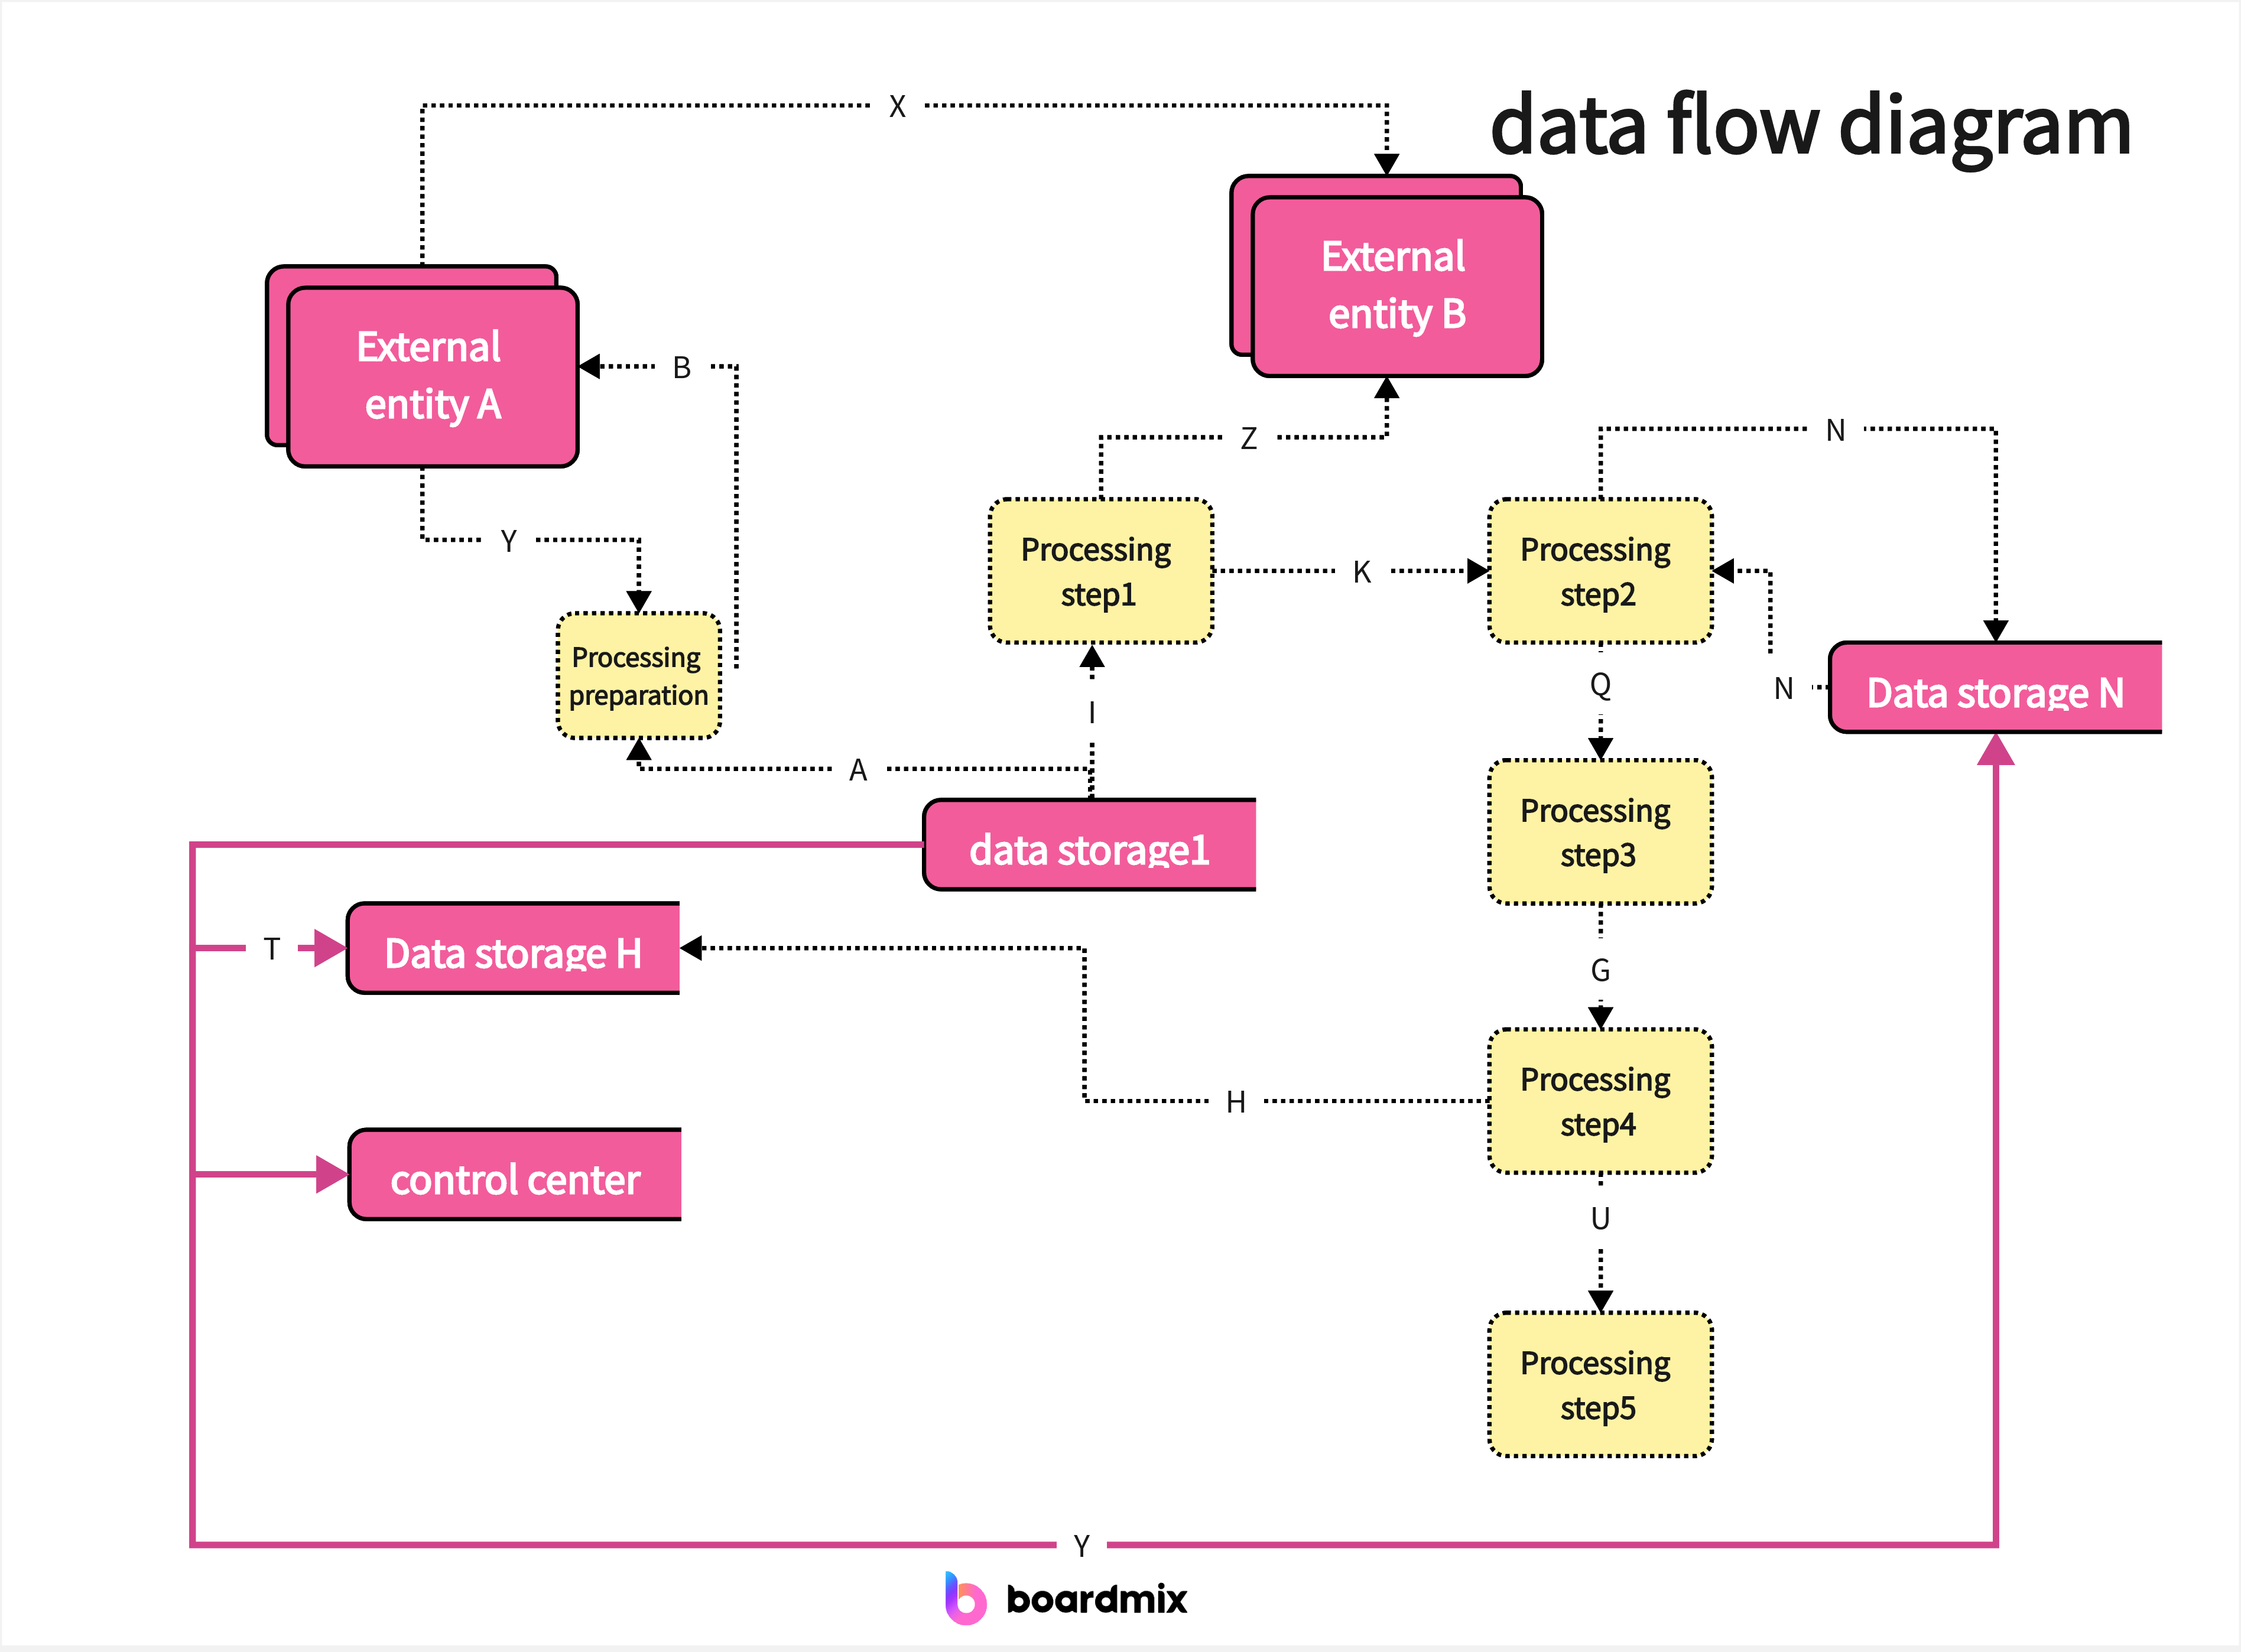
Use this data flow diagram template
Used to explain how data moves through a process or system, DFDs simplify complex processes by showing data input, storage, and output. They are instrumental in database design, systems analysis, and ensuring data integrity and security.
Swimlane Flowcharts
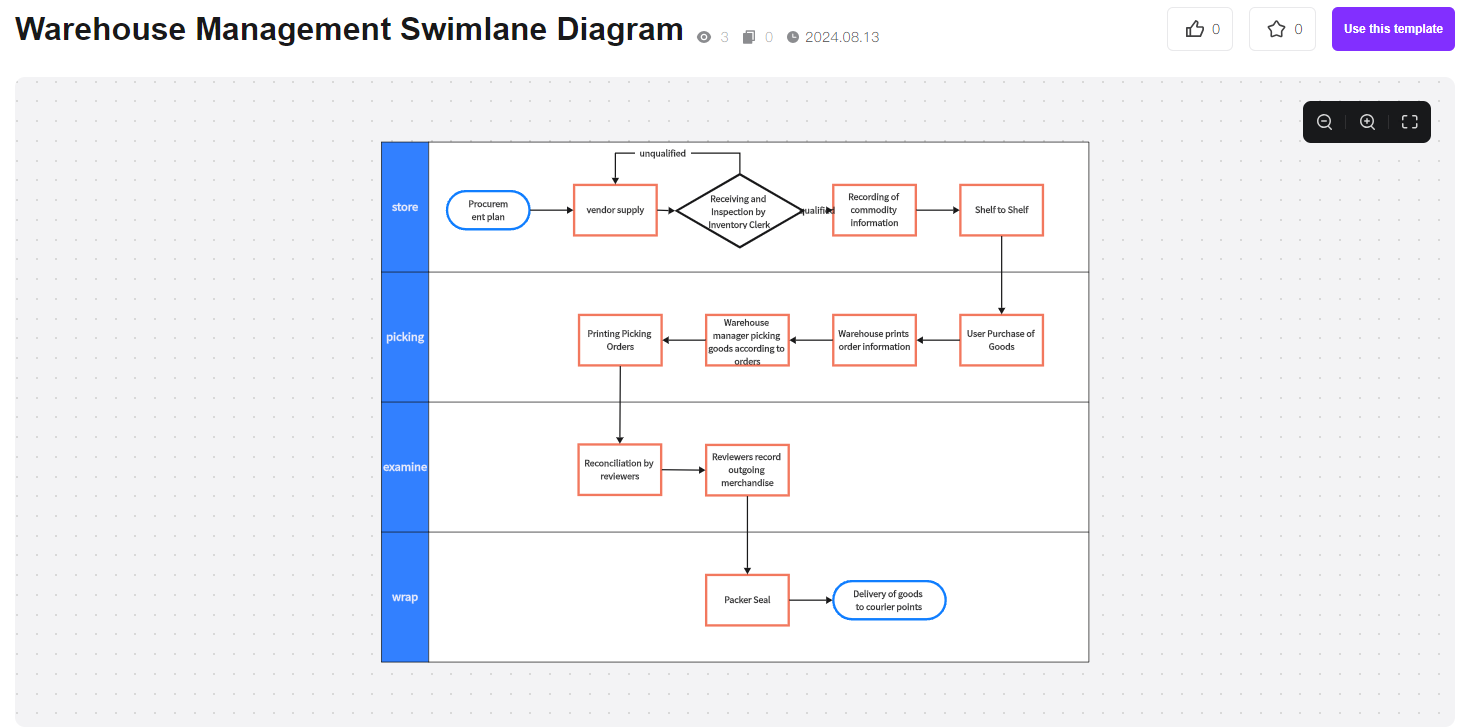
Designed to illustrate how different teams or departments interact within a process, swimlane flowcharts use lanes to separate different roles, clarifying responsibilities and handoffs. They are invaluable for large-scale operations and cross-functional projects.
Entity-Relationship Diagrams
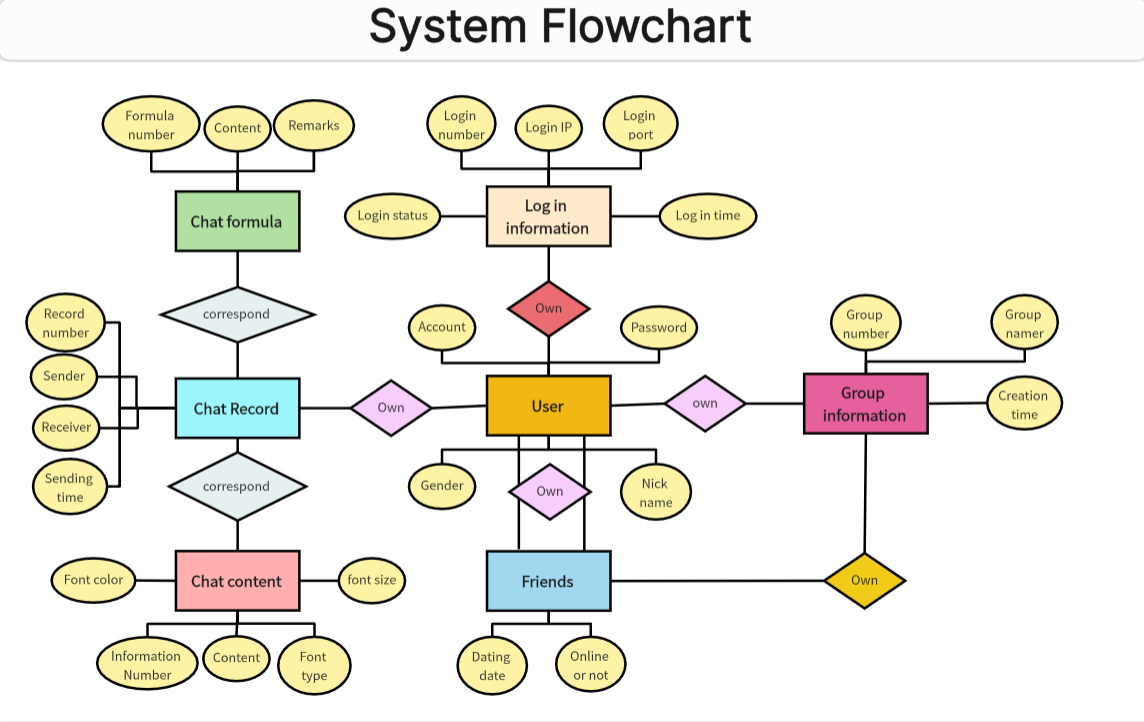
An entity-relationship diagram models data entities, their attributes, and relationships rather than the order of process steps. The example above connects users, chat records, friends, and groups. Despite its embedded “System Flowchart” label, its notation is an ER diagram.
Document Flowcharts
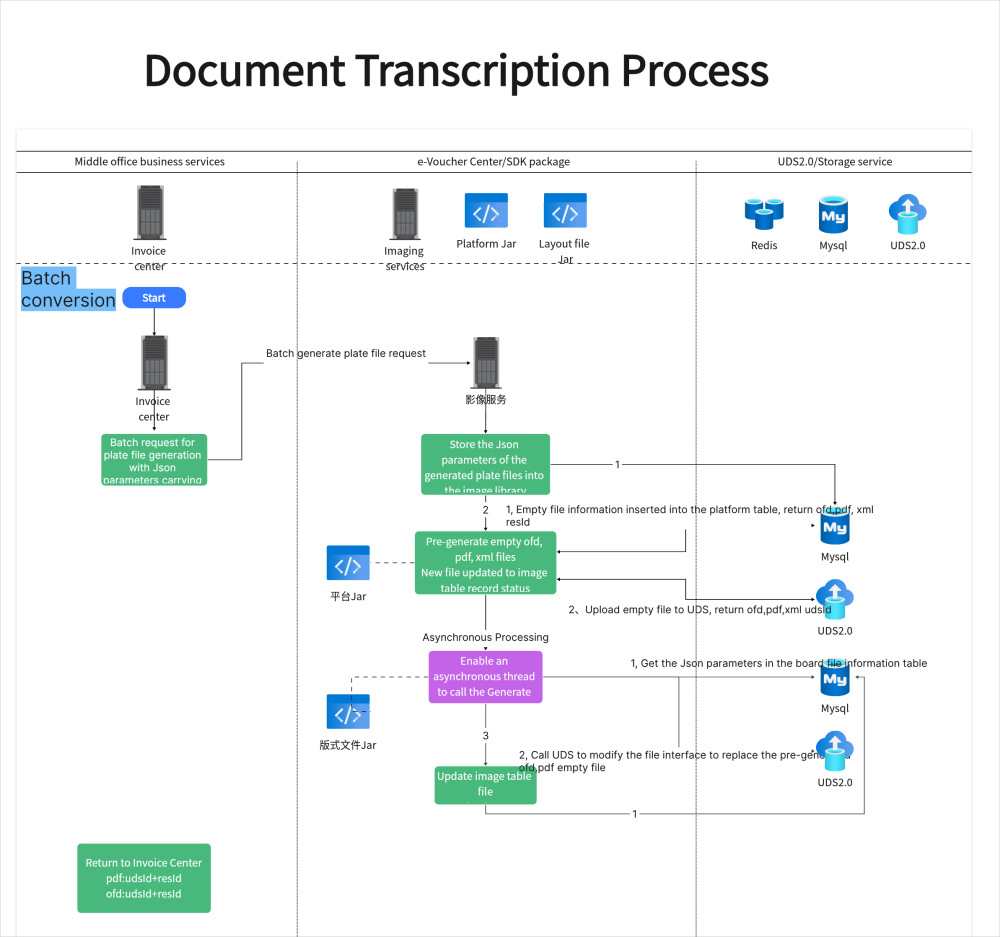
Best for manufacturing or supply chain management teams, document flowcharts show the steps and approvals required for important forms to go through, ensuring that documents go through the necessary approvals efficiently.
Product Flowcharts
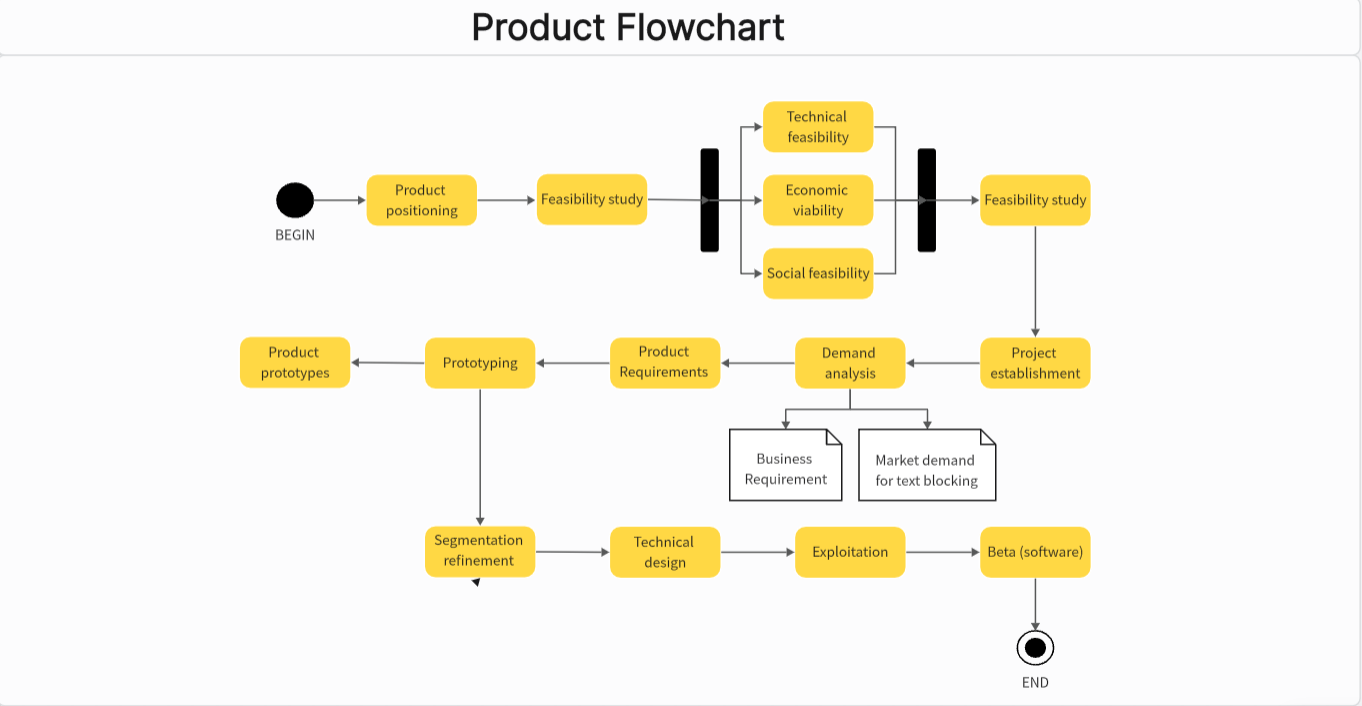
These flowcharts show how a product moves from creation to delivery, outlining key stages and decisions. They help visualize the flow of materials and tasks as they go through different stages in the production process.
PERT Charts
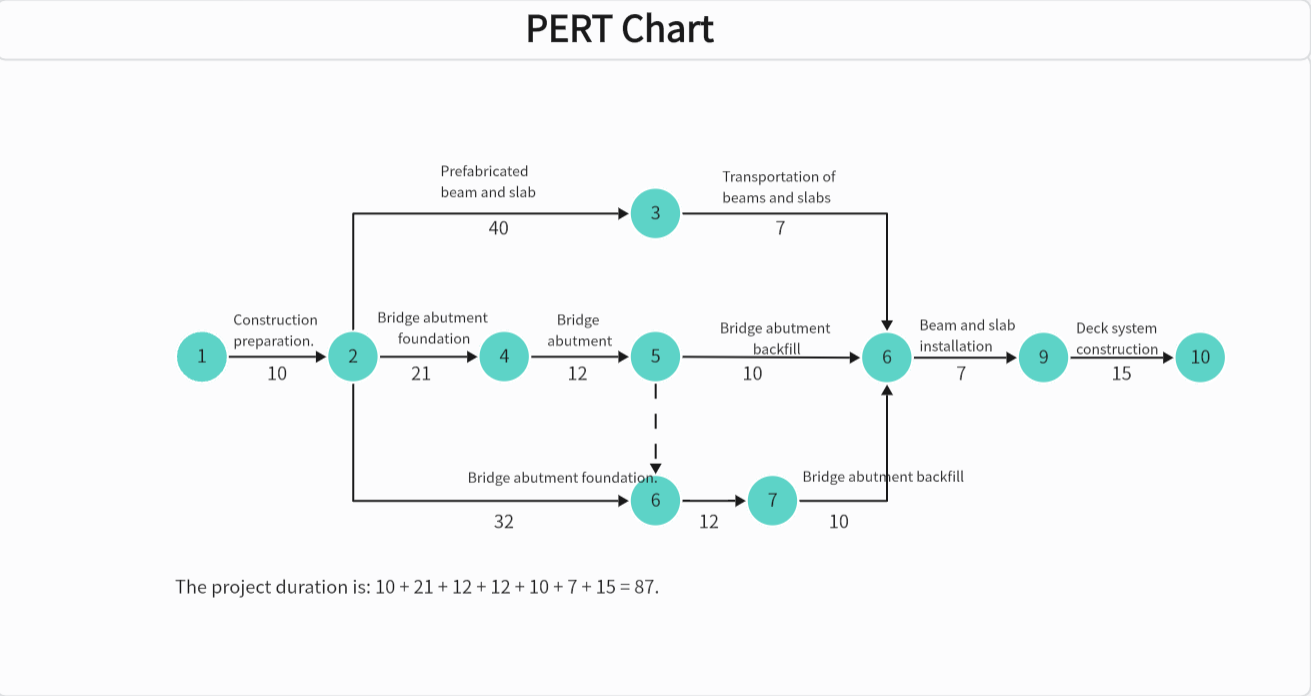
PERT charts show project activities and dependencies as a network. Unlike a Gantt chart, the layout does not need a time-scaled axis; activity durations are used to analyze paths through the project and estimate completion time.
UML Use-Case Diagrams
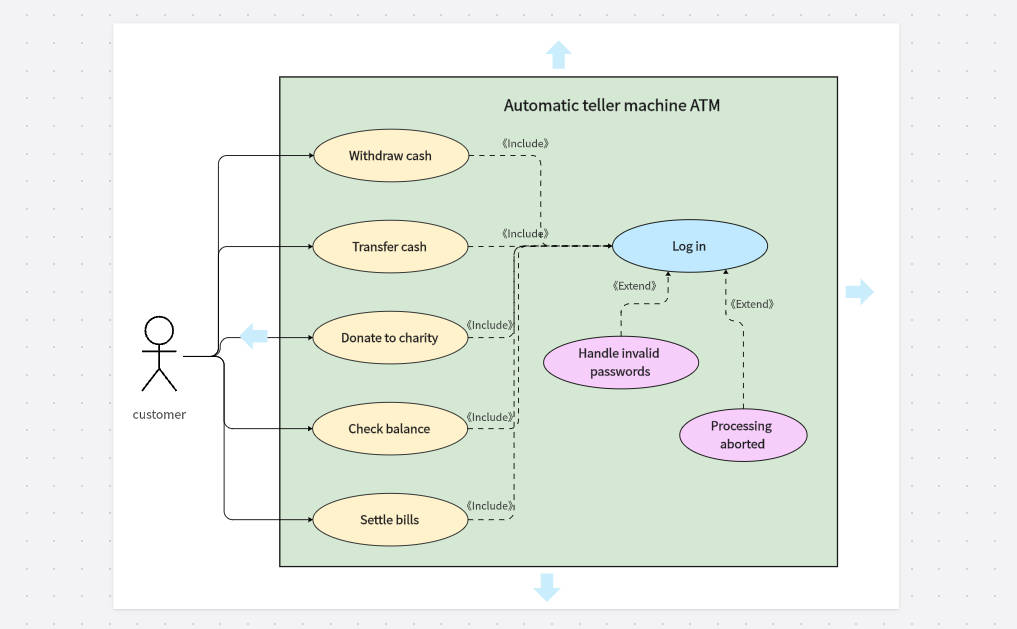
UML use-case diagrams connect external actors with the goals or functions they use in a system. The ATM example links a customer to withdrawals, transfers, balance checks, and bill payments. It describes system capabilities, not the step-by-step order of a customer journey.
How to Create Different Types of Flowcharts on Boardmix?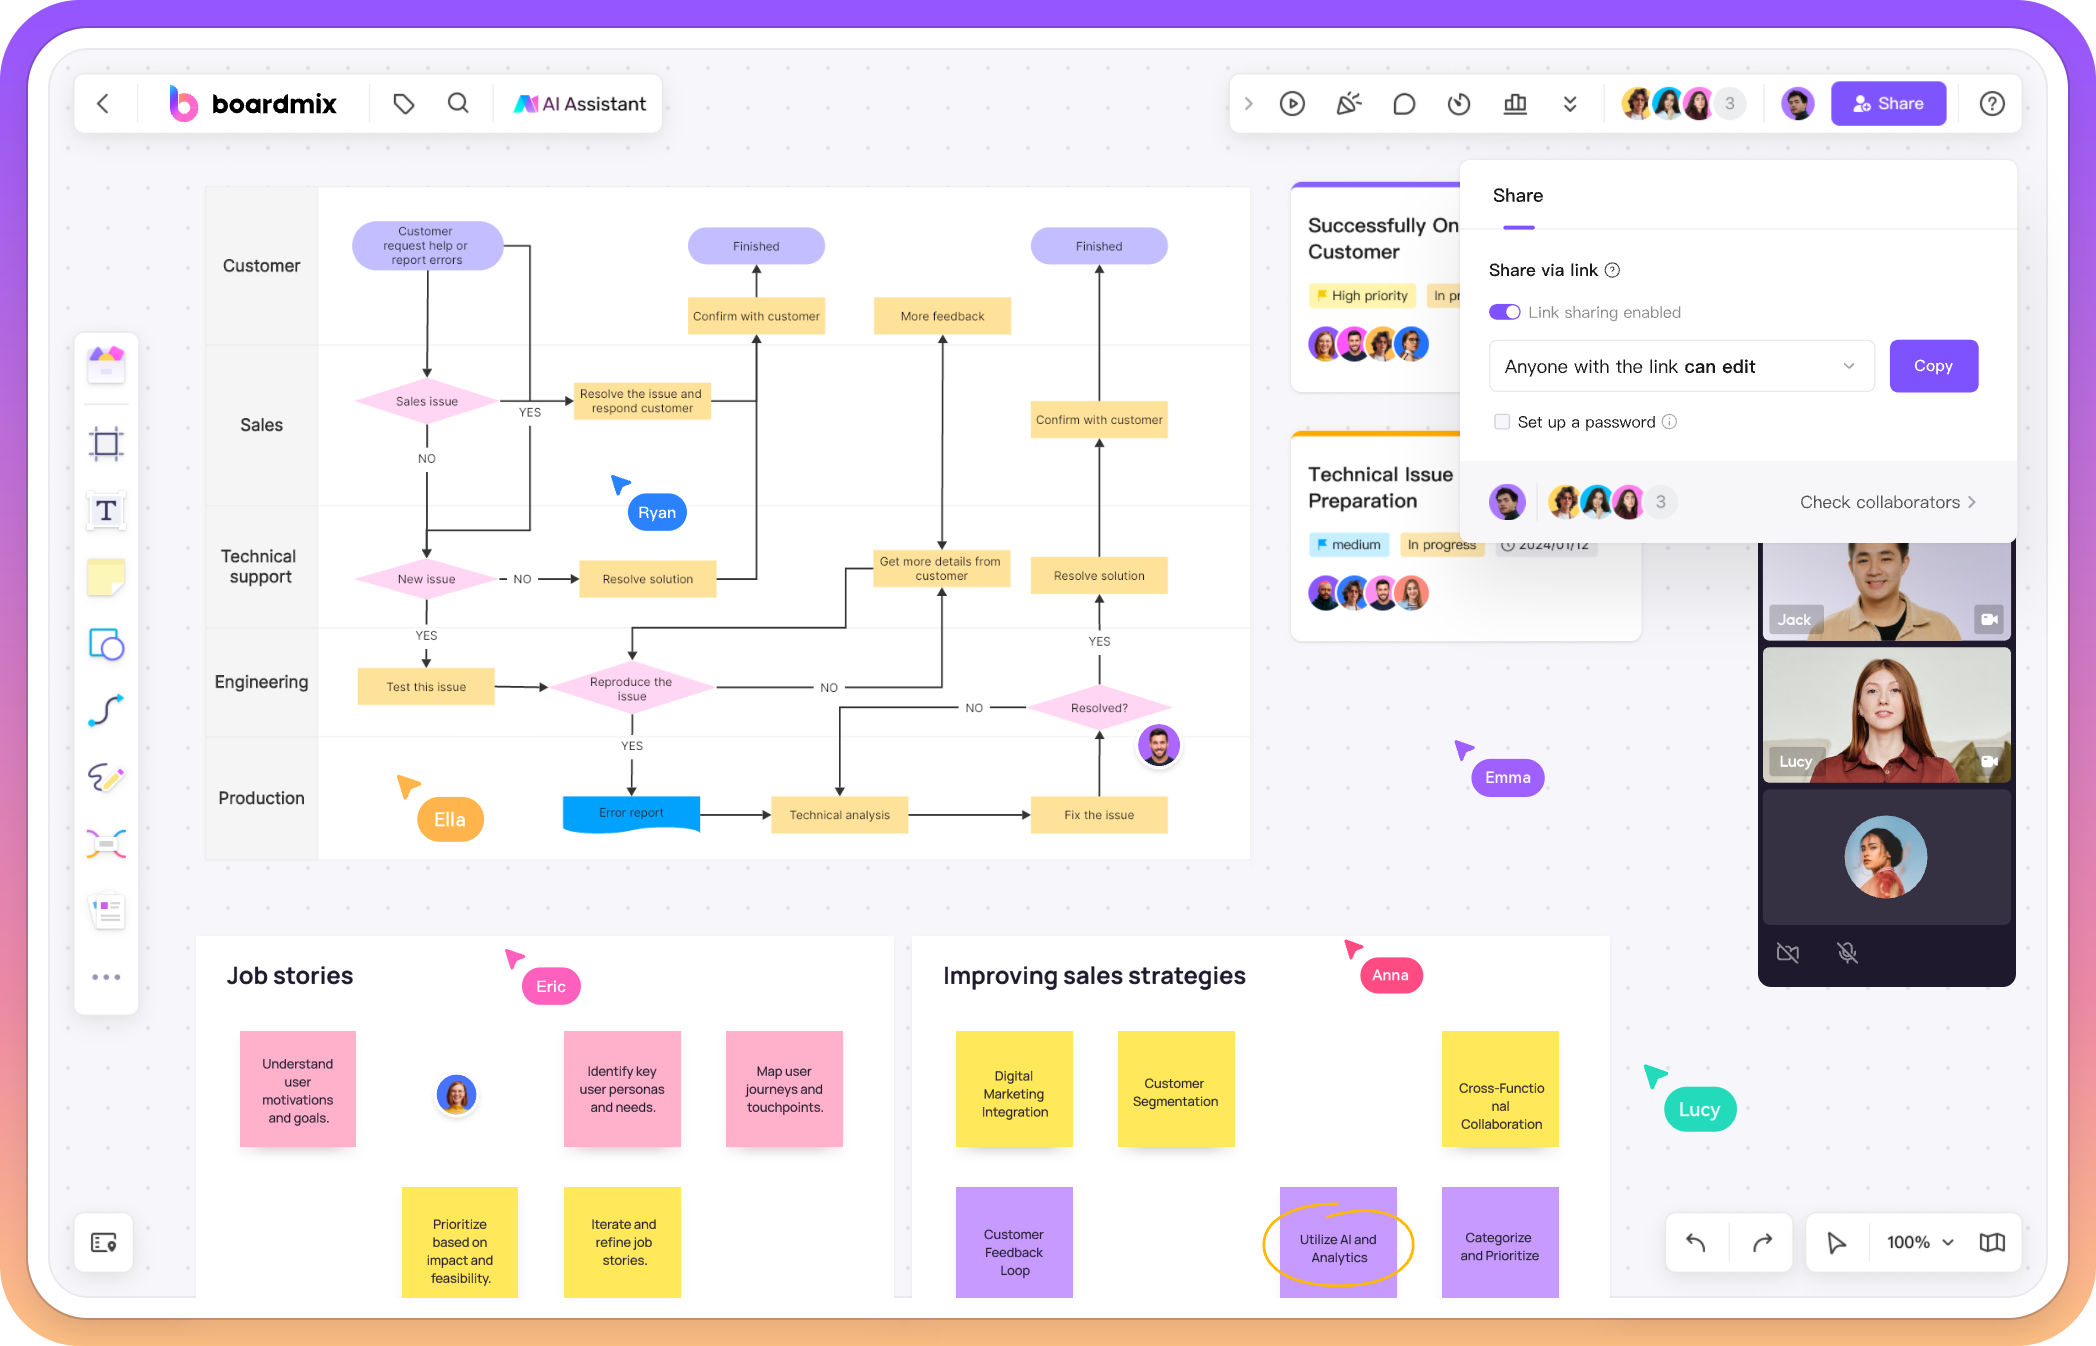
Creating flowcharts with Boardmix Whiteboard is an intuitive and efficient process that empowers users to visualize complex processes with ease. Whether you're mapping out a new project plan or outlining a business workflow, Boardmix provides a suite of tools that cater to all your flowcharts types needs. Let's explore the step-by-step process of creating flowcharts on Boardmix, and discover how its features can enhance your flowchart creation experience.
Step-by-Step Guide to Creating Flowcharts on Boardmix
Access Boardmix Whiteboard
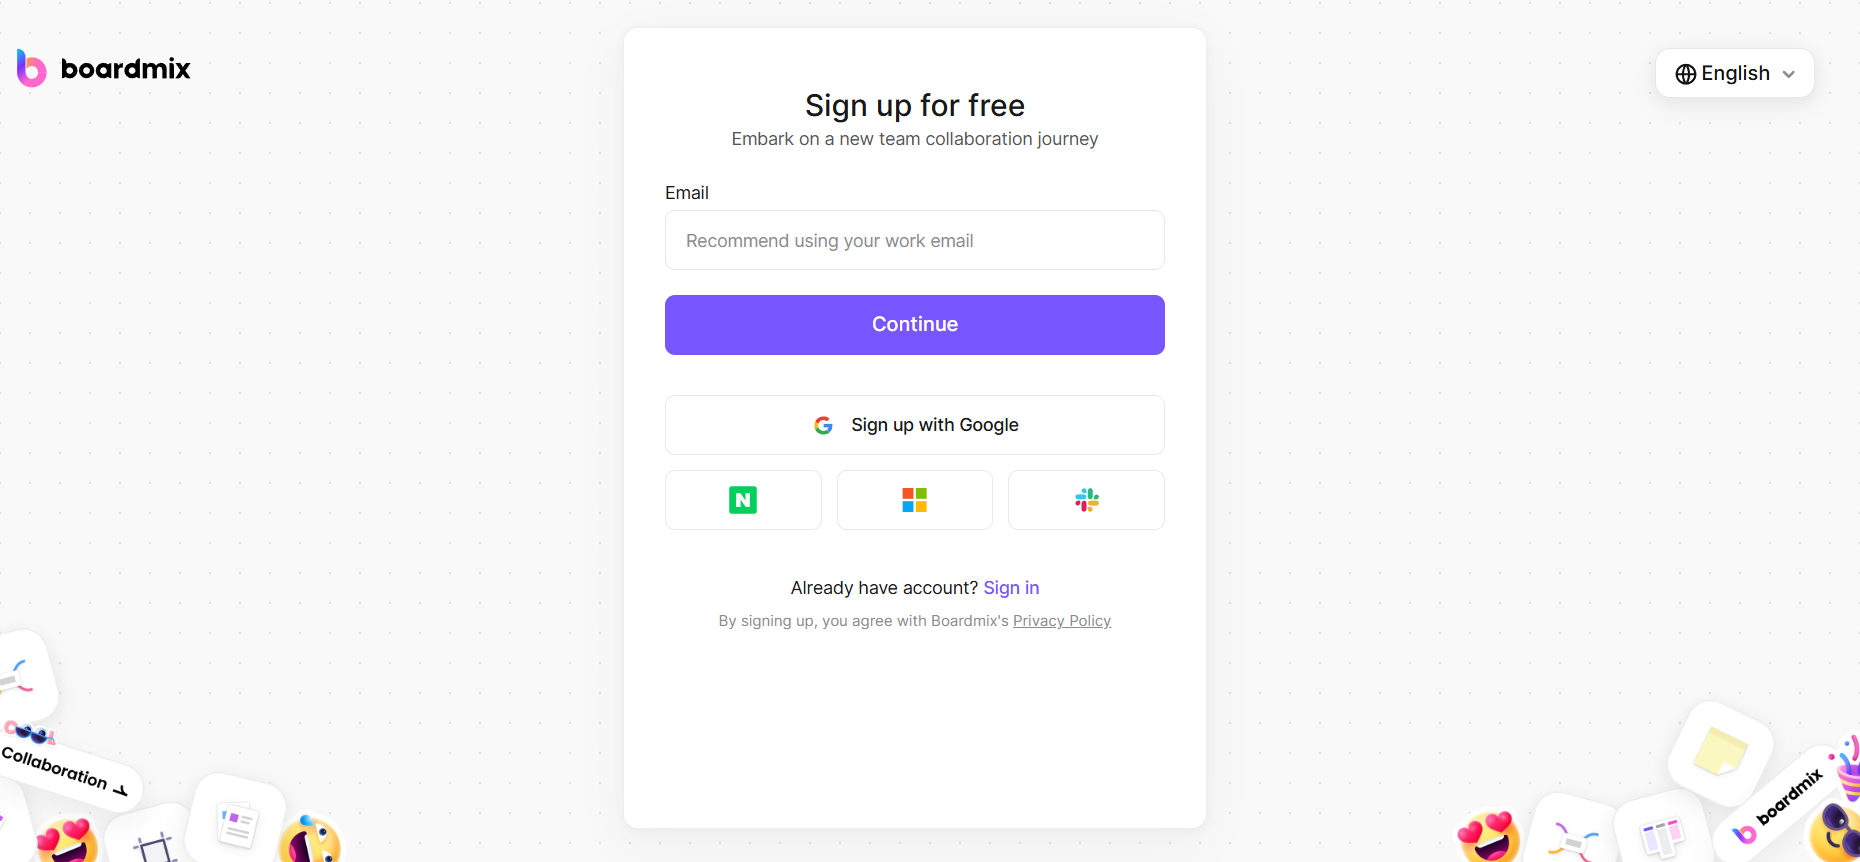
Begin by navigating to the Boardmix Whiteboard website. As a free online tool, it's accessible from any device with an internet connection, making it a convenient choice for users on the go or those looking to collaborate remotely.
Choose a Template
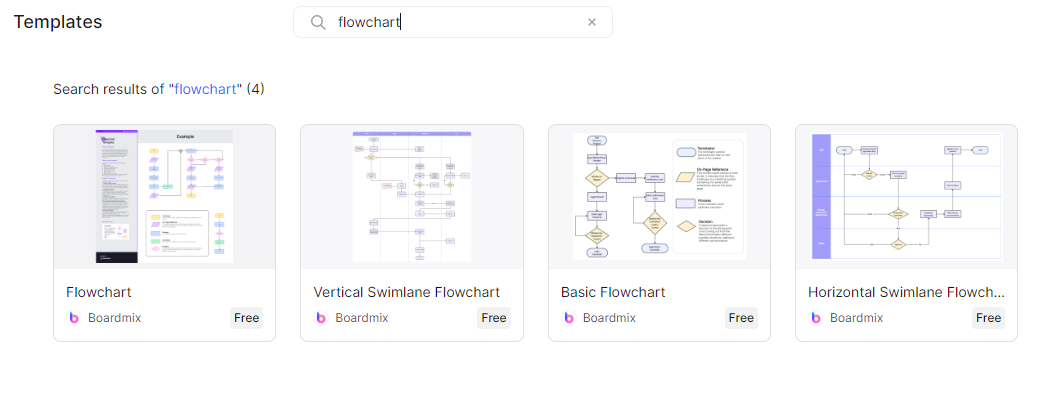
Choose a template that matches your diagram's purpose. The library shown above includes basic and swimlane flowcharts. You can also start with a blank canvas when the available templates do not match the process you need to explain.
Add Shapes and Connectors
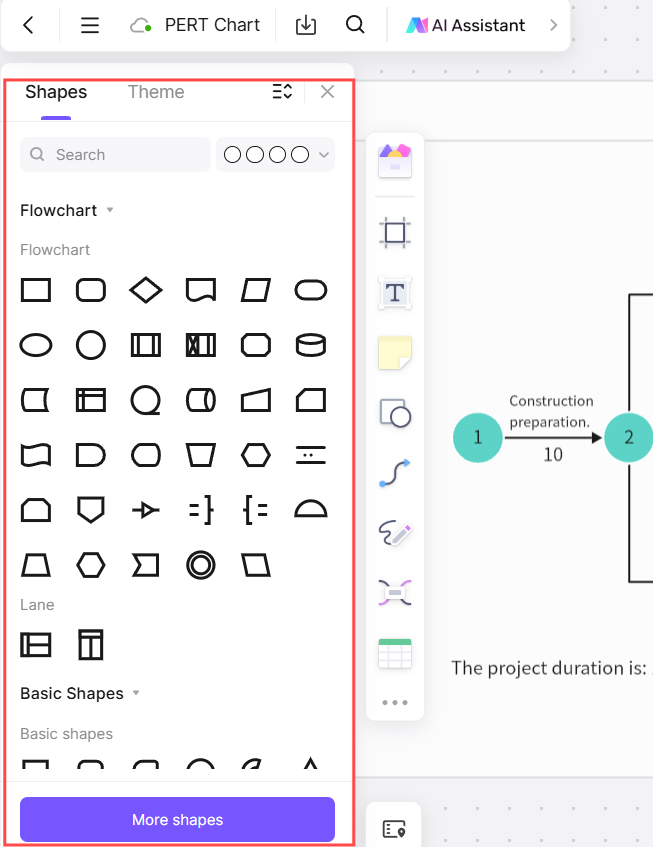
With your template or canvas ready, it's time to build your flowchart. Boardmix's drag-and-drop functionality makes it simple to add shapes and connectors. Browse the toolbar for a variety of shapes such as rectangles, diamonds, and circles, each serving a specific purpose in your flowchart. Click on the desired shape and drag it onto your canvas, then resize and position it as needed.
Customize Your Flowchart
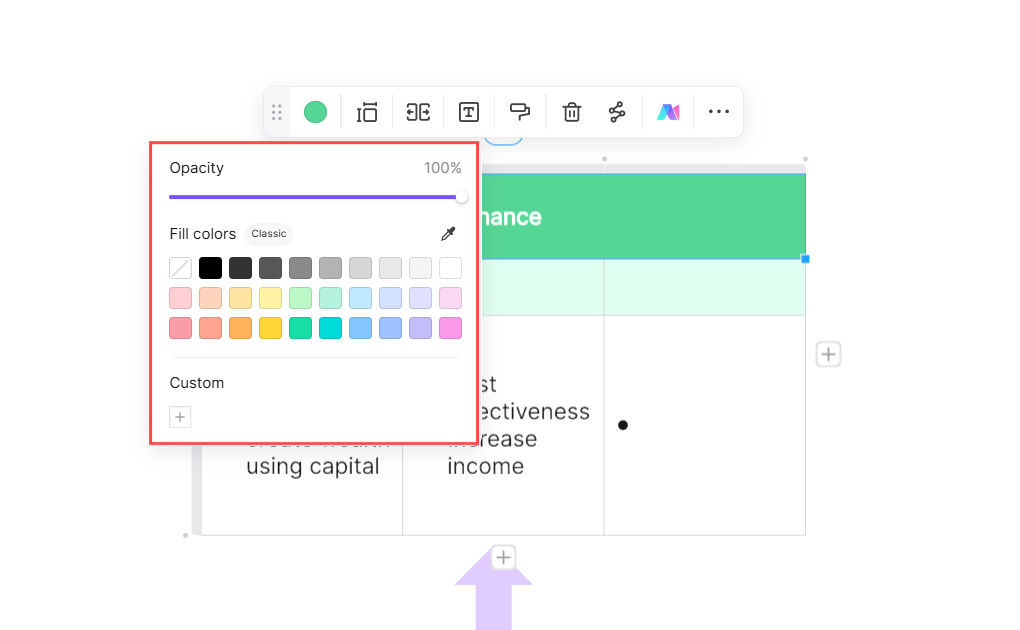
To make your flowchart stand out and effectively convey your information, Boardmix offers extensive customization options. Adjust the color of your shapes, add gradients for a more dynamic look, or change the line thickness of your connectors. You can also add text to your shapes, choosing from a variety of fonts, sizes, and colors to ensure readability and visual appeal.
Collaborate in Real Time
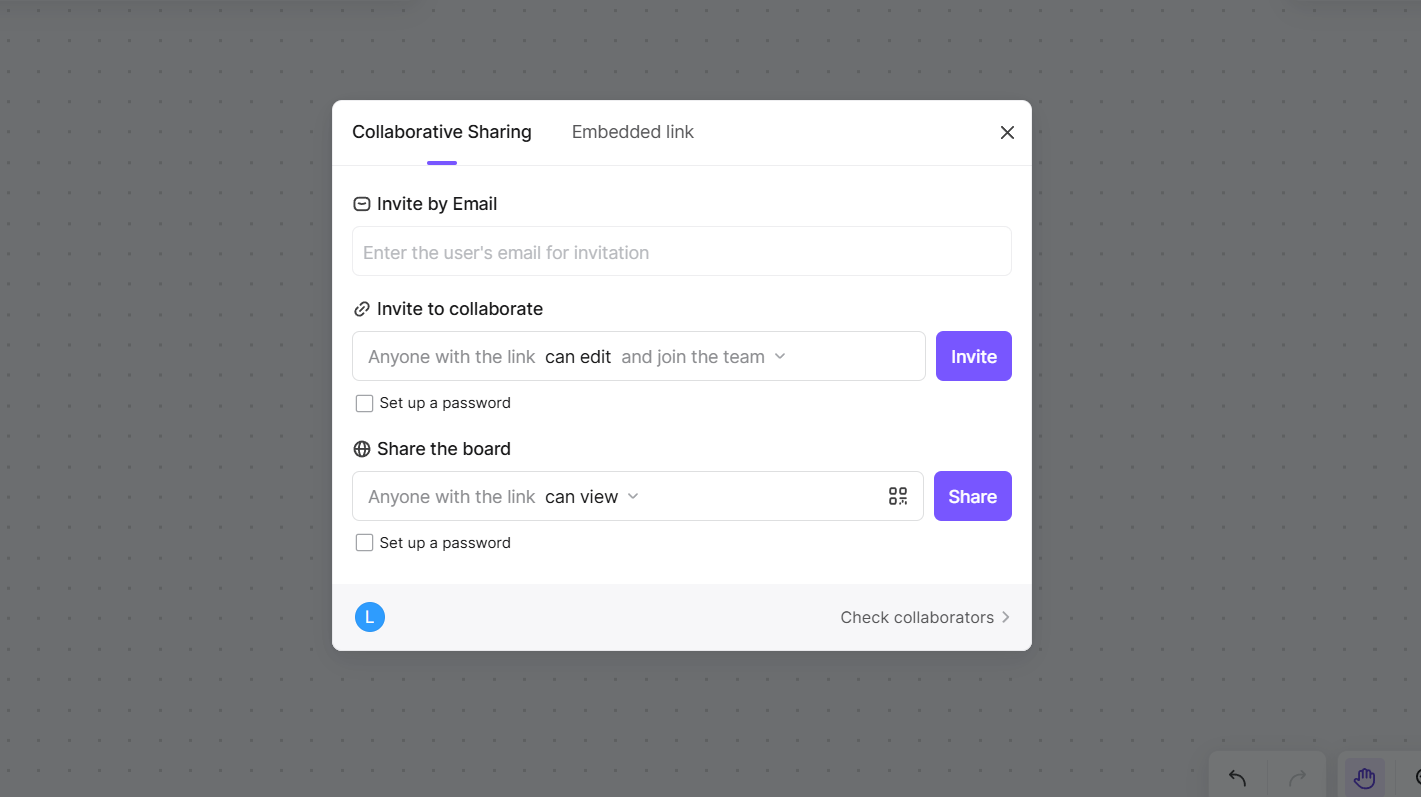
One of the standout features of Boardmix is its real-time collaboration capabilities. Invite team members to your flowchart by sharing the link, and work together in real time. See edits and changes as they happen, and use the platform's commenting and feedback tools to ensure smooth and efficient collaboration.
Save and Export
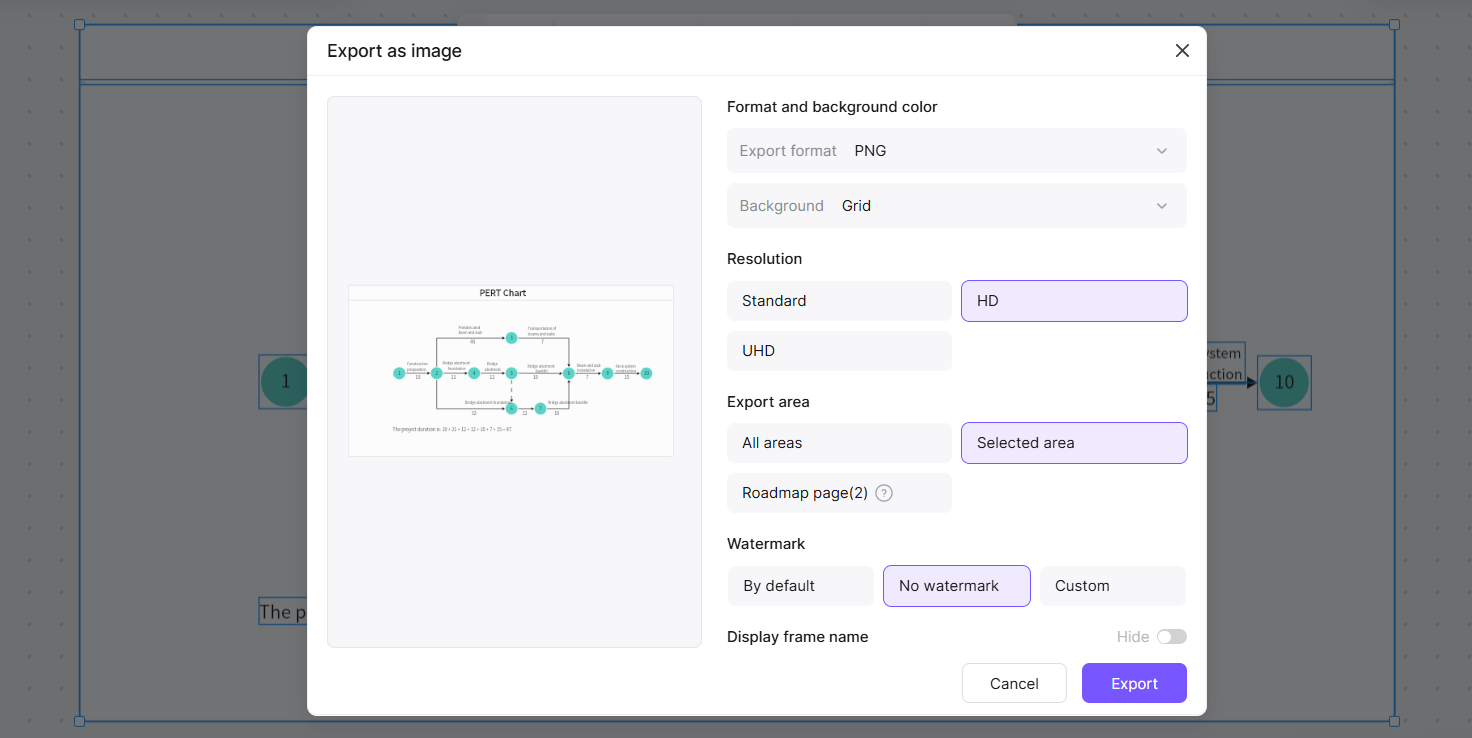
Once your flowchart is complete, you can save it directly to your Boardmix account or export it as an image or PDF file. This makes it easy to share your flowchart with others, whether for review, presentation, or inclusion in documents.
Boardmix Features for Flowchart Creation
- Intuitive Interface
Boardmix's interface is designed with user experience in mind. Its clean layout and straightforward navigation make it easy for both beginners and experienced users to create flowcharts without a learning curve.
- Variety of Shapes and Symbols
The platform's extensive library of shapes and symbols ensures that you have the right tools to represent every element of your process accurately. From standard flowchart symbols to custom icons, Boardmix has you covered.
- Real-Time Collaboration
Boardmix's real-time collaboration feature is a game-changer for teams working on projects together. It allows multiple users to work on the same flowchart simultaneously, with changes updating instantly for all collaborators.
- AI Assistance
Boardmix's AI capabilities extend to flowchart creation, where the platform can suggest relevant topics or nodes based on the central idea. This AI assistance can help users quickly expand their flowchart and ensure that all aspects of a flowchart are covered.
Tips for Choosing Suitable Flowchart
- Align with Purpose
Choose the diagram for the question you need to answer: a flowchart for process steps and decisions, a Gantt chart for a project schedule, or an organization chart for reporting relationships. Gantt and organization charts serve different purposes; they are not process-flowchart types.
- Simplify and Organize
Keep your flowchart simple and well-organized. Remove unnecessary details and group related steps or components together for clarity.
- Use Standard Symbols
Adhere to standard symbols and conventions to ensure that your flowchart is universally understood.
- Maintain Consistency
Ensure consistency in style, color, and formatting across your flowchart for a professional appearance and ease of understanding.
- Utilize Appropriate Tools
Use tools like Boardmix that offer templates, drag-and-drop functionality, and collaboration features to create professional-looking flowcharts.
Conclusion
Flowcharts are a powerful communication tool that can transform the way we understand and interact with complex processes. By exploring the different types of flowcharts and leveraging the features of Boardmix, you can create visual representations that are not only aesthetically pleasing but also highly functional. The key to successful flowchart creation lies in understanding your purpose, choosing the right type, and using the appropriate tools to bring your vision to life. As you continue to refine your flowcharting skills, remember that clarity and simplicity are paramount. With practice and the right tools, you'll be able to create flowcharts that are as effective as they are informative, unlocking new levels of efficiency and understanding in your work.