A BCG matrix compares products or business units using market growth and relative market share. AI can help organize a draft, but the placement depends on the market definition and data you supply. A neat diagram cannot resolve missing or unreliable market evidence.
Define the Two Axes
Use market growth for the vertical axis and relative market share for the horizontal axis. Relative share compares your share with that of the largest competitor in the defined market; it is not simply your percentage of total sales.
Agree on the market, period, and threshold used to separate high and low values. Place products into the familiar four categories: stars, cash cows, question marks, and dogs. The labels organize discussion; they do not make an investment decision by themselves.
Prepare the Inputs Before Using AI
Create a table containing each product, its defined market, the measurement period, market growth, your share, the leading competitor’s share, and the data source. Mark estimates as estimates. If a value is unknown, leave it open rather than asking the model to invent it.
What AI Can Add
AI can draft a layout, explain a proposed classification, or suggest questions for the team. Ask it to use the supplied figures and state any assumptions. Review every placement: a confident response can still use the wrong denominator or mix data from different periods.
Set Up a Shared Board
In Boardmix, place the matrix beside the input table and its sources. Keep related project timelines or SWOT notes in separate frames. Share the board link with the people who will review the portfolio, using appropriate permissions.
Use your existing meeting application to discuss the board and share your screen. Upload or link to the evidence you need rather than assuming a native connection to Slack, Teams, Google Drive, or Dropbox.
Create and Refine the Matrix
- Choose a BCG matrix template or draw the axes and four quadrants.
- Add the market definition, period, and threshold labels.
- Supply your input table to the AI assistant and request a draft classification.
- Check the calculations and move any items that were classified incorrectly.
- Add a note explaining uncertain placements and the evidence needed to resolve them.
- Share the board for discussion and export a snapshot for the meeting record if needed.
Example prompt: “Use the attached portfolio data to propose a BCG matrix. Calculate relative market share against the largest competitor in each market. Keep unknown values unclassified and explain the assumptions behind each placement.”
An Illustrative Portfolio Discussion
Suppose a software company has a mature storage product and a newer writing product. Before labeling one a cash cow and the other a question mark, the team needs evidence about each market’s growth and its relative share. Product age alone does not establish the category.
Here is a worked example using invented figures for four products in one annual reporting period. Each row defines a separate product market. Market growth describes the whole market, not the growth of the company’s own sales. For this exercise, growth above 10% is high and relative share above 1.0 is high; values on either boundary need an explicit classification rule.
| Product and defined market | Market growth | Relative share calculation | Quadrant |
|---|---|---|---|
| Analytics: team analytics software | 18% | 30% ÷ 20% = 1.5 | Star |
| Storage: business cloud storage | 4% | 60% ÷ 30% = 2.0 | Cash cow |
| Writing: writing-assistance software | 16% | 10% ÷ 20% = 0.5 | Question mark |
| Legacy utility: desktop file utilities | 2% | 8% ÷ 20% = 0.4 | Dog |
In each calculation, divide our market share by the largest competing company’s share in that same market and period. For Analytics, 30 ÷ 20 = 1.5: its share is one and a half times the competitor’s share. Combined with 18% market growth, it belongs in the high-share, high-growth quadrant. Do not divide 30% by total market sales again; both percentages already use that market as their base.
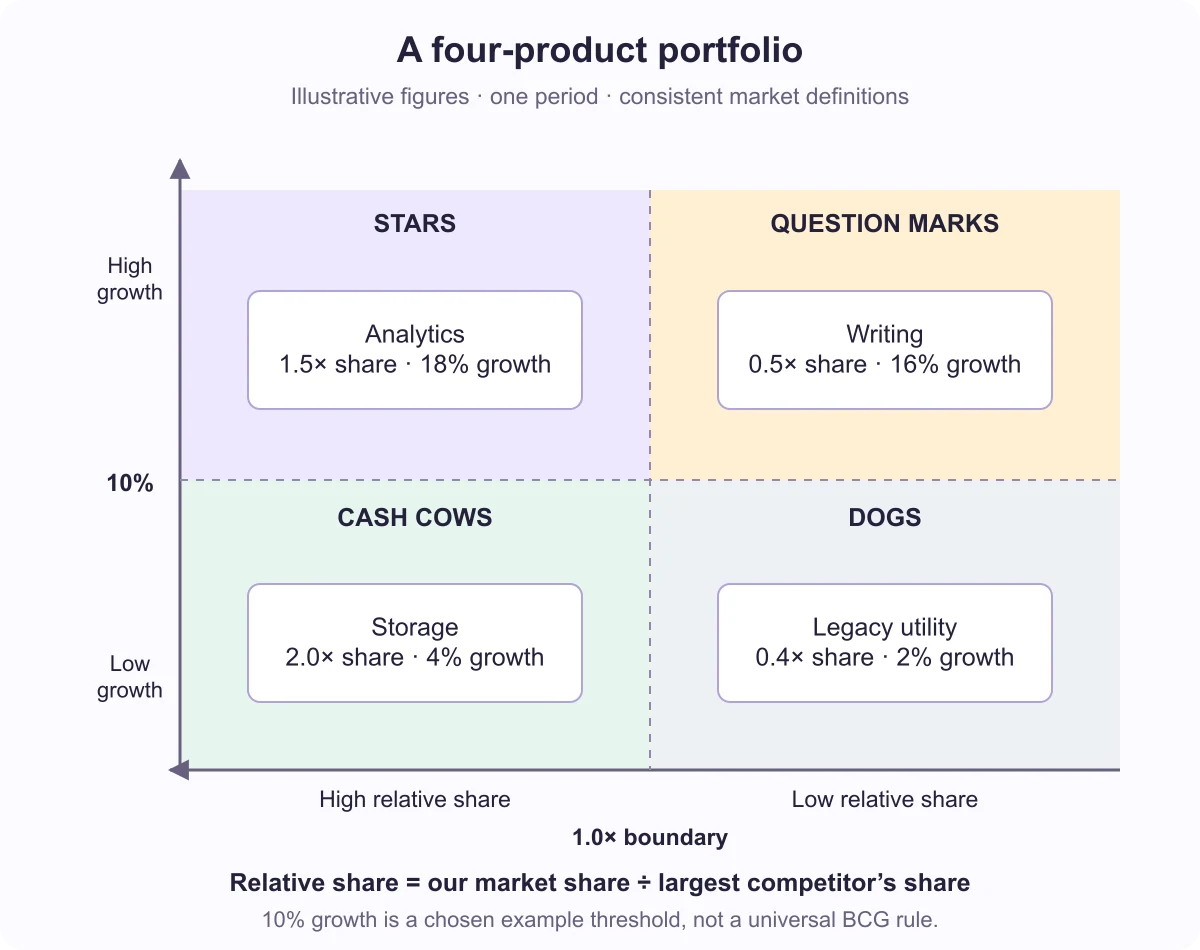
When asking AI to draft this matrix, provide the table and thresholds together. The expected placement is Analytics in Stars, Storage in Cash Cows, Writing in Question Marks and Legacy utility in Dogs. If it places Writing among the Stars because its market is growing quickly, correct the missing share test: 0.5 is below the 1.0 boundary.
BCG’s explanation of the growth-share matrix describes the four combinations of market growth and relative share.
The discussion can then consider cash generation, investment needs, customer retention, and strategic fit. These additional factors may change what the team decides to fund, even when the matrix placement is clear.
Use the Matrix as a Starting Point
Keep source dates beside the figures and revisit the matrix when the evidence changes. Compare the result with customer needs, margins, and operational constraints. A BCG matrix is one view of the portfolio, not a forecast of future success.
Make the Next Decision Clear
End the discussion with the decision being considered, the evidence still needed, and who will bring it back. Use the shared board to keep these points beside the matrix so the next conversation starts from the same information.