


A Mermaid Gantt chart turns plain-text project data into a timeline of task bars, sections, dependencies, and milestones. To build one, start with gantt, set a date format, add sections and tasks, then validate dates, durations, and dependencies before you share the schedule.
This guide focuses on the Gantt syntax people need for a real project plan. The examples use ISO dates and business-day exclusions; change the dates and labels to fit your project. Mermaid's current documentation remains the final reference when a renderer or version behaves differently.
1. What Is a Mermaid Gantt Chart?
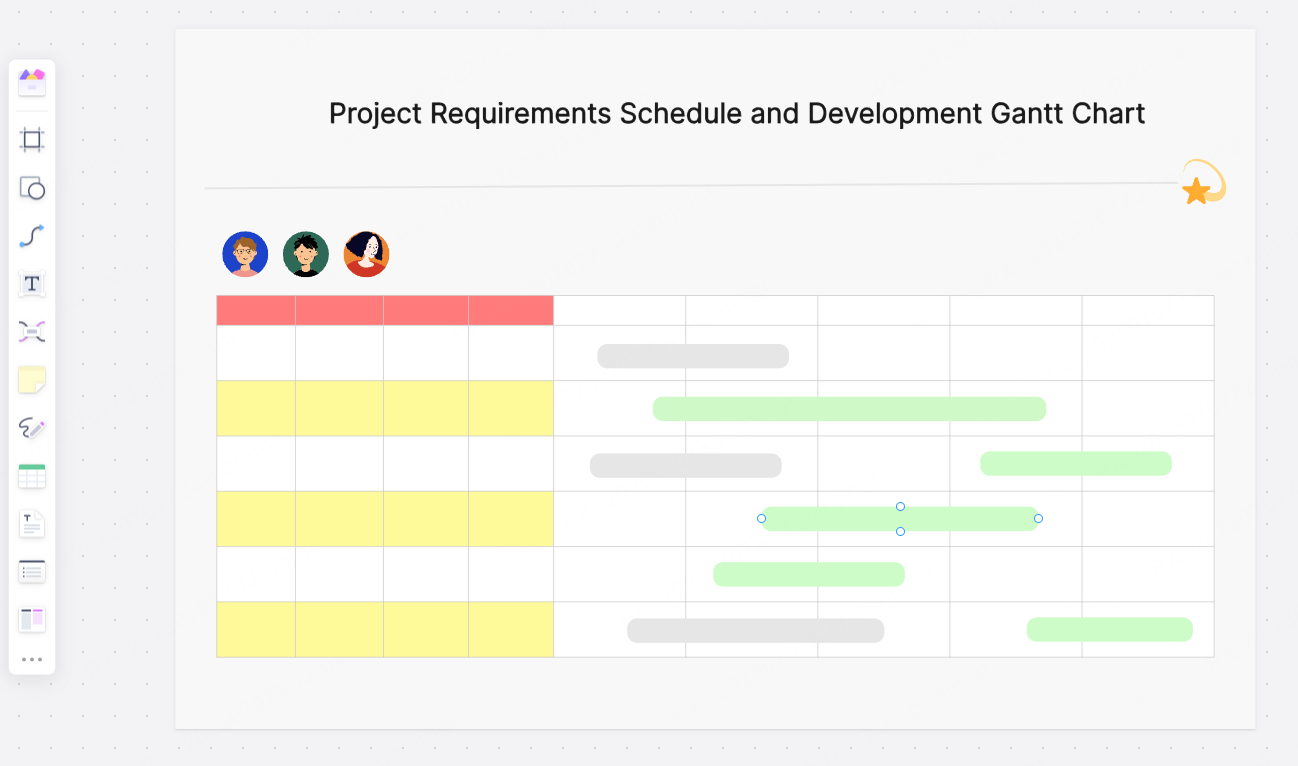
A Gantt chart is a time-based view of work: the horizontal axis represents dates and each row represents a task or milestone. Mermaid generates that view from text, which makes the source easy to review in documentation, version control, or a planning discussion. It is a good fit when the reader needs sequence, duration, or dependency information rather than a free-form brainstorm.
Mermaid is not a replacement for a full project-management system. The diagram communicates the schedule you write; it does not automatically know whether an estimate is realistic, whether a dependency is complete, or whether a team has capacity. Treat the rendered chart as a shared explanation of the plan, then confirm the underlying dates with the people doing the work.
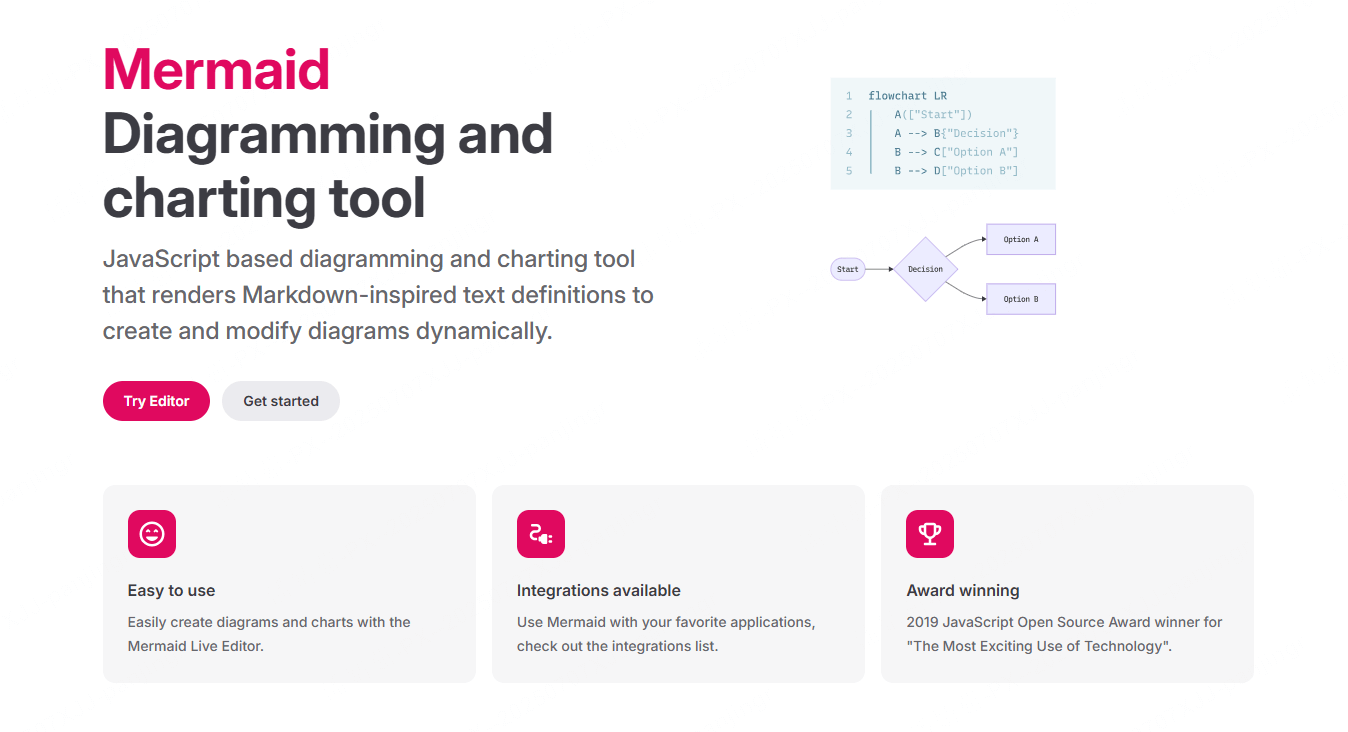
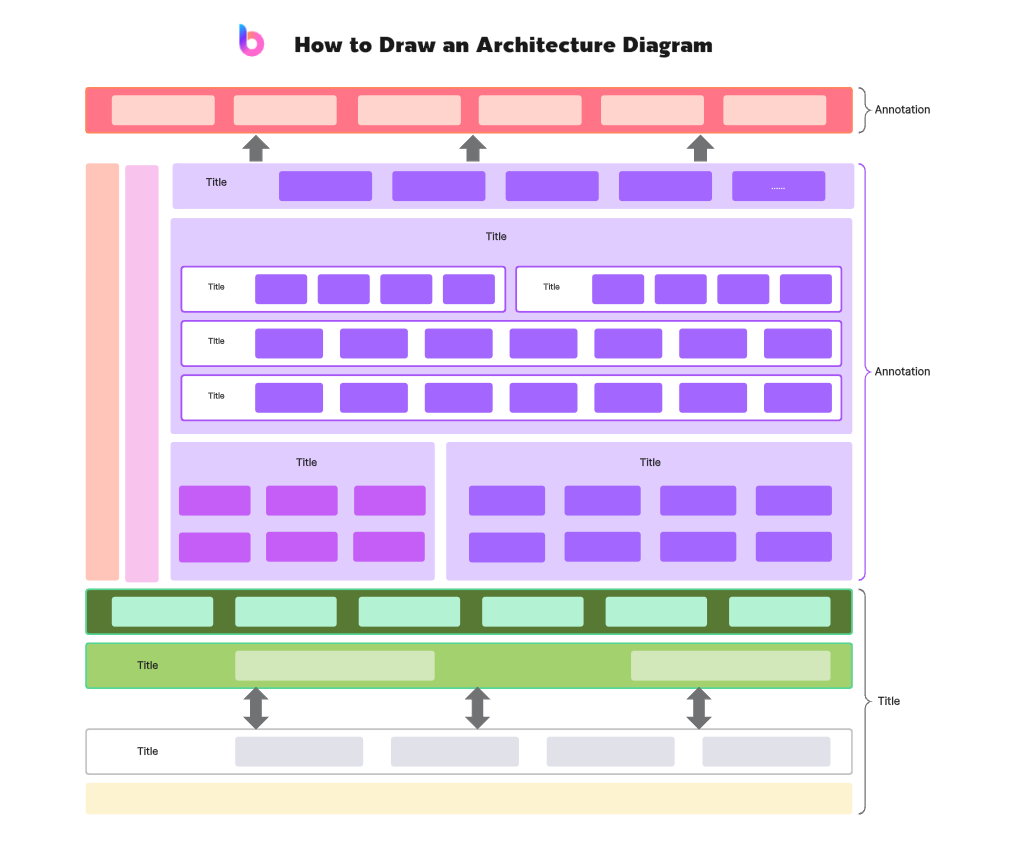
The original diagram above illustrates the text-to-visual workflow. For the Gantt-specific grammar, start with the official Mermaid Gantt syntax reference and the copyable example below.
2. Mermaid Gantt Chart Syntax and How to Build One
Step 1: Define the chart and its time axis
The first lines establish the diagram type, optional title, input date format, and the labels readers will see on the axis. dateFormat controls how Mermaid reads task dates; axisFormat controls how the rendered axis is displayed. They are related but not interchangeable.
gantt
  title Product launch plan
  dateFormat YYYY-MM-DD
  axisFormat %b %d
  excludes weekends
excludes weekends is useful for a business-day plan. It changes duration calculation rather than drawing a hole inside a task bar, so explain the rule to anyone using the chart for a deadline.
Step 2: Add sections, tasks, and dependencies
Use section to group work. A task line can contain a status tag, an ID, a start date or dependency, and a duration or end date. IDs matter because a later task can refer to them with after.
section Discovery
Research users       :done, research, 2026-10-01, 5d
Approve scope        :crit, scope, after research, 2d

section Delivery
Build release        :active, build, after scope, 7d
Quality review       :qa, after build, 3d
Launch               :milestone, launch, 2026-10-30, 0d
In this example, scope starts after research, build starts after scope, and launch is a single-date milestone. The done, active, and crit tags communicate status or importance; they do not replace a project decision about whether the work is actually complete.
Choose a duration when the work has an estimate, such as 5d or 2w. Choose an explicit end date when the work has a fixed deadline. If a task must remain open until another task or milestone begins, the current syntax also supports until taskId; check the renderer version before relying on newer directives.
For a busy schedule, keep IDs short and stable, use one section per phase, and set the axis interval only when the default labels are too dense. A vertical marker can call out a launch or review date without adding another task row. These small choices make a chart easier to scan without changing its underlying dependency model.
Step 3: Render, inspect, and share
- Render the smallest block first. Start with one section and one task so a syntax error is easy to isolate.
- Check the calendar math. Confirm whether a duration includes weekends, excluded dates, or a task that starts after another task's end.
- Check the dependency IDs. A typo in an ID can make a task appear to start in the wrong place or fail to render.
- Review the visual result with the team. A readable chart should make the critical path and the next decision obvious without opening the source.
The same text-first workflow can create other diagrams, but their grammar is different. Keep the examples below as context rather than copying flowchart or sequence syntax into a Gantt block.
flowchart LR
  A[Brief] --> B[Build]
  B --> C{Review}
  C -->|approved| D[Launch]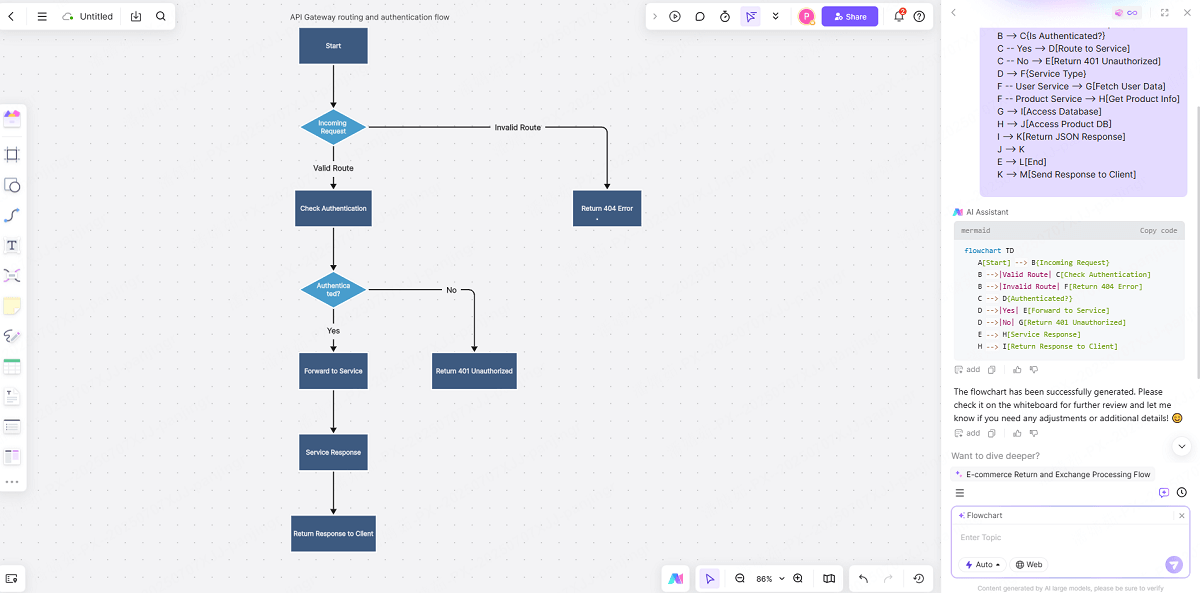
Flowcharts use nodes and arrows to describe logic. They are useful beside a schedule when a release has a decision path, but they do not express task duration by themselves.
sequenceDiagram
  participant PM
  participant Team
  PM->>Team: Share the schedule
  Team-->>PM: Confirm dependencies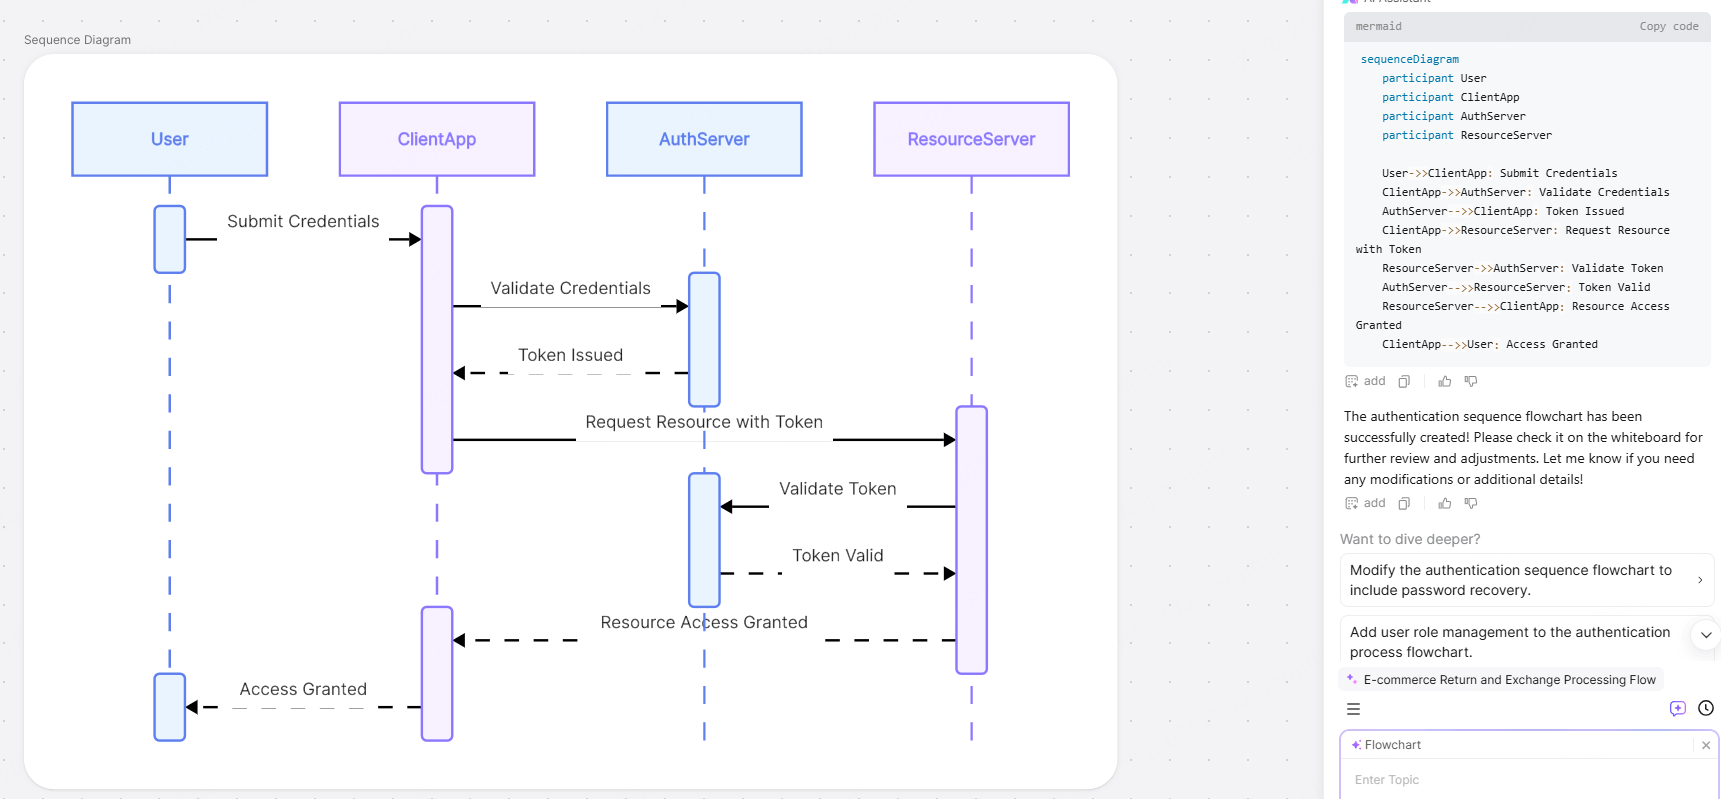
Sequence diagrams describe interactions over time. Use them for an API or team hand-off narrative, and keep the Gantt chart for the calendar-level plan.
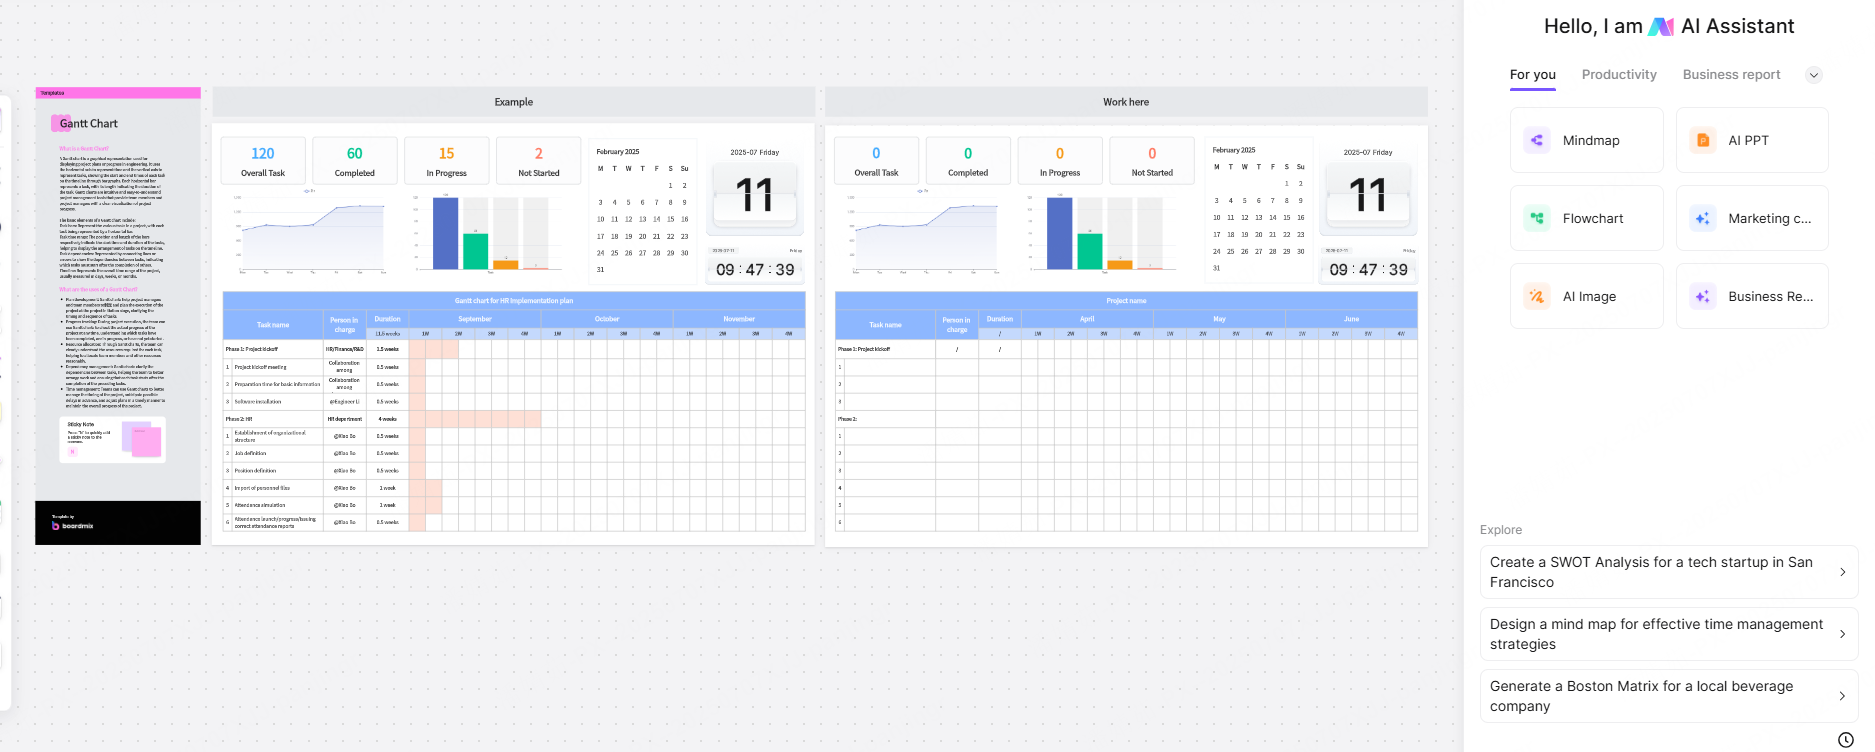
A Gantt template can be a faster starting point when the schedule needs visual editing or when the team is not comfortable maintaining diagram code. The Boardmix Gantt chart templates page is a separate visual-planning option; it does not change the Mermaid syntax above.
3. Common Mermaid Gantt Chart Errors and Validation Checks
Most broken charts come from a small set of predictable mistakes. Fix the source before changing the layout or adding more tasks.
- Date-format mismatch: If
dateFormatsaysYYYY-MM-DD, use four-digit years and two-digit months and days in the task lines. Do not mix display formatting with input formatting. - Unstable or misspelled IDs: Give dependent tasks short, unique IDs and check every
afterreference. A task title is not automatically a safe dependency ID. - Special characters in labels: Brackets, braces, colons, and punctuation can be interpreted as syntax. Quote or simplify a label when the renderer treats its characters as structure.
- Indentation and unsupported directives: Keep section and task lines consistently indented. Check the current Mermaid documentation before using a feature supported only by a newer version or a particular editor.
- Unexpected weekend behavior: An exclusion extends a task's bar to preserve its stated duration; it does not necessarily create an empty gap inside the bar. Compare the rendered result with the work calendar.
- Overloaded chart: Split a schedule into sections or smaller diagrams when labels become unreadable. A shorter chart with explicit dependencies is more useful than a dense chart that no one can review.
Before publishing a schedule, ask: Does every task have an owner and a realistic duration? Are milestones anchored to a date or dependency? Does the critical path match the team's understanding? Can a new reader tell what happens next without reading every line of source?
For a dependable handoff, keep the source text next to the rendered diagram and record the date format, exclusions, and renderer used. If someone changes a task date later, they can update the source and regenerate the image instead of editing a stale screenshot by hand.
4. Mermaid Gantt Chart Examples for Real Projects
The same pattern works across different planning situations. Change the sections and task names, but keep the sequence of header, sections, task metadata, and validation.
- Product release: Use Discovery, Delivery, and Launch sections. Mark approved scope as a dependency so engineering work cannot silently start before the decision.
- Documentation rollout: Use research, draft, technical review, and publish tasks. Add a milestone for the release note or version cut.
- Team onboarding: Use sections for access, training, and first delivery. Exclude company holidays only when the plan is intended to count working days.
- Marketing campaign: Link creative review, legal approval, channel setup, and launch. Keep the final launch date explicit so downstream teams can see the commitment.
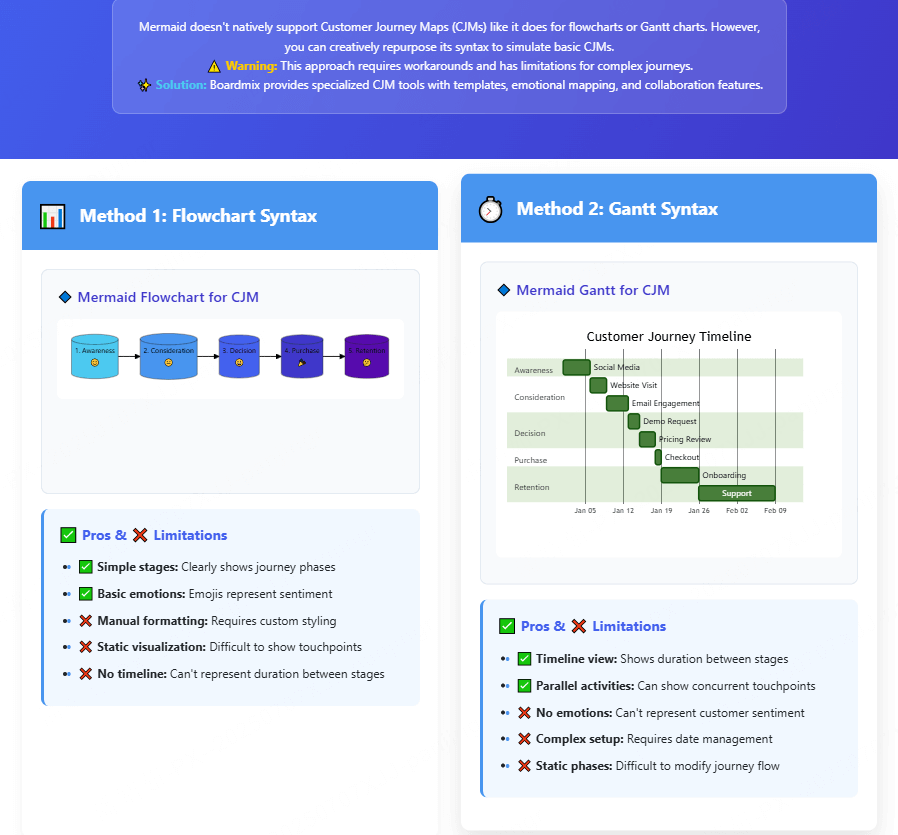
The customer-journey image is useful when the planning question is about experience stages rather than calendar duration. It can sit beside a Gantt chart as an input to the plan, but it should not be presented as Mermaid Gantt syntax.
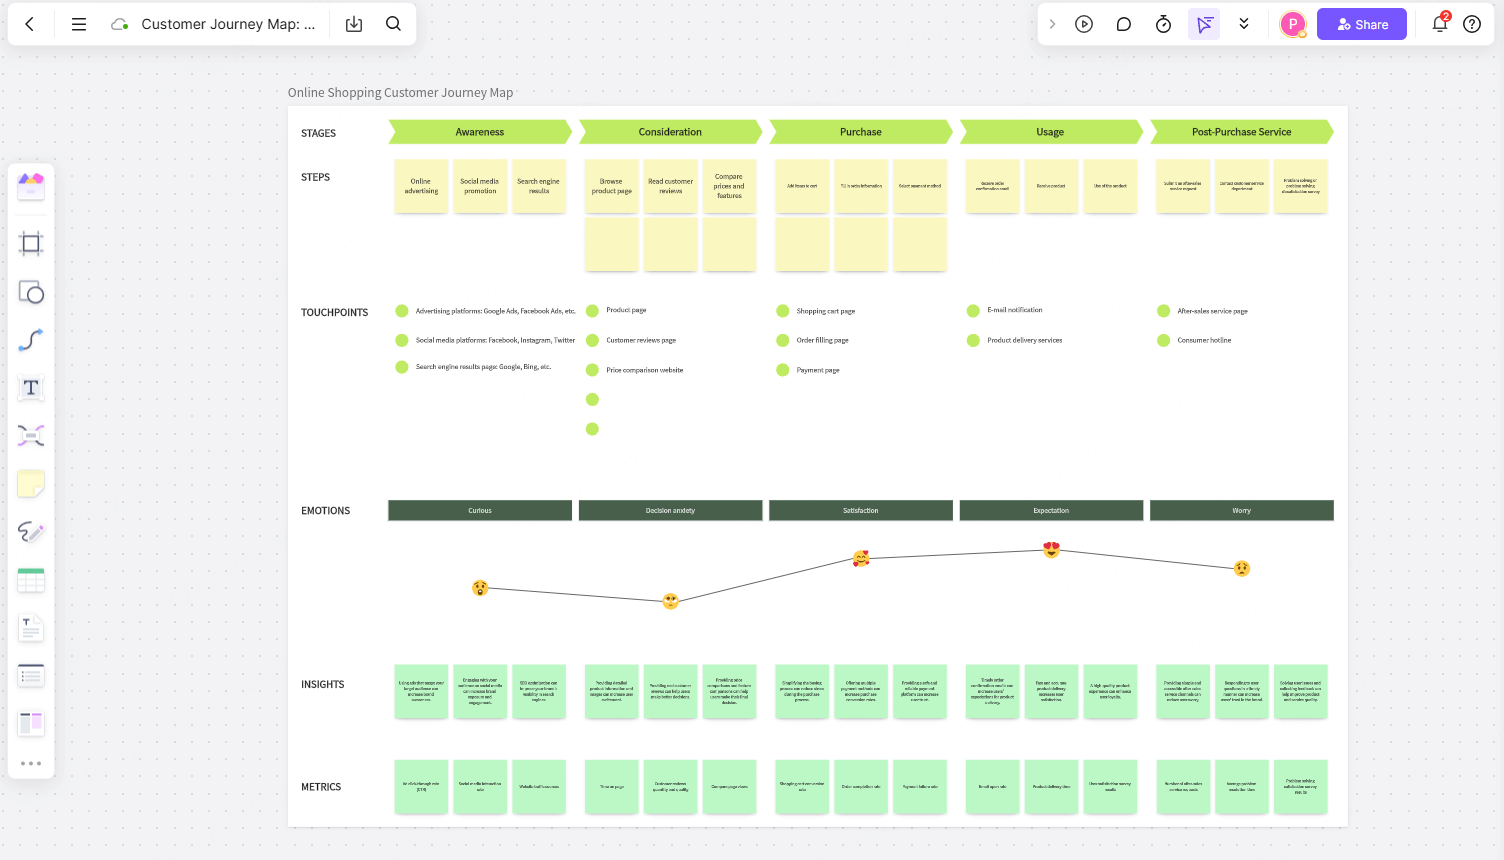
A journey map can expose hand-offs or pain points that become schedule tasks. Keep those observations separate from the date math so the Gantt remains easy to audit.
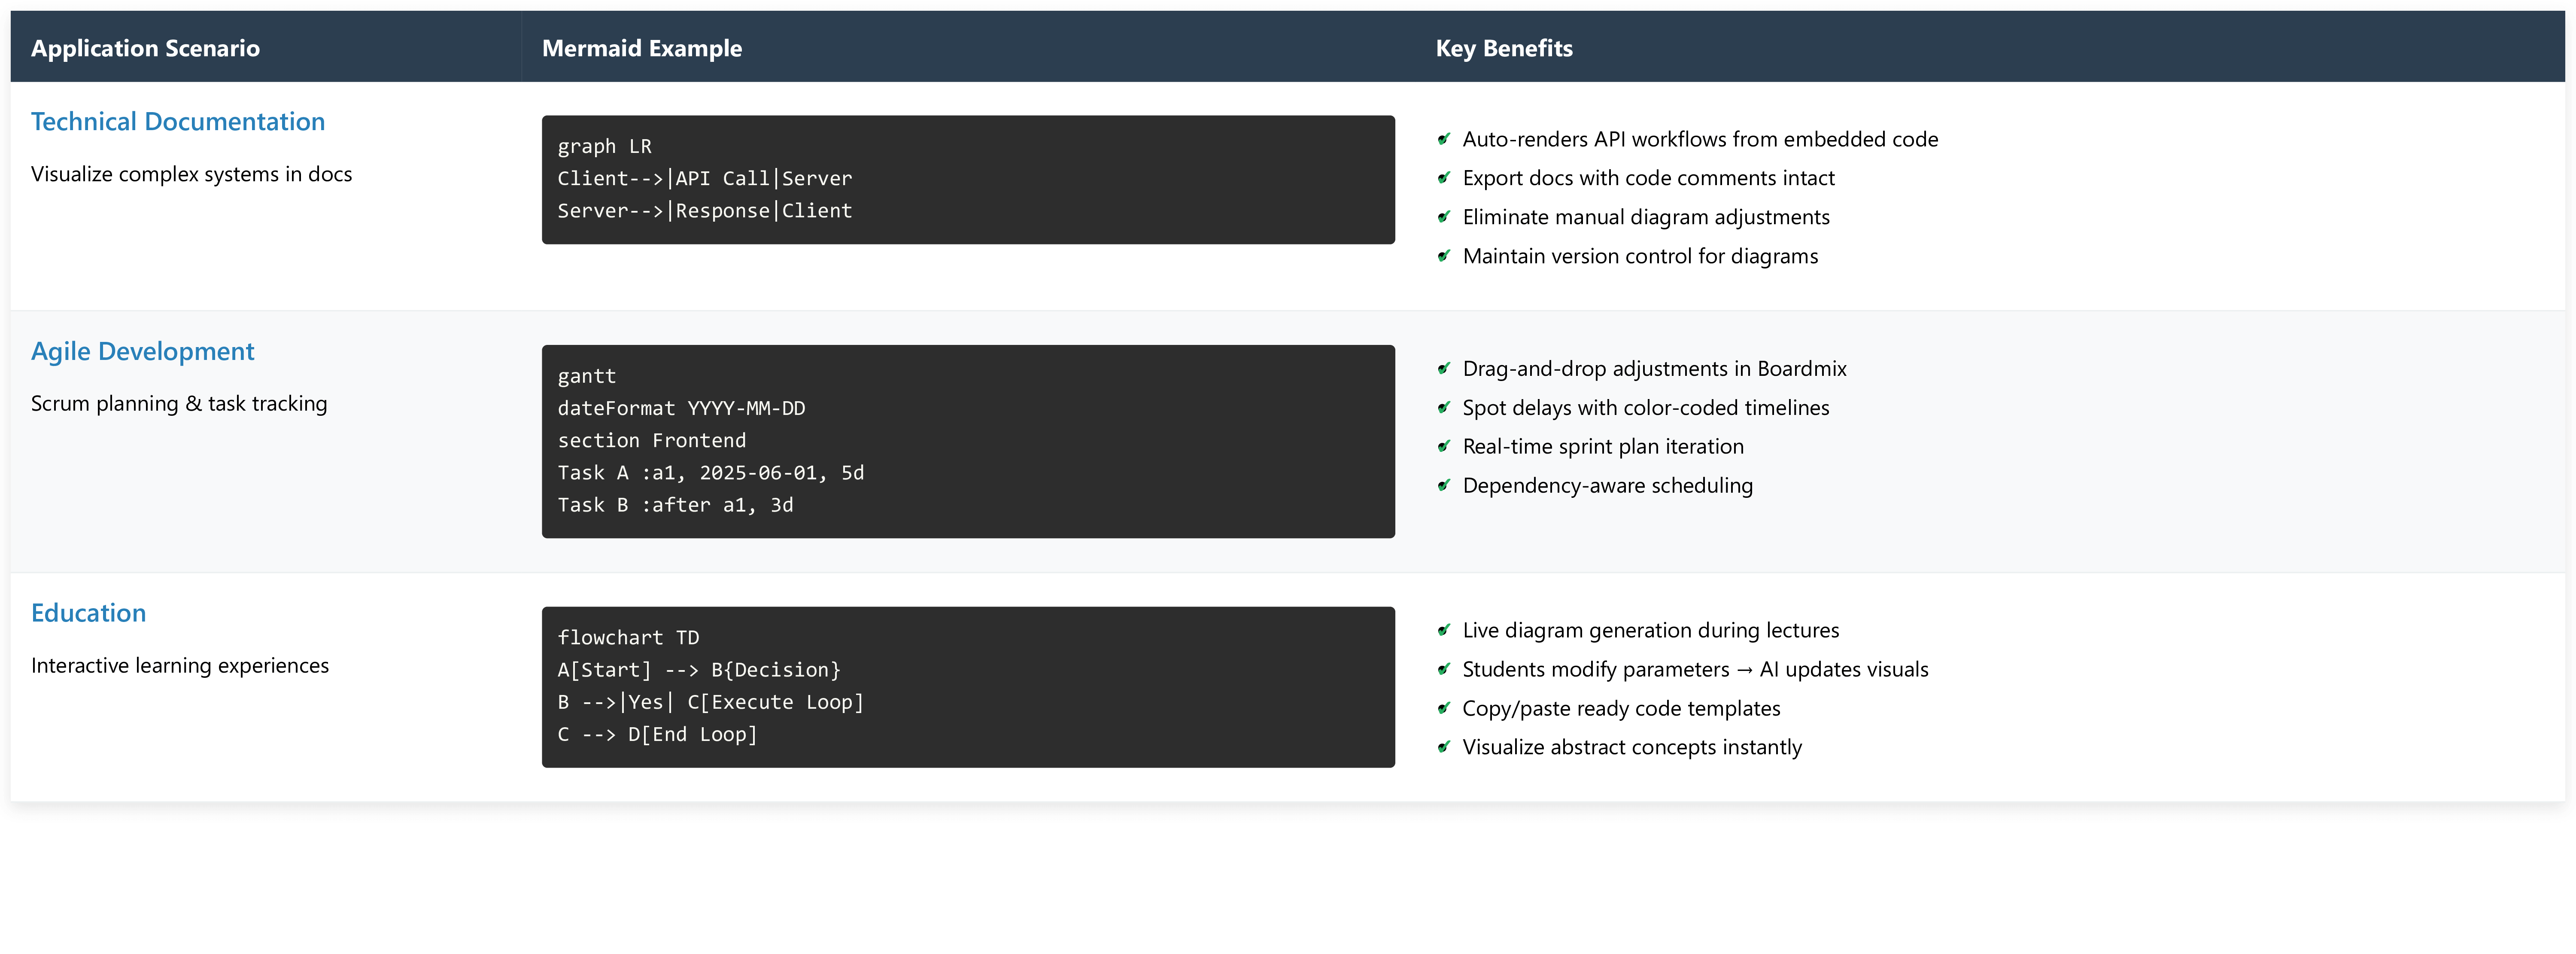
Use the final diagram as a visual review aid: compare the rendered output with the source, then ask collaborators to challenge assumptions before the plan becomes a commitment.
5. Using Mermaid Gantt Charts in Boardmix
Boardmix is an online collaborative whiteboard, so its strongest role here is the review layer around a schedule: place a rendered diagram on a shared canvas, group notes beside the relevant phase, collect comments, and connect the timeline to flowcharts or journey maps. That is different from promising that every Mermaid directive can be imported or that dragging a rendered bar always rewrites the source code.
If the current Boardmix workspace accepts your Mermaid input, test a small chart first and compare the rendered result with the source. For other diagram workflows, see the Boardmix Mermaid overview, the Mermaid editor comparison, or the Boardmix AI flowchart page. Product capabilities and plan limits can change, so verify the exact input, export, and collaboration behavior in the current workspace.
- Start with the source. Paste a small, valid Gantt block and confirm that the dates and dependencies render as expected.
- Add context on the canvas. Put assumptions, owners, risks, or a related flowchart beside the timeline rather than hiding them in task labels.
- Review together. Ask collaborators to comment on estimates and hand-offs, then keep the source and the agreed visual version together.
- Re-test after edits. A Boardmix canvas can make review easier, but the Mermaid source remains the authority for code-generated output.
6. Mermaid Gantt Chart FAQs and Takeaway
How do I make one task start after another?
Give the earlier task an ID, then use after taskId in the dependent task's metadata. If more than one task must finish first, reference each required ID and inspect the rendered start date.
Can a Mermaid Gantt chart exclude weekends?
Yes. Add excludes weekends after the date settings, or list specific excluded dates. The current Mermaid behavior extends a task to preserve its duration; it does not create an internal blank segment for every excluded day.
How is a milestone different from a task?
A milestone represents a point in time rather than a bar of work. Use the milestone tag and anchor it to an explicit date or dependency, then confirm that its visual position matches the decision it represents.
What is the difference between dateFormat and axisFormat?
dateFormat tells Mermaid how to parse the dates in your source. axisFormat changes the labels shown on the rendered time axis. Changing the second does not repair an invalid input date.
Should I use a duration or an end date?
Use a duration when the work is estimated in days or weeks and should move when its start moves. Use an end date when the deadline is fixed. State which assumption you chose so readers do not mistake an estimate for a commitment.
Why does my task start on the wrong date?
Check the input date format, the task's dependency ID, the preceding task's duration, and any exclusions. Render a two-task example first; once the dates are correct, add sections and the rest of the schedule.
In short: define the time axis, add sections and task metadata, connect dependencies with stable IDs, validate the calendar math, and review the rendered result with the people who own the work. That sequence makes a Mermaid Gantt chart useful without turning it into an opaque block of code.
Mermaid syntax and linked Boardmix references were reviewed on September 23, 2026. Check the current Mermaid documentation and Boardmix workspace before relying on version-specific behavior.