Mackenzie Carter contributes to the Boardmix blog, covering visual collaboration, diagramming, and ways to organize ideas. Explore guides on whiteboards, mind maps, workflows, and business analysis, alongside tool comparisons and examples.
Do you often find yourself indecisive among multiple risk strategies when dealing with project risks? Or perhaps you struggle to identify the key focus among various response strategies? This article will introduce you to some risk management strategies using the decision tree analysis template from the Boardmix online whiteboard. Project managers definitely shouldn't miss out on this, which helps you cope with difficulties at work.
Process diagrams are indispensable tools in various professional settings, aiding in the visualization and comprehension of complex workflows. In today's dynamic work environment, the integration of artificial intelligence (AI) has revolutionized the creation of process diagrams, enhancing efficiency and precision.
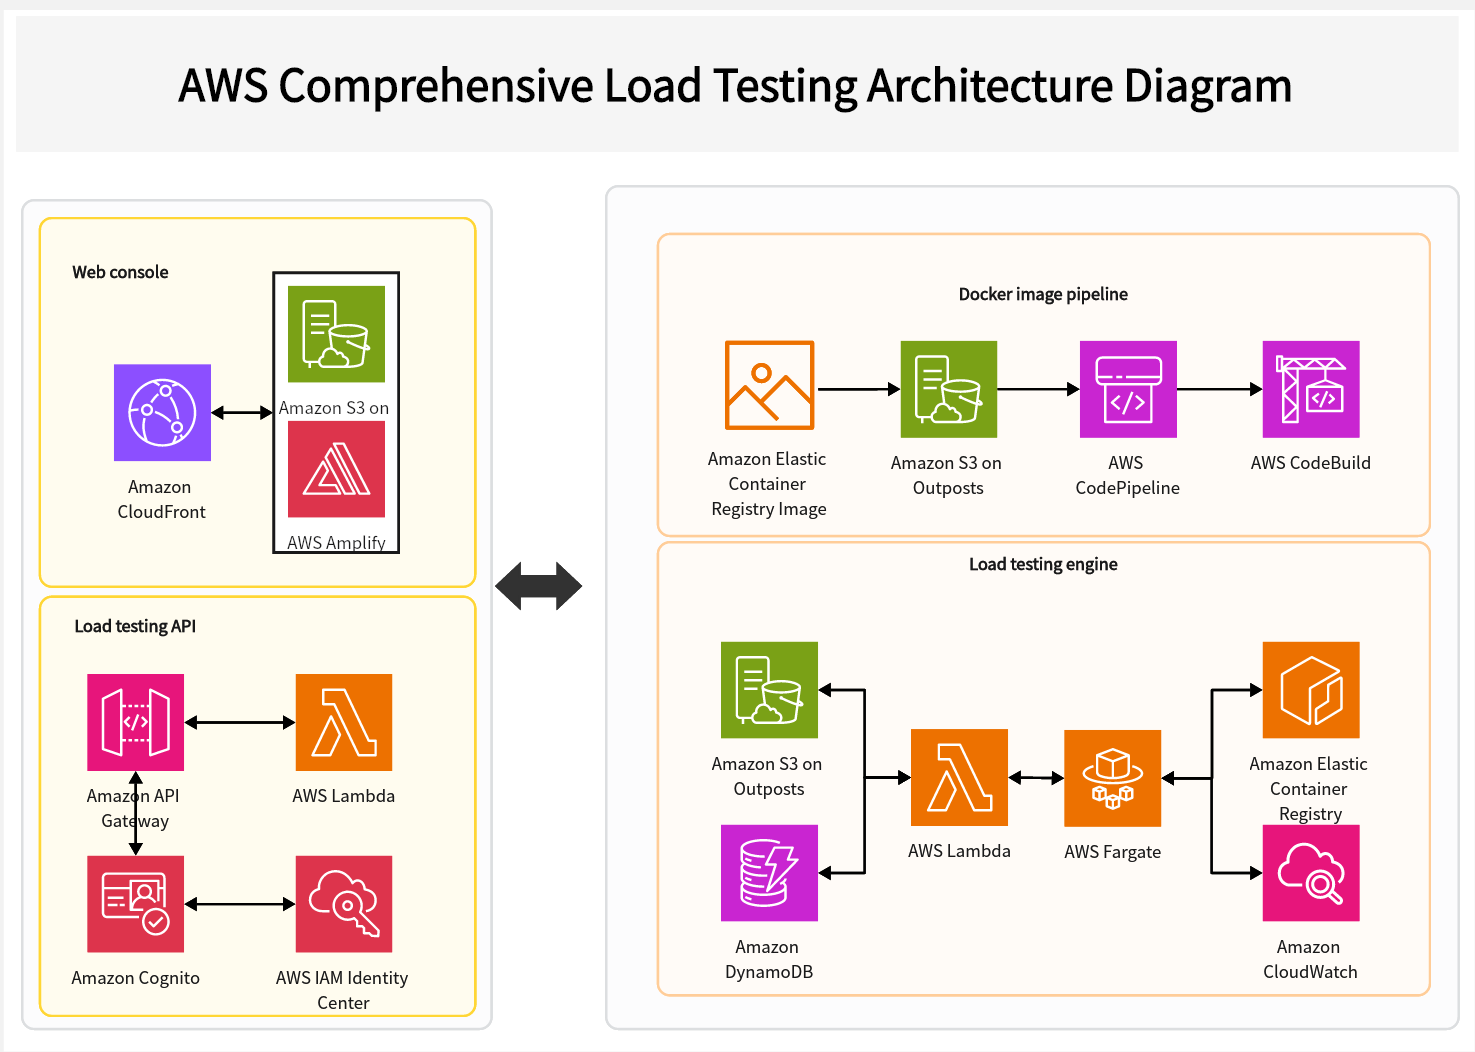
A design architecture diagram is a graphical way to represent the structure and organization of a system, software, or project. They illustrate the interactions and dependencies between different components, modules, or sub-modules within a system and the system's hierarchical structure and organization. With Artificial Intelligence (AI) technology's rapid development, designing design architecture diagrams has become more efficient and precise.
Exploring diverse Go-to-Market (GTM) strategies, including SaaS, Amazon, and Apple, reveals tailored approaches for market success. Understanding these strategies provides valuable insights for crafting effective B2B GTM plans.
The Go-to-Market Strategy Template by Boardmix offers a free, proven framework for businesses to launch products or services effectively. This Go-to-Market template empowers enterprises to navigate markets strategically and maximize their growth potential.
Learn what Go-to-Market Strategy is and the go-to-market strategy examples for startups. Dive into the world of Go-to-Market Strategy and help you build it instantly with the help of Boardmix.
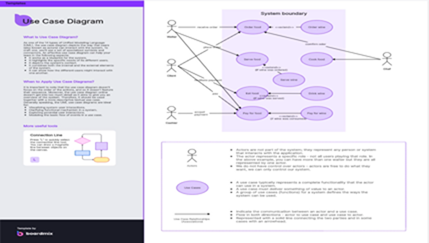
Use Case Diagrams are a type of UML (Unified Modeling Language) diagram, used to describe system being developed scenario. In essence, it describes how a potential user will interact with the system. During the analysis and design process, use case diagrams can serve as a means of describing customer needs and future system uses. They show the participants, use cases, and the relationships between them, describing the system's functions and often integrating with other charts.
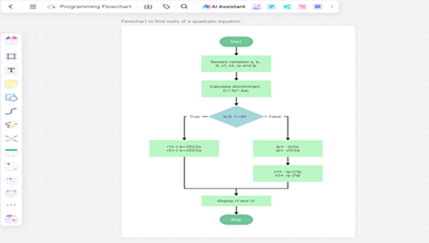
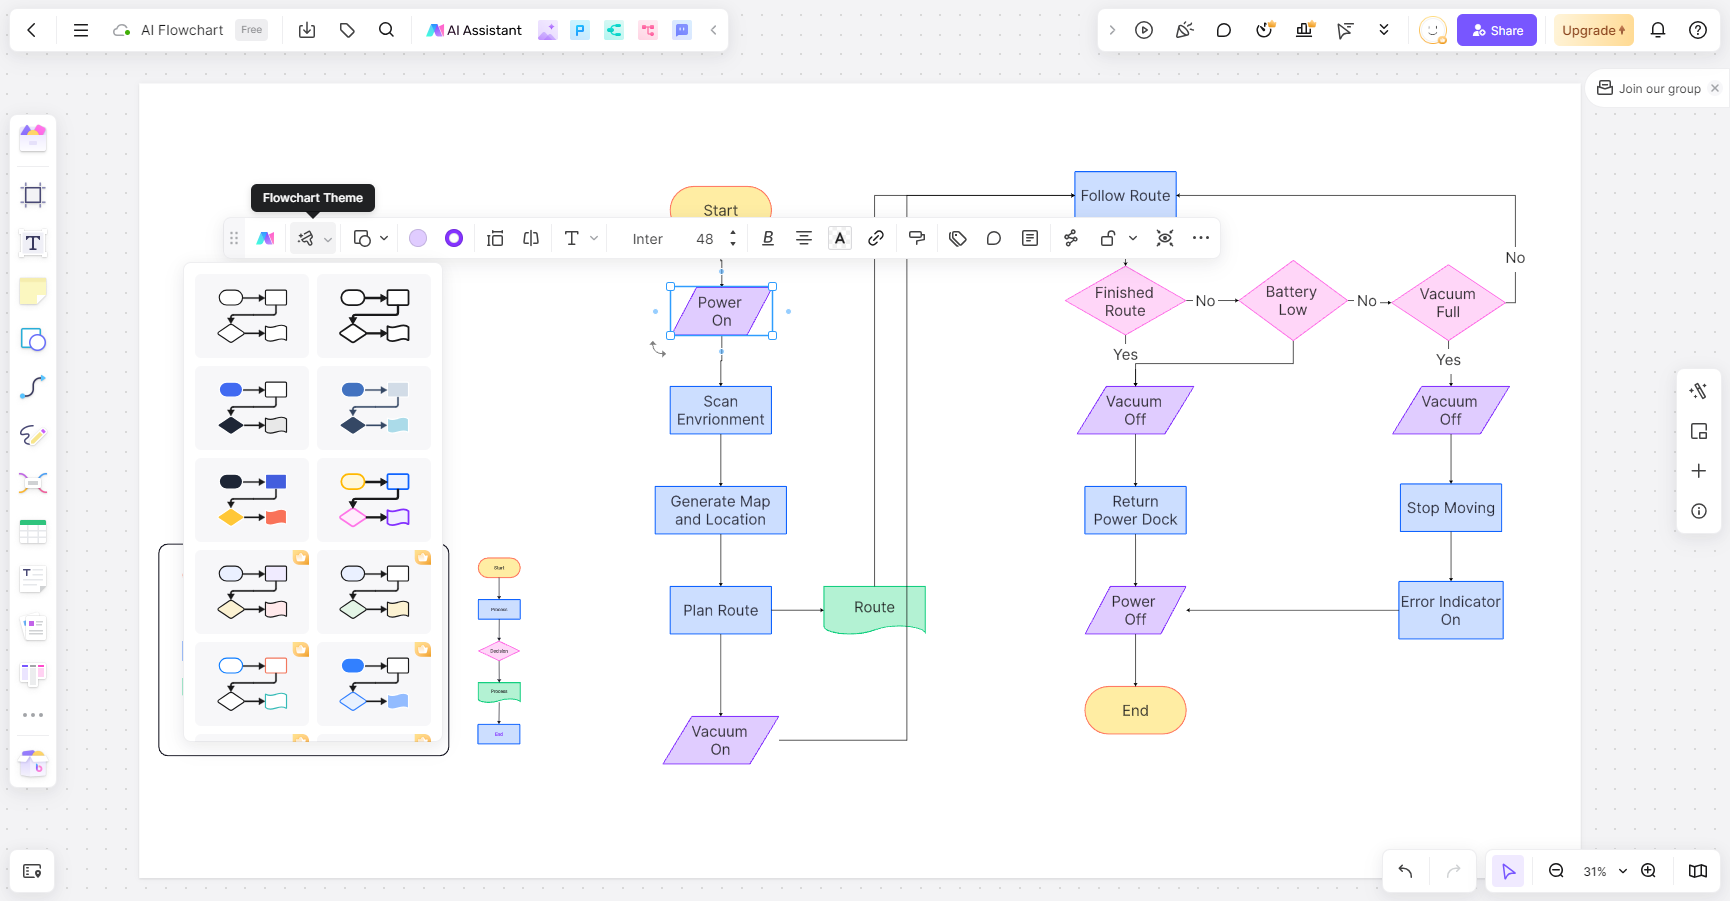
A program flowchart, also known as a process flow diagram, is a graphical representation that describes the specific steps of program execution using standardized symbols. The design of a program flowchart is based on the analysis of input and output data and processing procedures, marking the main operational steps and content of the computer.
Concept maps are tools that facilitate knowledge processing and also serve as a method for organizing and representing knowledge. They construct a clear knowledge network structure and are often utilized in educational and corporate sectors. To ensure meaningful learning, learners must connect new knowledge with previously learned concepts.
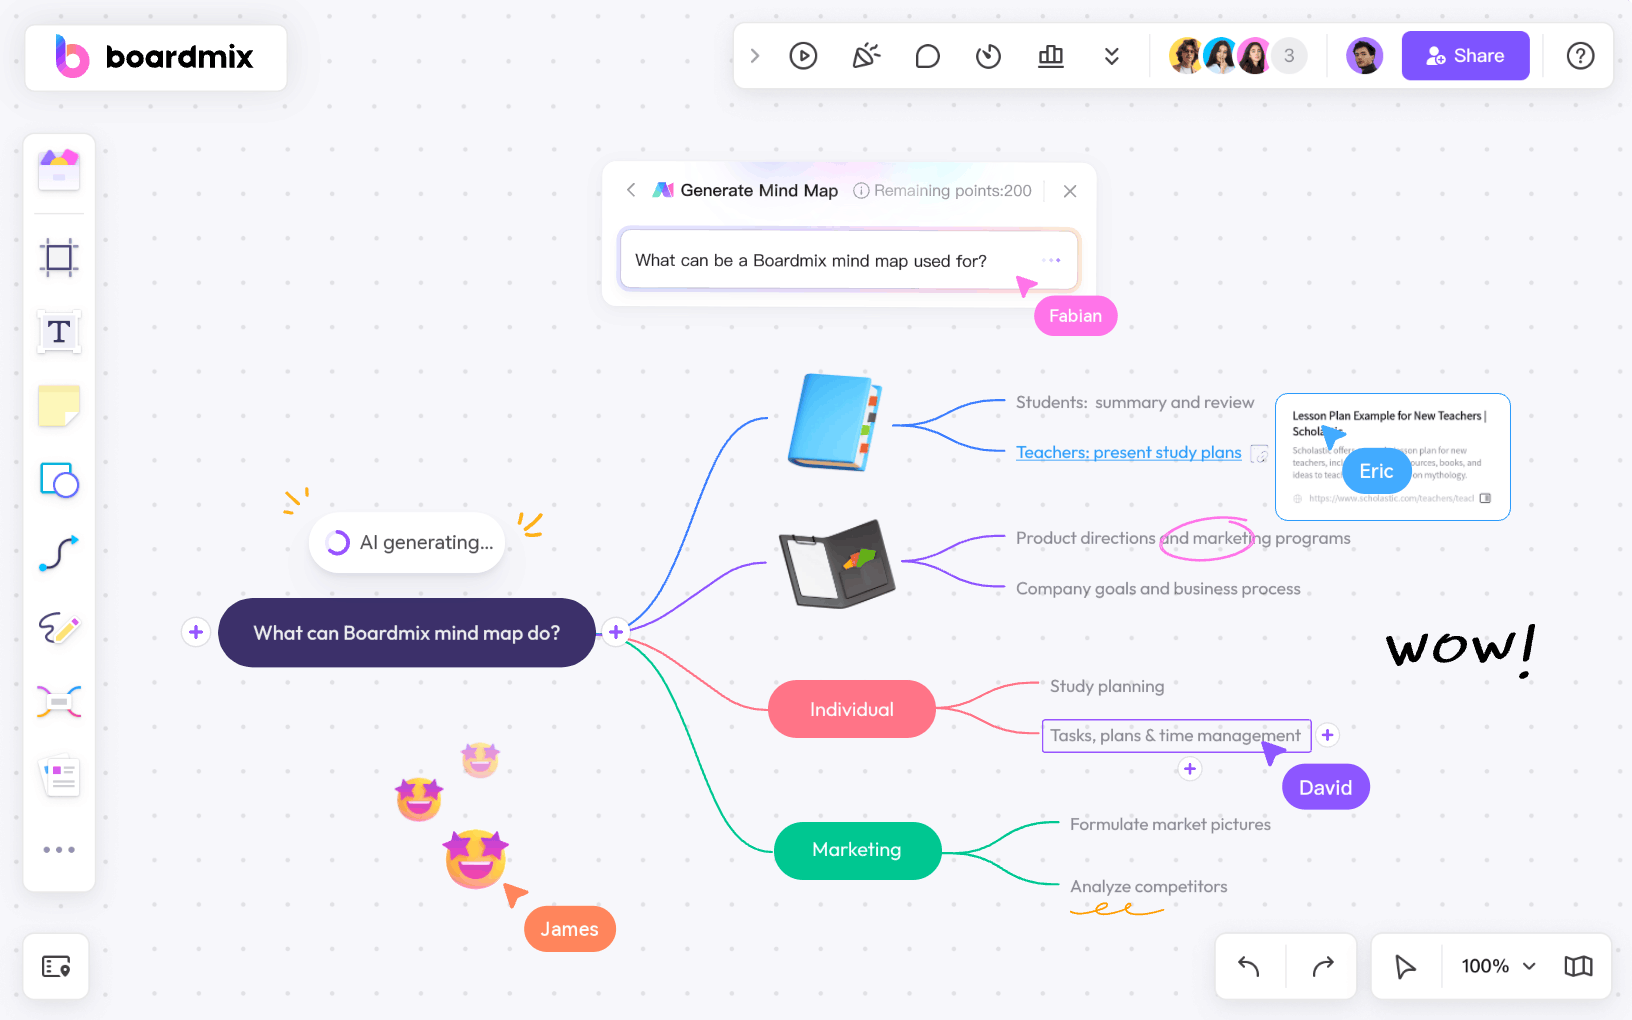
Nowadays, many software have developed web versions, and mind mapping software is no exception. This is evident as we can see a variety of online mind-mapping websites available.
In this exploration, we'll walk you through creating your visual customer journey map, leaving no detail unturned. Ready to gain fresh insights into your customer's experience? Let's embark on this journey together.
When businesses are transforming or facing growth challenges, choosing effective strategic planning methods and tools is essential for systematically analyzing and rethinking their strategy. This article introduces the classic SWOT analysis method and the professional BoardMix online whiteboard tool, which can help companies understand market opportunities, risks, strengths, and weaknesses.
In the digital age, architecture diagrams are crucial for understanding, designing, and communicating complex system architectures. Whether it's software development, network design, or project planning, clear and accurate diagrams guide and support these processes. Given that the wide range of options available, choosing the right software for creating architecture diagrams can be a challenge. To help you make the best choice, here's an overview of nine popular diagramming tools that are both powerful and user-friendly, essential for crafting your architecture diagrams.
This article, coupled with the collaborative online tool Boardmix Whiteboard, outlines the process of crafting a top-notch business plan tailored for college students. Its goal is to aid those gearing up for competitions or nurturing entrepreneurial ambitions.
A Brace Map template is a structured framework designed to visually break down a complex concept, object, or system into its parts. This type of template uses braces or brackets to organize and categorize information hierarchically, helping users understand the relationship between the whole and its parts. In Boardmix, you can find various templates of brace maps, which help you generate your expected content.
A brace map is a powerful thinking tool designed to bring clarity to complex concepts by visually breaking them down into their parts. By leveraging brace maps, you can gain a clearer perspective on any subject, allowing you to think more strategically and communicate more effectively. Discover how brace maps can transform your approach to organization and planning with Boardmix's flexible tools.
Elevate your work efficiency with our guide on 6 free flowchart software. Understand how these tools can significantly streamline your workflow, providing a clear and organized visual representation of processes.
In a rapidly changing business environment, maintaining a competitive edge requires more than just a solid strategy. This is where the McKinsey 7-S Model comes in, providing a comprehensive framework for achieving organizational alignment and effectiveness.
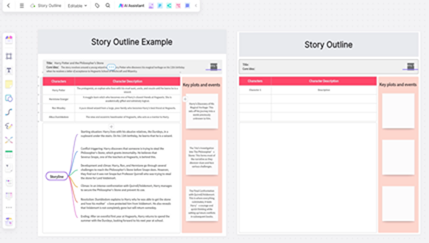
This article introduces 6 famous story outline examples and templates to help you understand the structure of storytelling, including Alice in Wonderland, Beauty and the Beast, Pinocchio, Game of Thrones, Harry Potter, and His Dark Materials.
Access free templates on Boardmix to create impactful problem statements. Explore practical examples and essential elements for crafting effective problem statements, vital for project success.
Unlock the power of brand identity prism templates with our downloadable and editable online resources. Learn how these tools can revolutionize your branding approach with real-world examples and practical guidance.
Embark on your journey to successful branding with the guide on the Brand Identity Prism. Understand what the Brand Identity Prism is and how it serves as a crucial tool for building a strong brand, and then learn how to use Boardmix to build your own Brand Identity Prism.
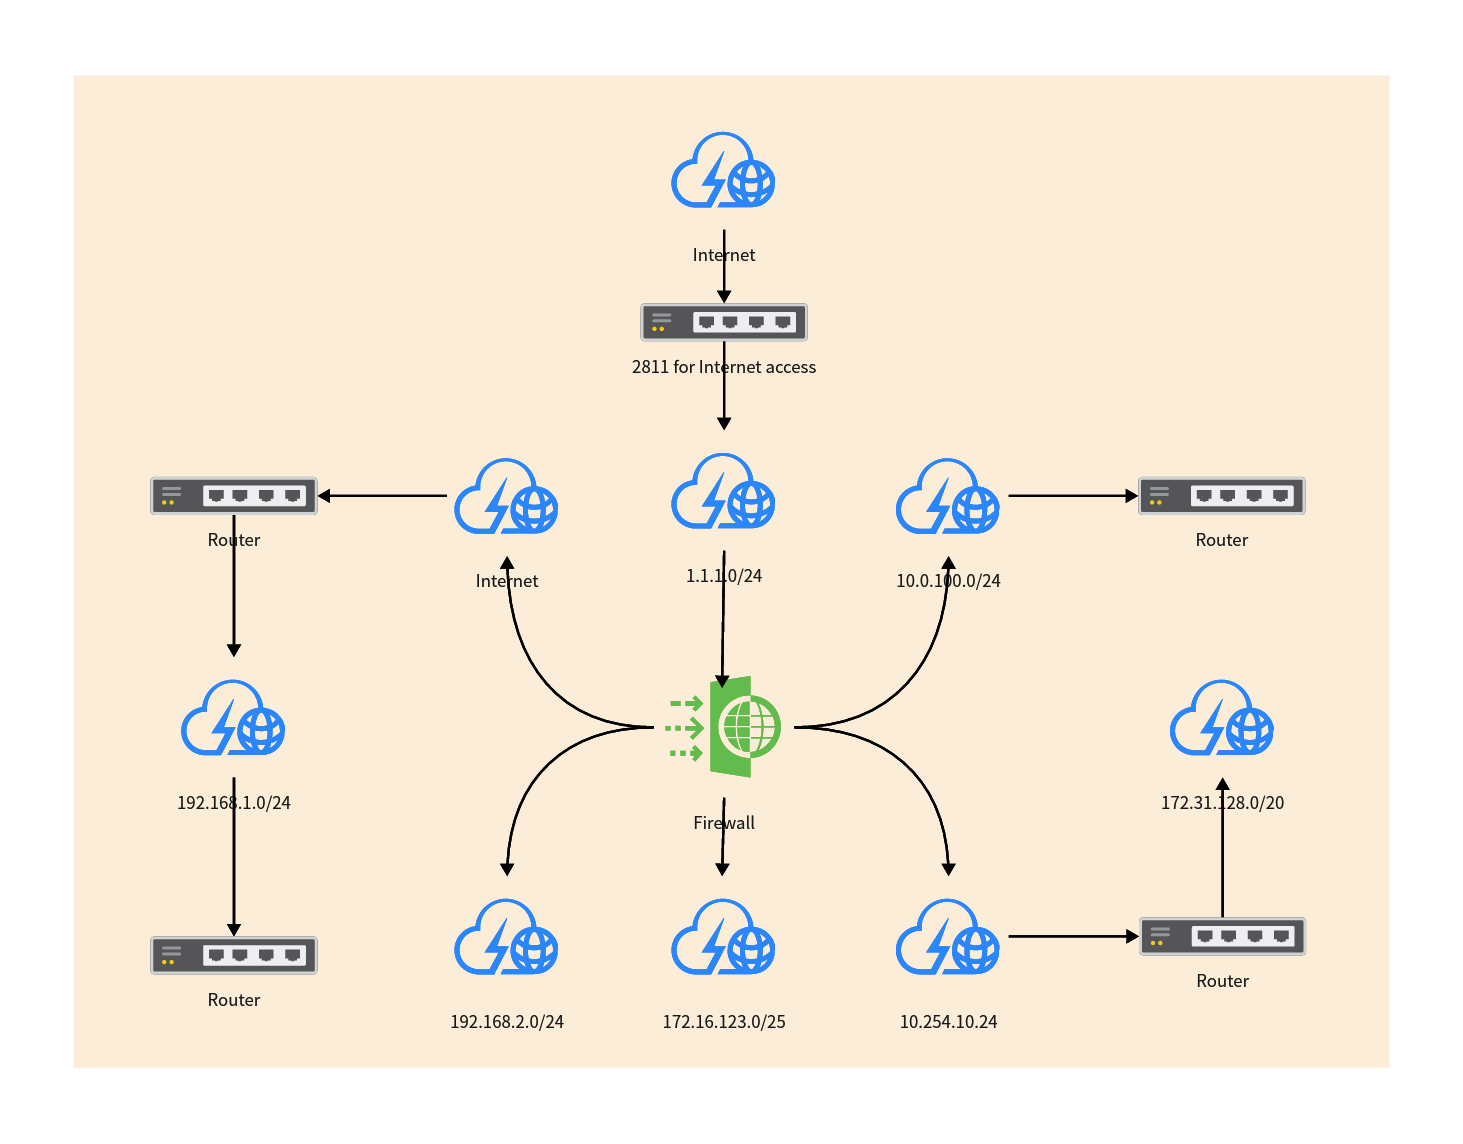
A network topology diagram is a visual representation of a computer network, which is the physical layout of various devices interconnected using transmission media, which also means how to connect computers and other devices in the network.