Mackenzie Carter contributes to the Boardmix blog, covering visual collaboration, diagramming, and ways to organize ideas. Explore guides on whiteboards, mind maps, workflows, and business analysis, alongside tool comparisons and examples.
Discover the revolutionizing AI Problem Statement Generator on Boardmix, a platform designed to simplify your journey towards effective problem-solving. Understand what a problem statement is and learn how to write a compelling problem statement that aligns expectations and improves overall problem-solving efficiency.
This article is a guide to an effective time management tool. It introduces a time management method called the Eisenhower matrix analysis, which can help us prioritize what we need to do, invest our limited time and energy into the highest-priority things, and help us say goodbye to being in a hurry and become a master of time.
Companies can communicate with consumers through product roadmaps. Through product roadmaps, consumers can understand the company's next product development plans and what users can expect from the products in the future.
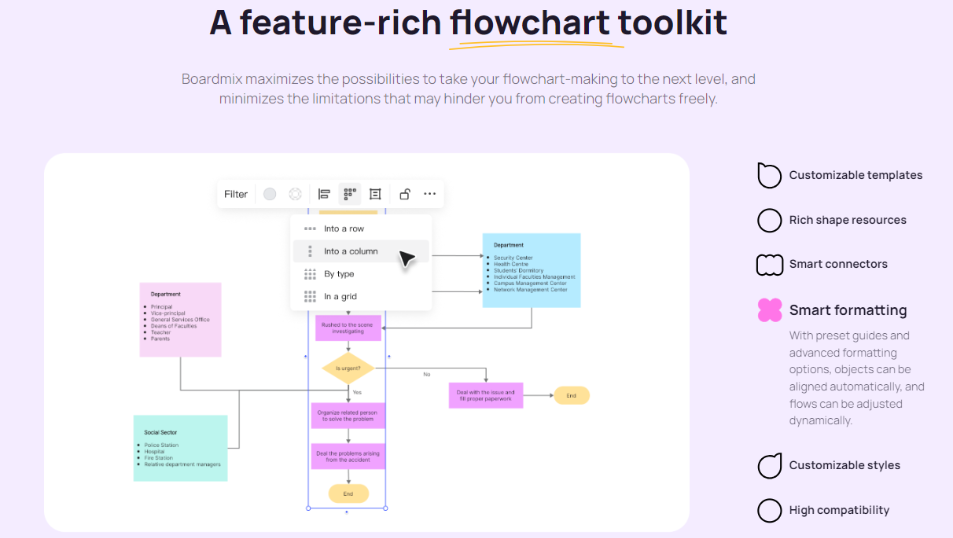
There are countless types of flowcharts, each designed for different industries, tasks, or situations. Here are 20 common flowcharts frequently used in various work scenarios! All these flowcharts are sourced from the Boardmix online collaborative whiteboard community, which you can access for free by registering. Let's check them out!
AI Flowchart Tool is a powerful, technologically advanced software that employs artificial intelligence (AI) to generate flowcharts. These innovative tools redefine the traditional approach to creating flowcharts, streamlining the process, enhancing efficiency, and improving accuracy.
Explore the user-friendly MoSCoW Matrix templates and tools provided by Boardmix, designed to simplify your journey towards mastering this method. Also, learn how to draw a MoSCoW Matrix with our step-by-step guide, ensuring you're well-equipped to implement this powerful
Embark on a journey to understand the AIPL model with our comprehensive guide. Get an overview of the AIPL model and how it serves as a roadmap for successful marketing strategies. Dive into 3 practical AIPL model examples for brands and learn how to draw the AIPL model with the template.
Successful brainstorming not only allows the team to find solutions to problems but also allows team members to feel the creative thinking involved. This article will introduce 10 advanced techniques to stimulate the vitality of brainstorming, which can allow everyone in the team to have a more active source of ideas during the brainstorming process.
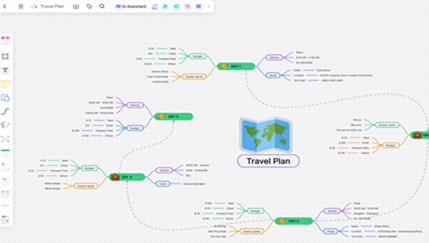
In the digital age, trip planning software has become an essential tool for modern tripers. They provide convenient features to help users easily make trip plans, find attractions, book hotels and transportation, and more.
In today's digital world, travel planning software has become indispensable for modern travelers. These tools offer a wide range of features to help you plan your trips, discover attractions, book hotels, transportation, and more. This article introduces 10 outstanding travel planning software to make your journey smoother and more enjoyable.
In practical application, how can the Lean Canvas be kept from being just on paper, and how to truly find the entry point of the business model? This article will take a real case - sharing bikes as an example, and use a professional and effective tool – Boardmix.
Many senior project managers are accustomed to using Gantt charts to design or monitor project processes. It can visualize the progress and process of the overall project, effectively manage the team's workload, and monitor the progress of the project in real-time to achieve the lowest cost.
Learn what a service blueprint shows, how its components connect, and how four service examples map customer actions, frontstage work, and backstage processes.
For the strategic management of enterprises, there are many analysis methods, and the most commonly used is the PEST analysis method. It is a method to analyze the external macro-environment of an enterprise based on the company's strategic perspective from four aspects.
In the rapid development of the digital world, artificial intelligence (AI) has broken the limitations of traditional writing methods and gradually formed a new online writing model. This article selects 7 AI online writing websites, which will help you become more proficient in business writing, creative writing or academic writing, improve writing efficiency, and stimulate your potential innovative ability.
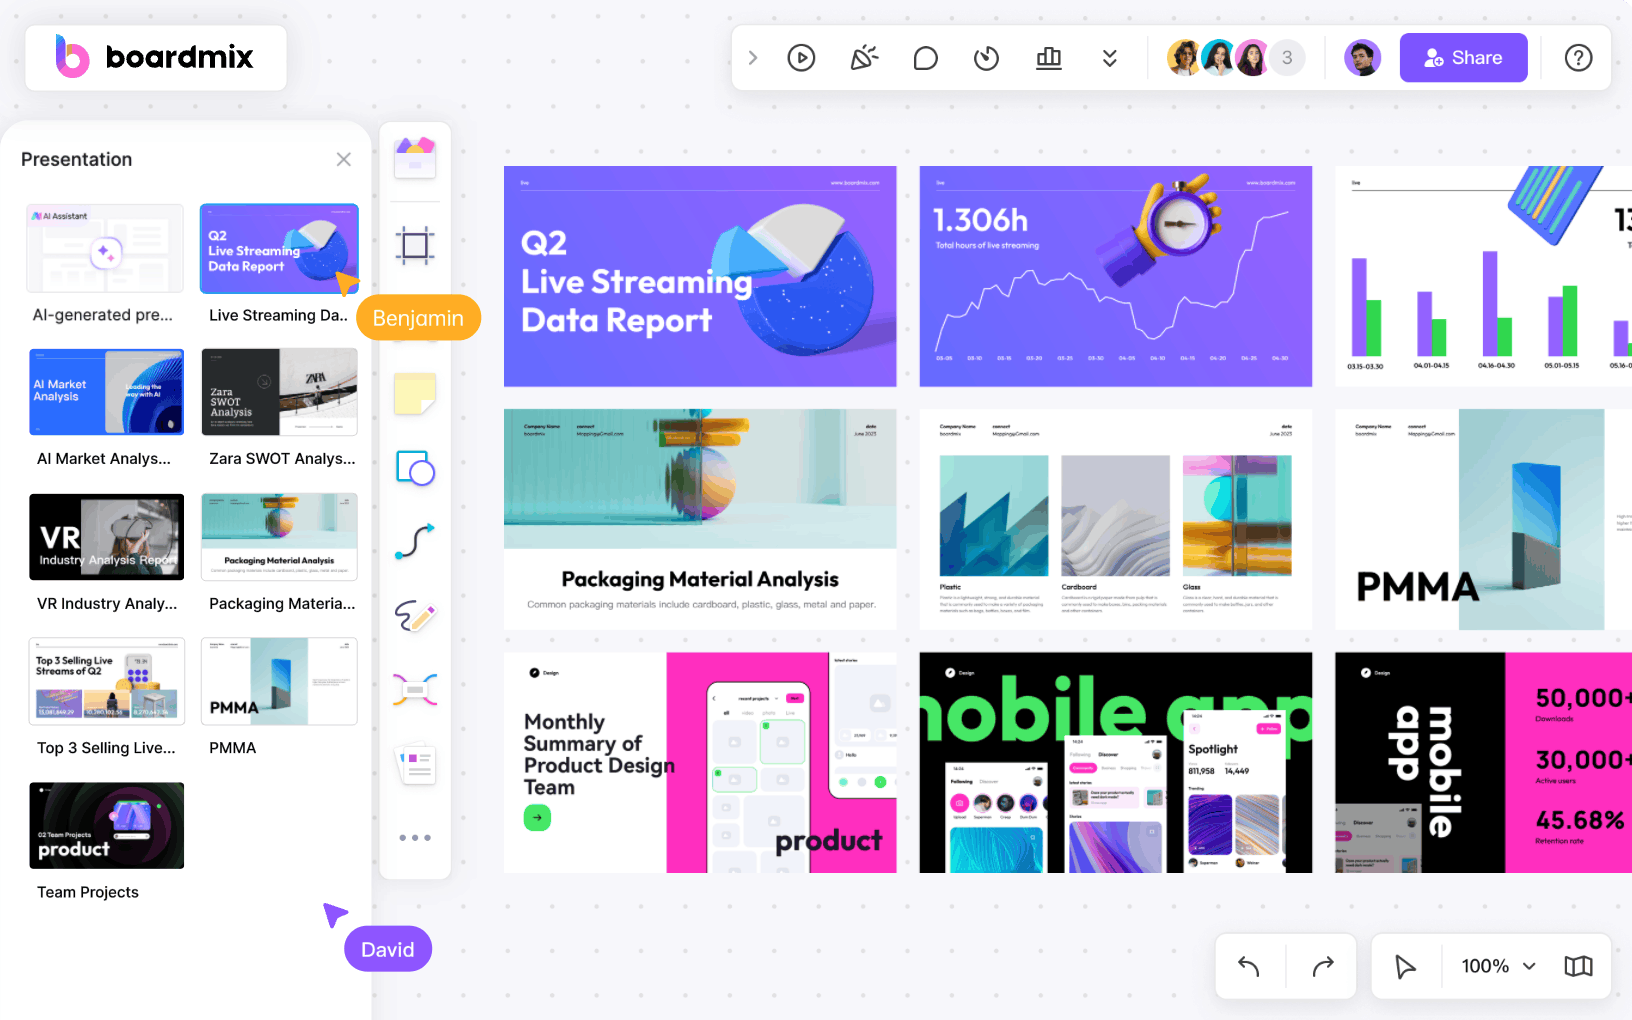
Explore the top 8 AI tools for slides that can transform your presentations. Discover how AI can elevate your presentation game, making them more engaging and impactful. Whether you're a student, a business professional, or a speaker, these AI tools can cater to all your presentation needs.
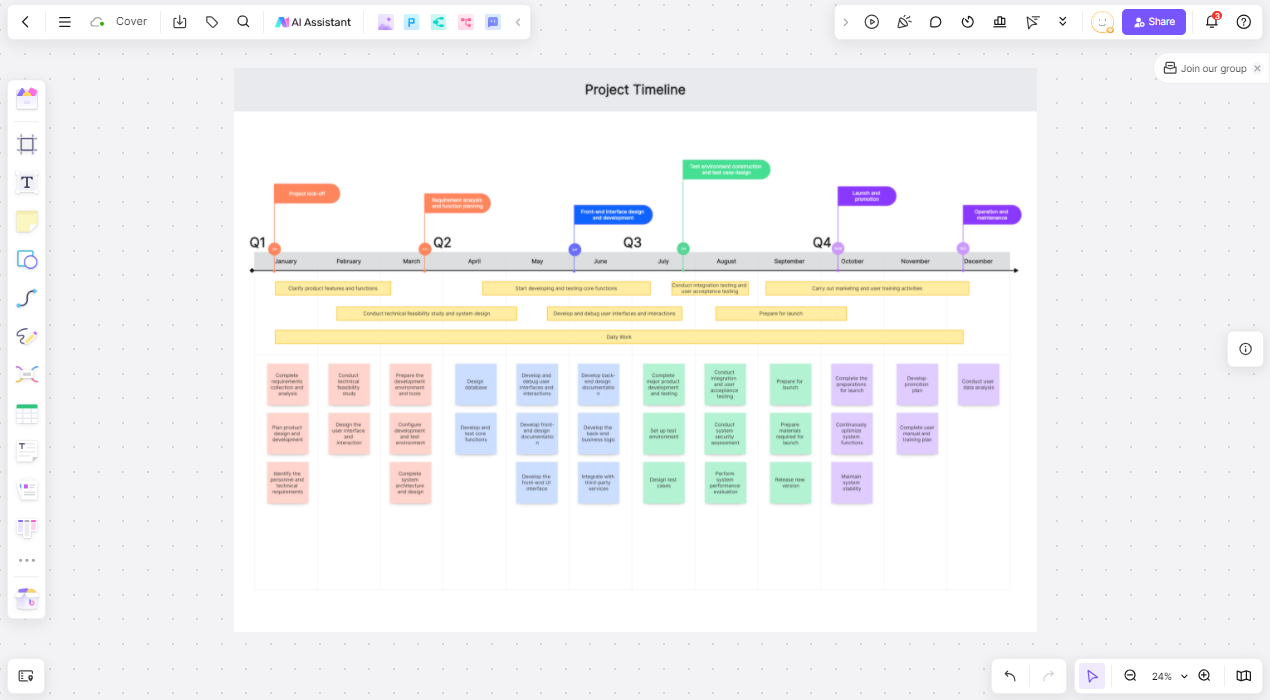
The timeline connects one or more events in chronological order to form a relatively complete record system, which is then presented to the user in the form of graphics and text.
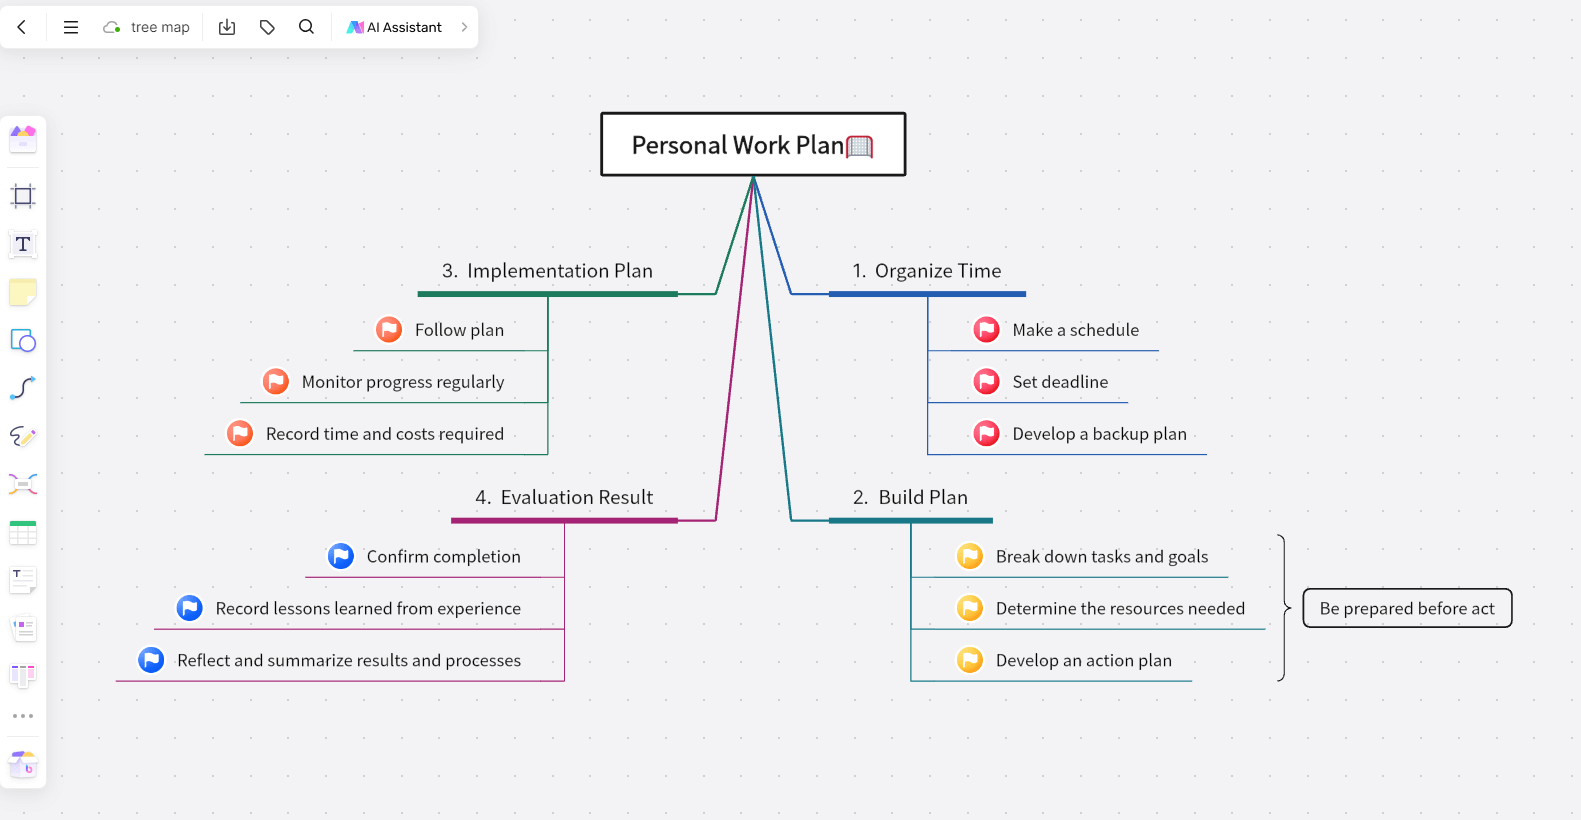
Tree diagram is a visual description of the correlation from a central node or ancillary relationships. It is a simpler type of mind map and is used to describe unsolved problems and analyze current ideas. It is suitable for displaying hierarchical relationships of many things and can help us classify and summarize content and clarify logical ideas.
Create a SWOT analysis in Boardmix: identify strengths, weaknesses, opportunities, and threats, then share the template with your team to discuss priorities.
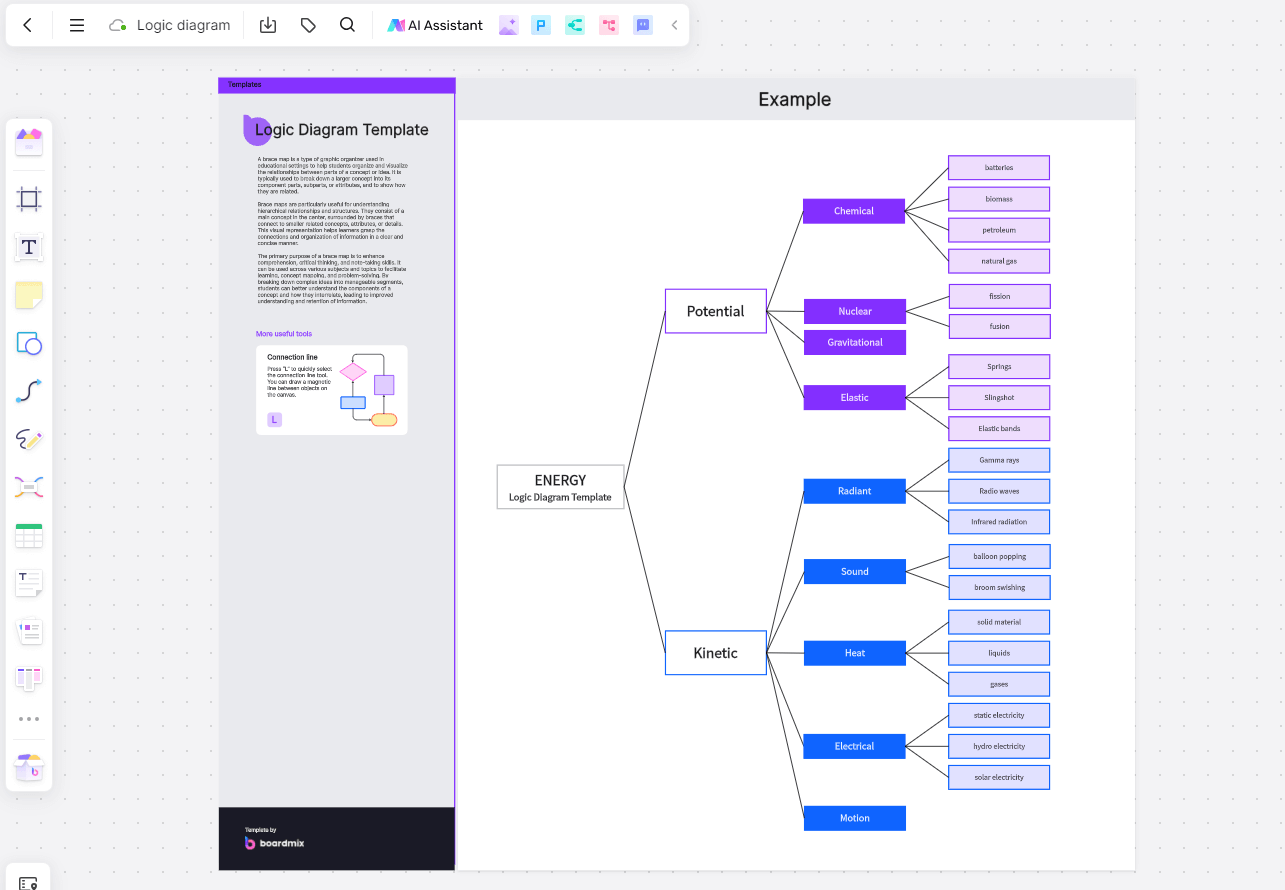
Logic diagram is a form of mind map. It uses icon symbols, text and connecting lines to represent the relationship between various elements. Logic diagram is an abstract representation of the thinking process, in theory, it can be widely used in all aspects of life. aspect. Logic diagrams can help people clarify the relationships between things and form systematic thinking. Whether you are a student or a worker, it is very necessary to learn to draw logic diagrams.
As a classic information visualization tool, tree mappings have been widely used for their intuitive and clear characteristics. It can display information in a hierarchical manner and help us understand and reveal complex relationships between data.
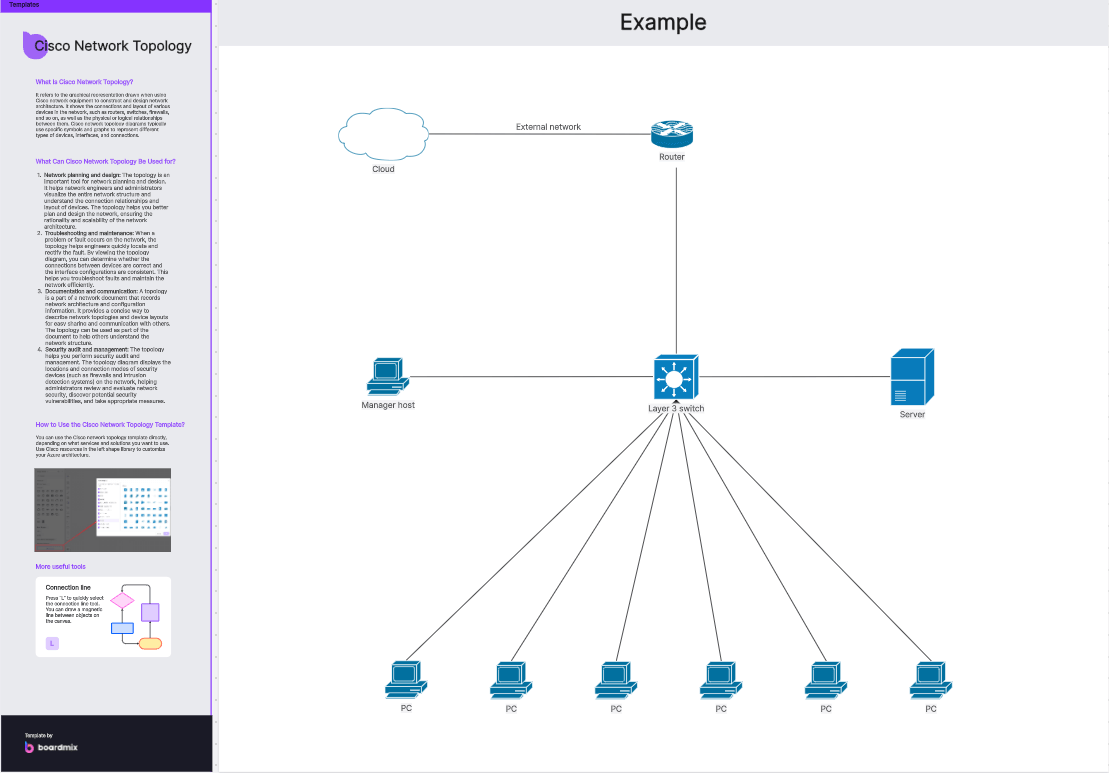
In the era of big data, how to better operate and present data and discover more information from it has become the main direction of exploration. In this article, the Boardmix online whiteboard shares a very useful information diagram-the network topology diagram. This network relationship is a powerful tool that allows us to present the information we want to convey to others more clearly and logically.
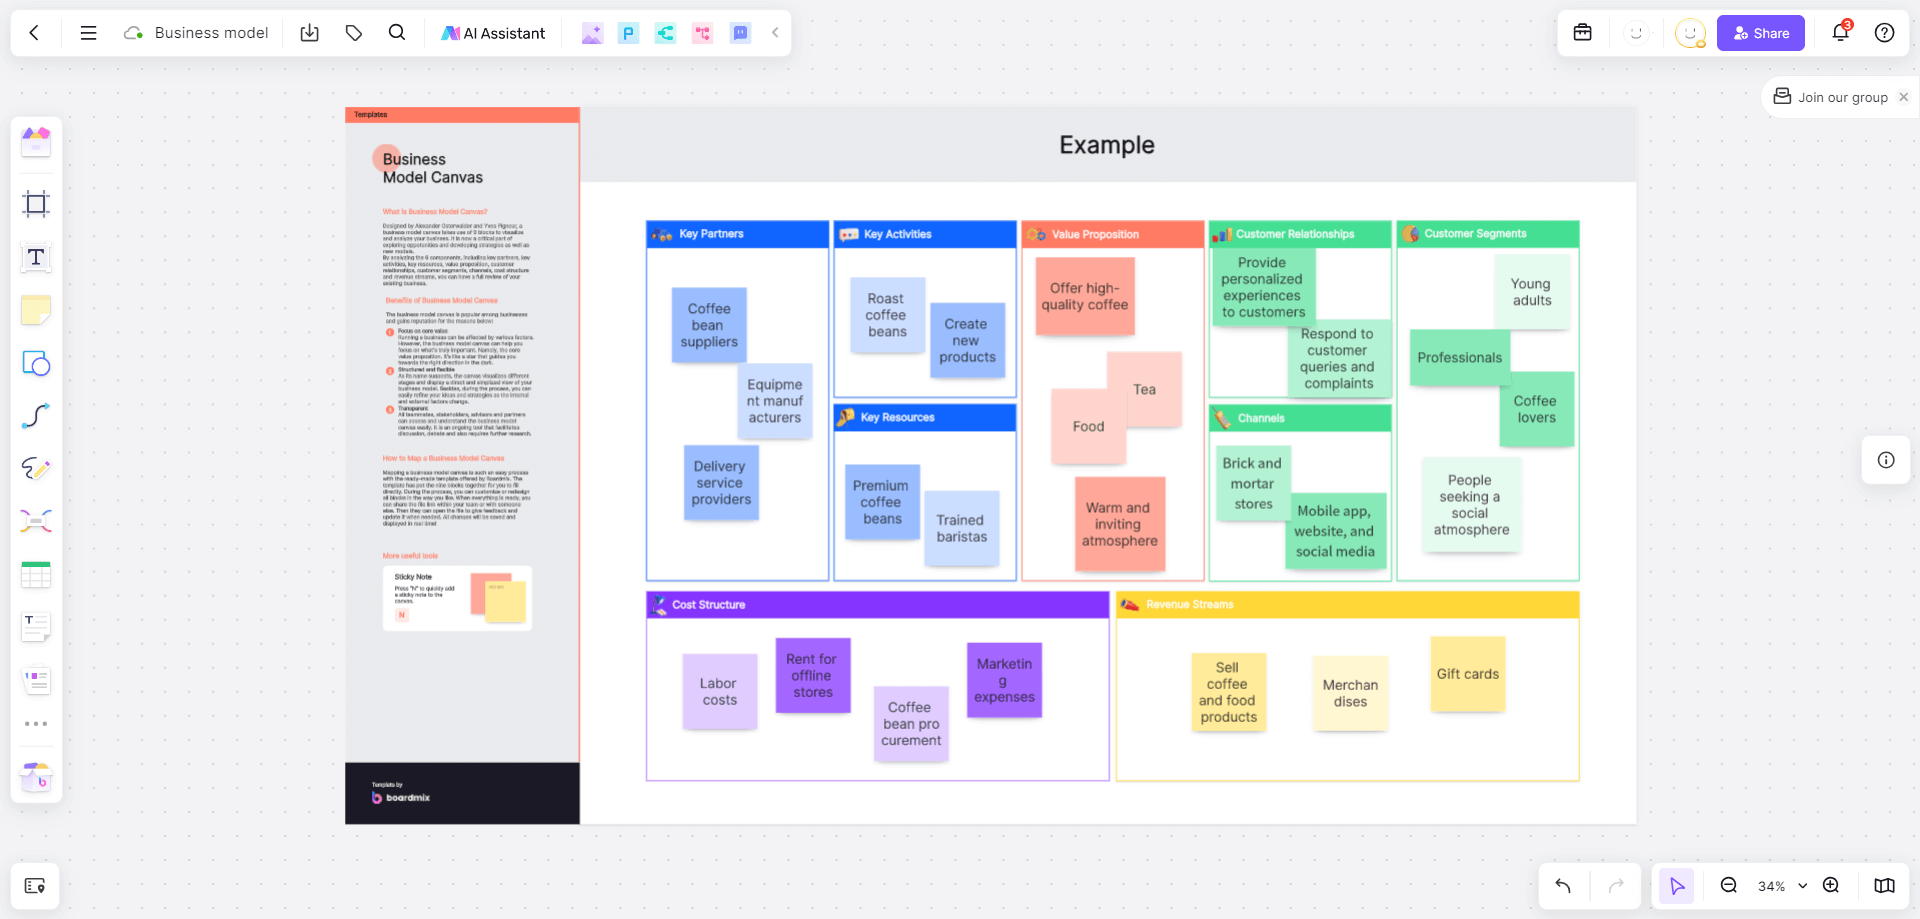
A business model is the fundamental logical by creates, delivers, and obtains value. Likewise, the business canvas can be applied to ourselves. We can be the CEO of a company, if you put yourself as a company to run, you can use Boardmix’s [Business Canvas Template] to plan your future life development blueprint like a company CEO!