Mackenzie Carter contributes to the Boardmix blog, covering visual collaboration, diagramming, and ways to organize ideas. Explore guides on whiteboards, mind maps, workflows, and business analysis, alongside tool comparisons and examples.
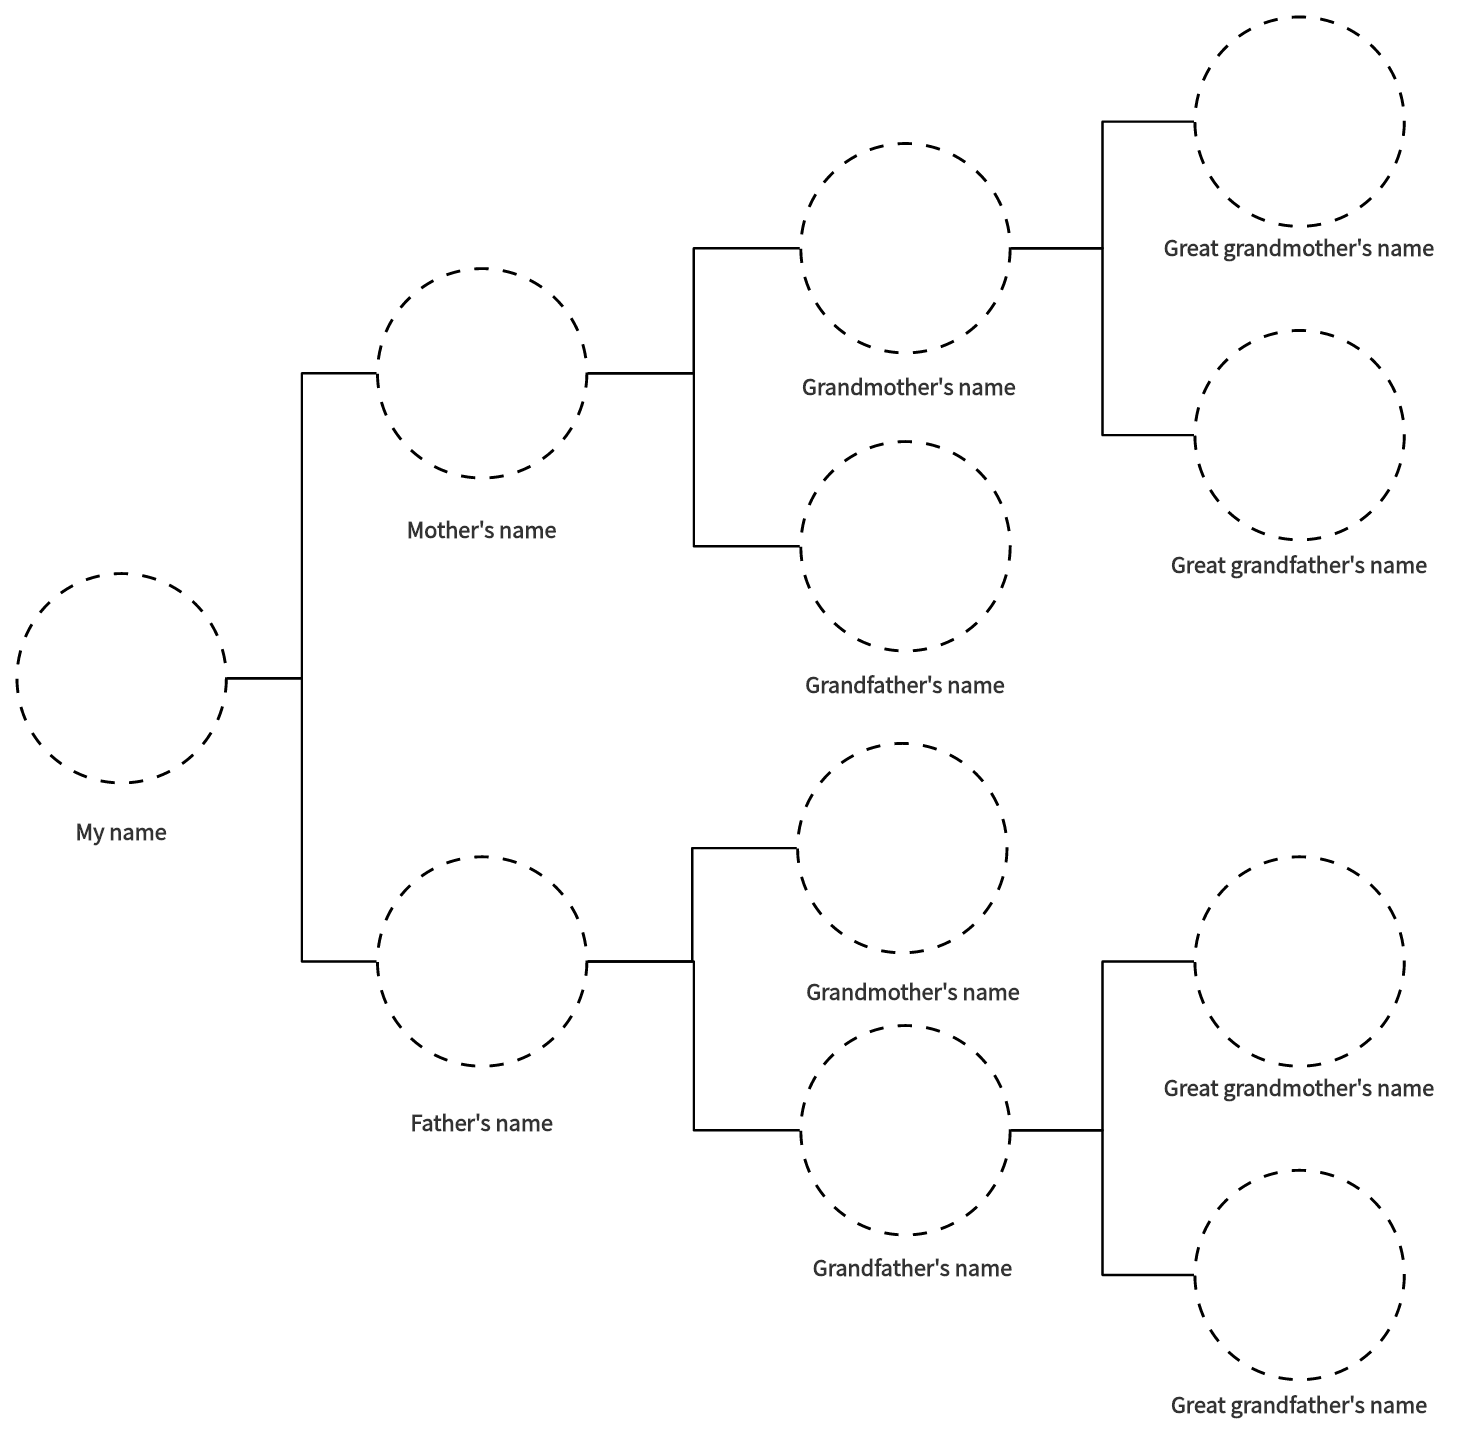
Family tree makers range from simple online tools to comprehensive desktop applications, each offering unique features to help you build your family tree. Here, we've compiled a list of the top 10 family tree makers you must know to get started on your genealogical journey.
Free family tree templates can simplify the process, providing a structured and visually appealing foundation for your project. In this article, we'll explore the benefits of using family tree templates and guide you through finding and utilizing the best ones available online.
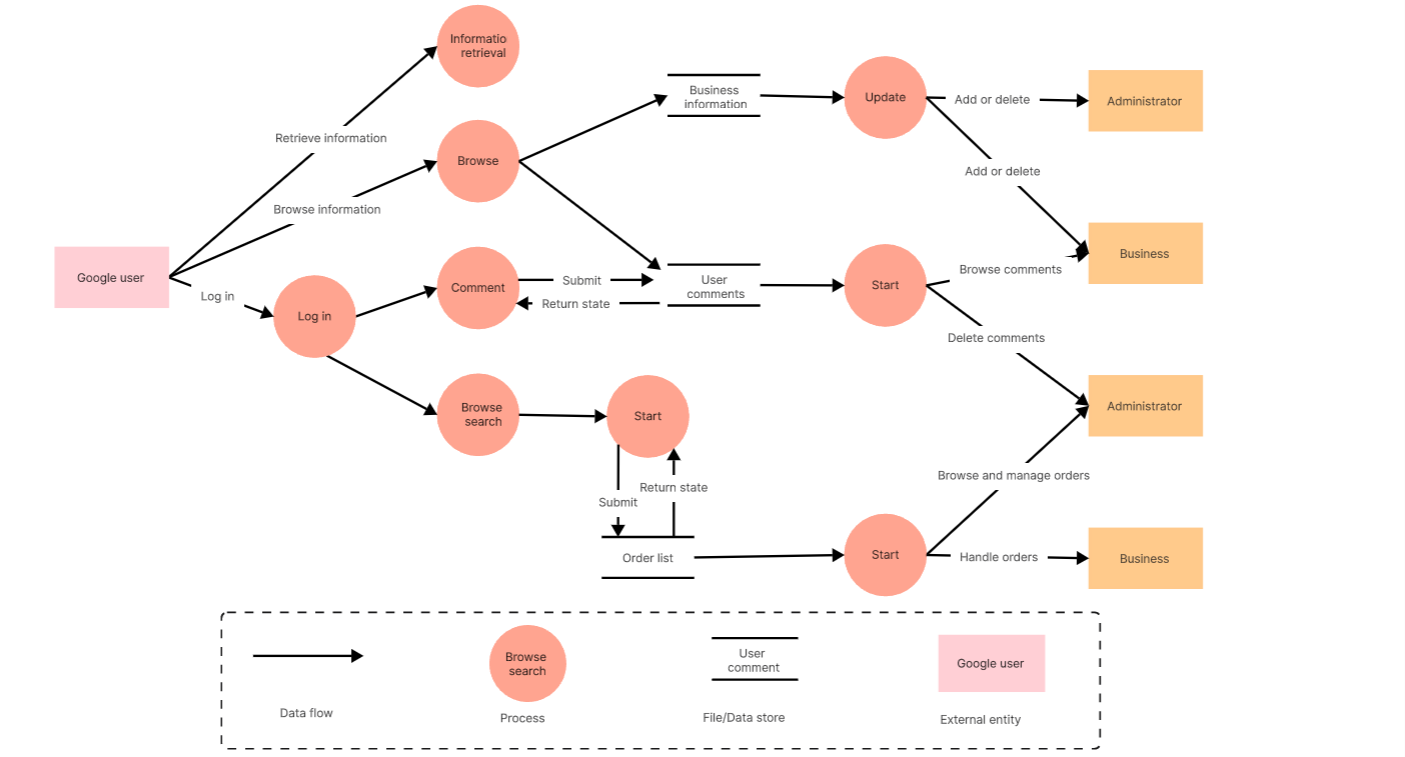
Data flow diagrams (DFDs) are essential tools in information systems analysis and design, used to depict the flow of data within a system and how that data is processed. When choosing a tool to create DFDs, it's crucial to consider factors like ease of use, powerful features, and overall suitability. This article introduces seven commonly used DFD tools and guides their usage to help you select the best tool for your needs.
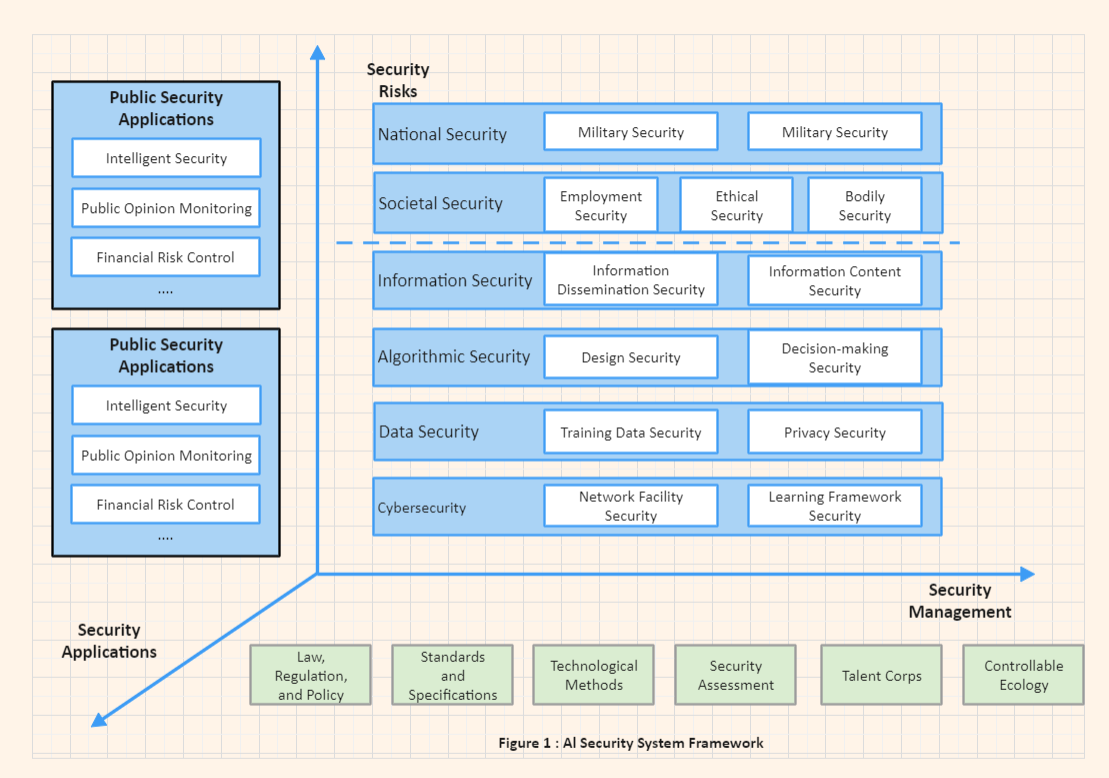
Framework diagrams play a crucial role in fields such as education, design, corporate strategic planning, and research. And as a powerful tool for understanding and communicating complex information efficiently. This article delves into the definition and importance of framework diagrams, the steps to create them, and common types and applications.
An organizational structure diagram is a fundamental tool that outlines the workflow, department setup, and functional planning of a company. Common organizational structures include centralized, decentralized, linear, and matrix formats. Many businesses suffer from inefficiencies and poor decision-making due to an ill-conceived organizational structure.
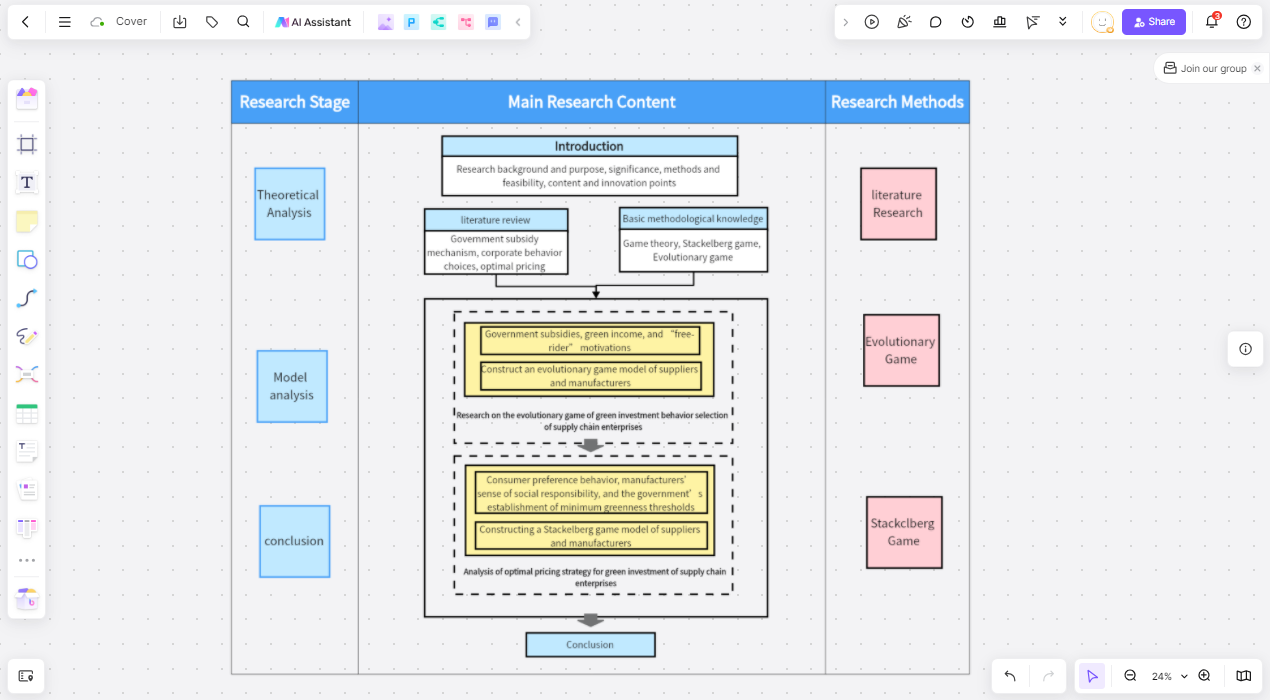
When writing a thesis, a technical roadmap is an essential component that provides clear guidance and a blueprint for the entire research process. An appropriate technical roadmap helps you systematically plan your research steps, ensures the smooth execution of experiments, and ultimately achieves the goals. This article will provide you with some essential technical roadmap templates to make your thesis writing process more efficient and smooth.
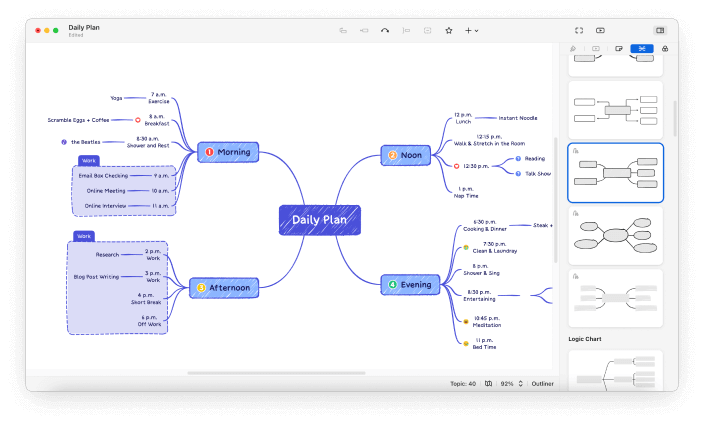
A tree diagram is a structured thinking model and a type of mind map. Mind maps help clarify thoughts through a process of organizing ideas, summarizing, and then outputting them, rather than creating chaos in your mind. However, in everyday work and study, we often see "chaotic tree diagrams" filled with dense text that makes it difficult to find the logic.
Unlock the boundless potential of creative thinking with the SCAMPER technique. This technique is an invaluable tool designed to ignite innovative thoughts, offering a robust approach to problem-solving. In this guide, we'll delve into the world of SCAMPER, providing real-life examples and free templates in various formats including Word, PDF, PPT, and more.
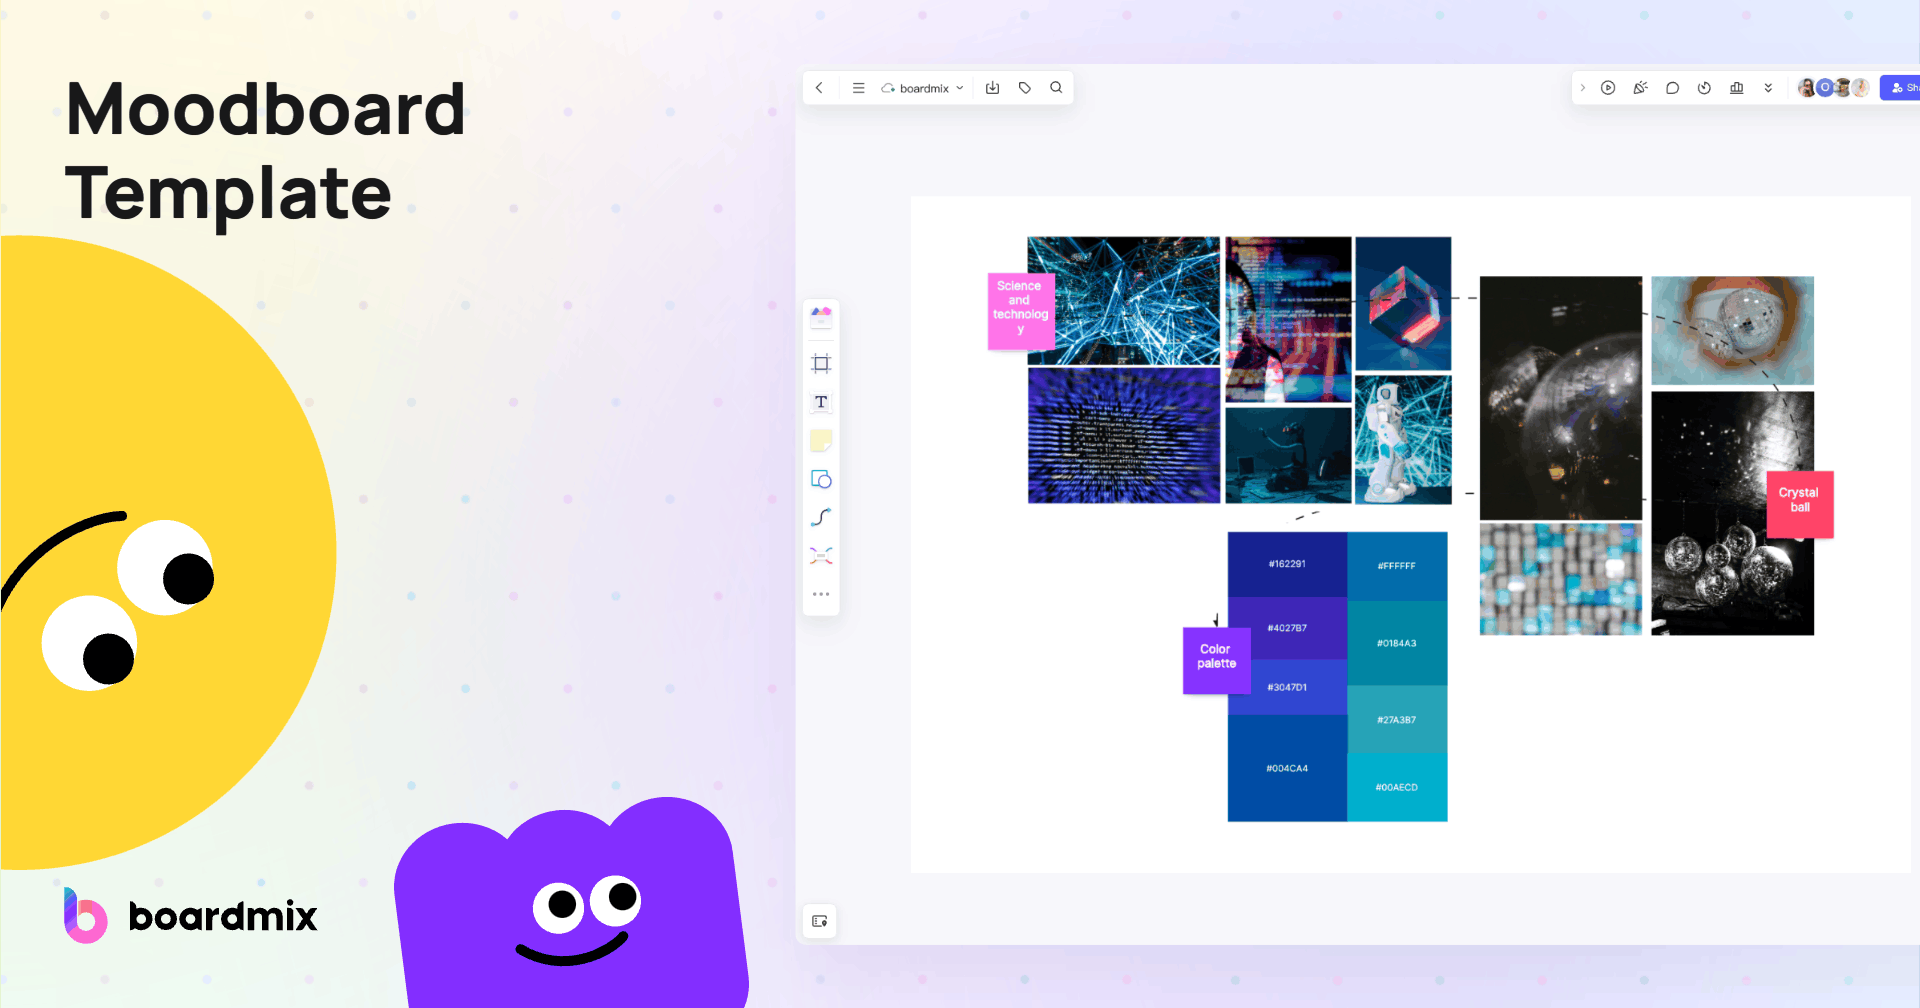
A mood board is a collection of visual materials that evoke a particular style or concept. Designers, illustrators, photographers, filmmakers, and other creative professionals often use mood boards to convey the abstract content of their ideas. Mood boards are considered a powerful starting point for creative projects, serving as a visual reference and a springboard for new ideas.
Onboarding is a crucial process that helps new employees integrate into a company and become productive quickly. A well-crafted employee onboarding checklist is a key tool in this process. This guide will walk you through creating a comprehensive checklist covering various aspects of employee onboarding and use the onboarding checklist template to create one.
A well-structured onboarding checklist is key to ensuring that new hires are integrated smoothly and efficiently into the organization. Here are 7 examples of onboarding checklists and a free onboarding guide and onboarding checklist template that can help streamline your new hire process.
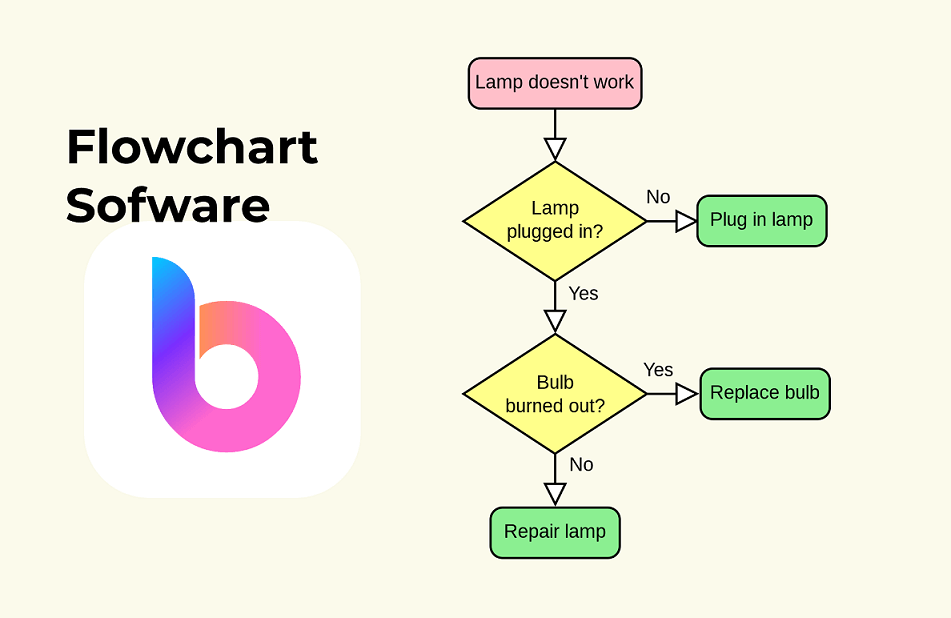
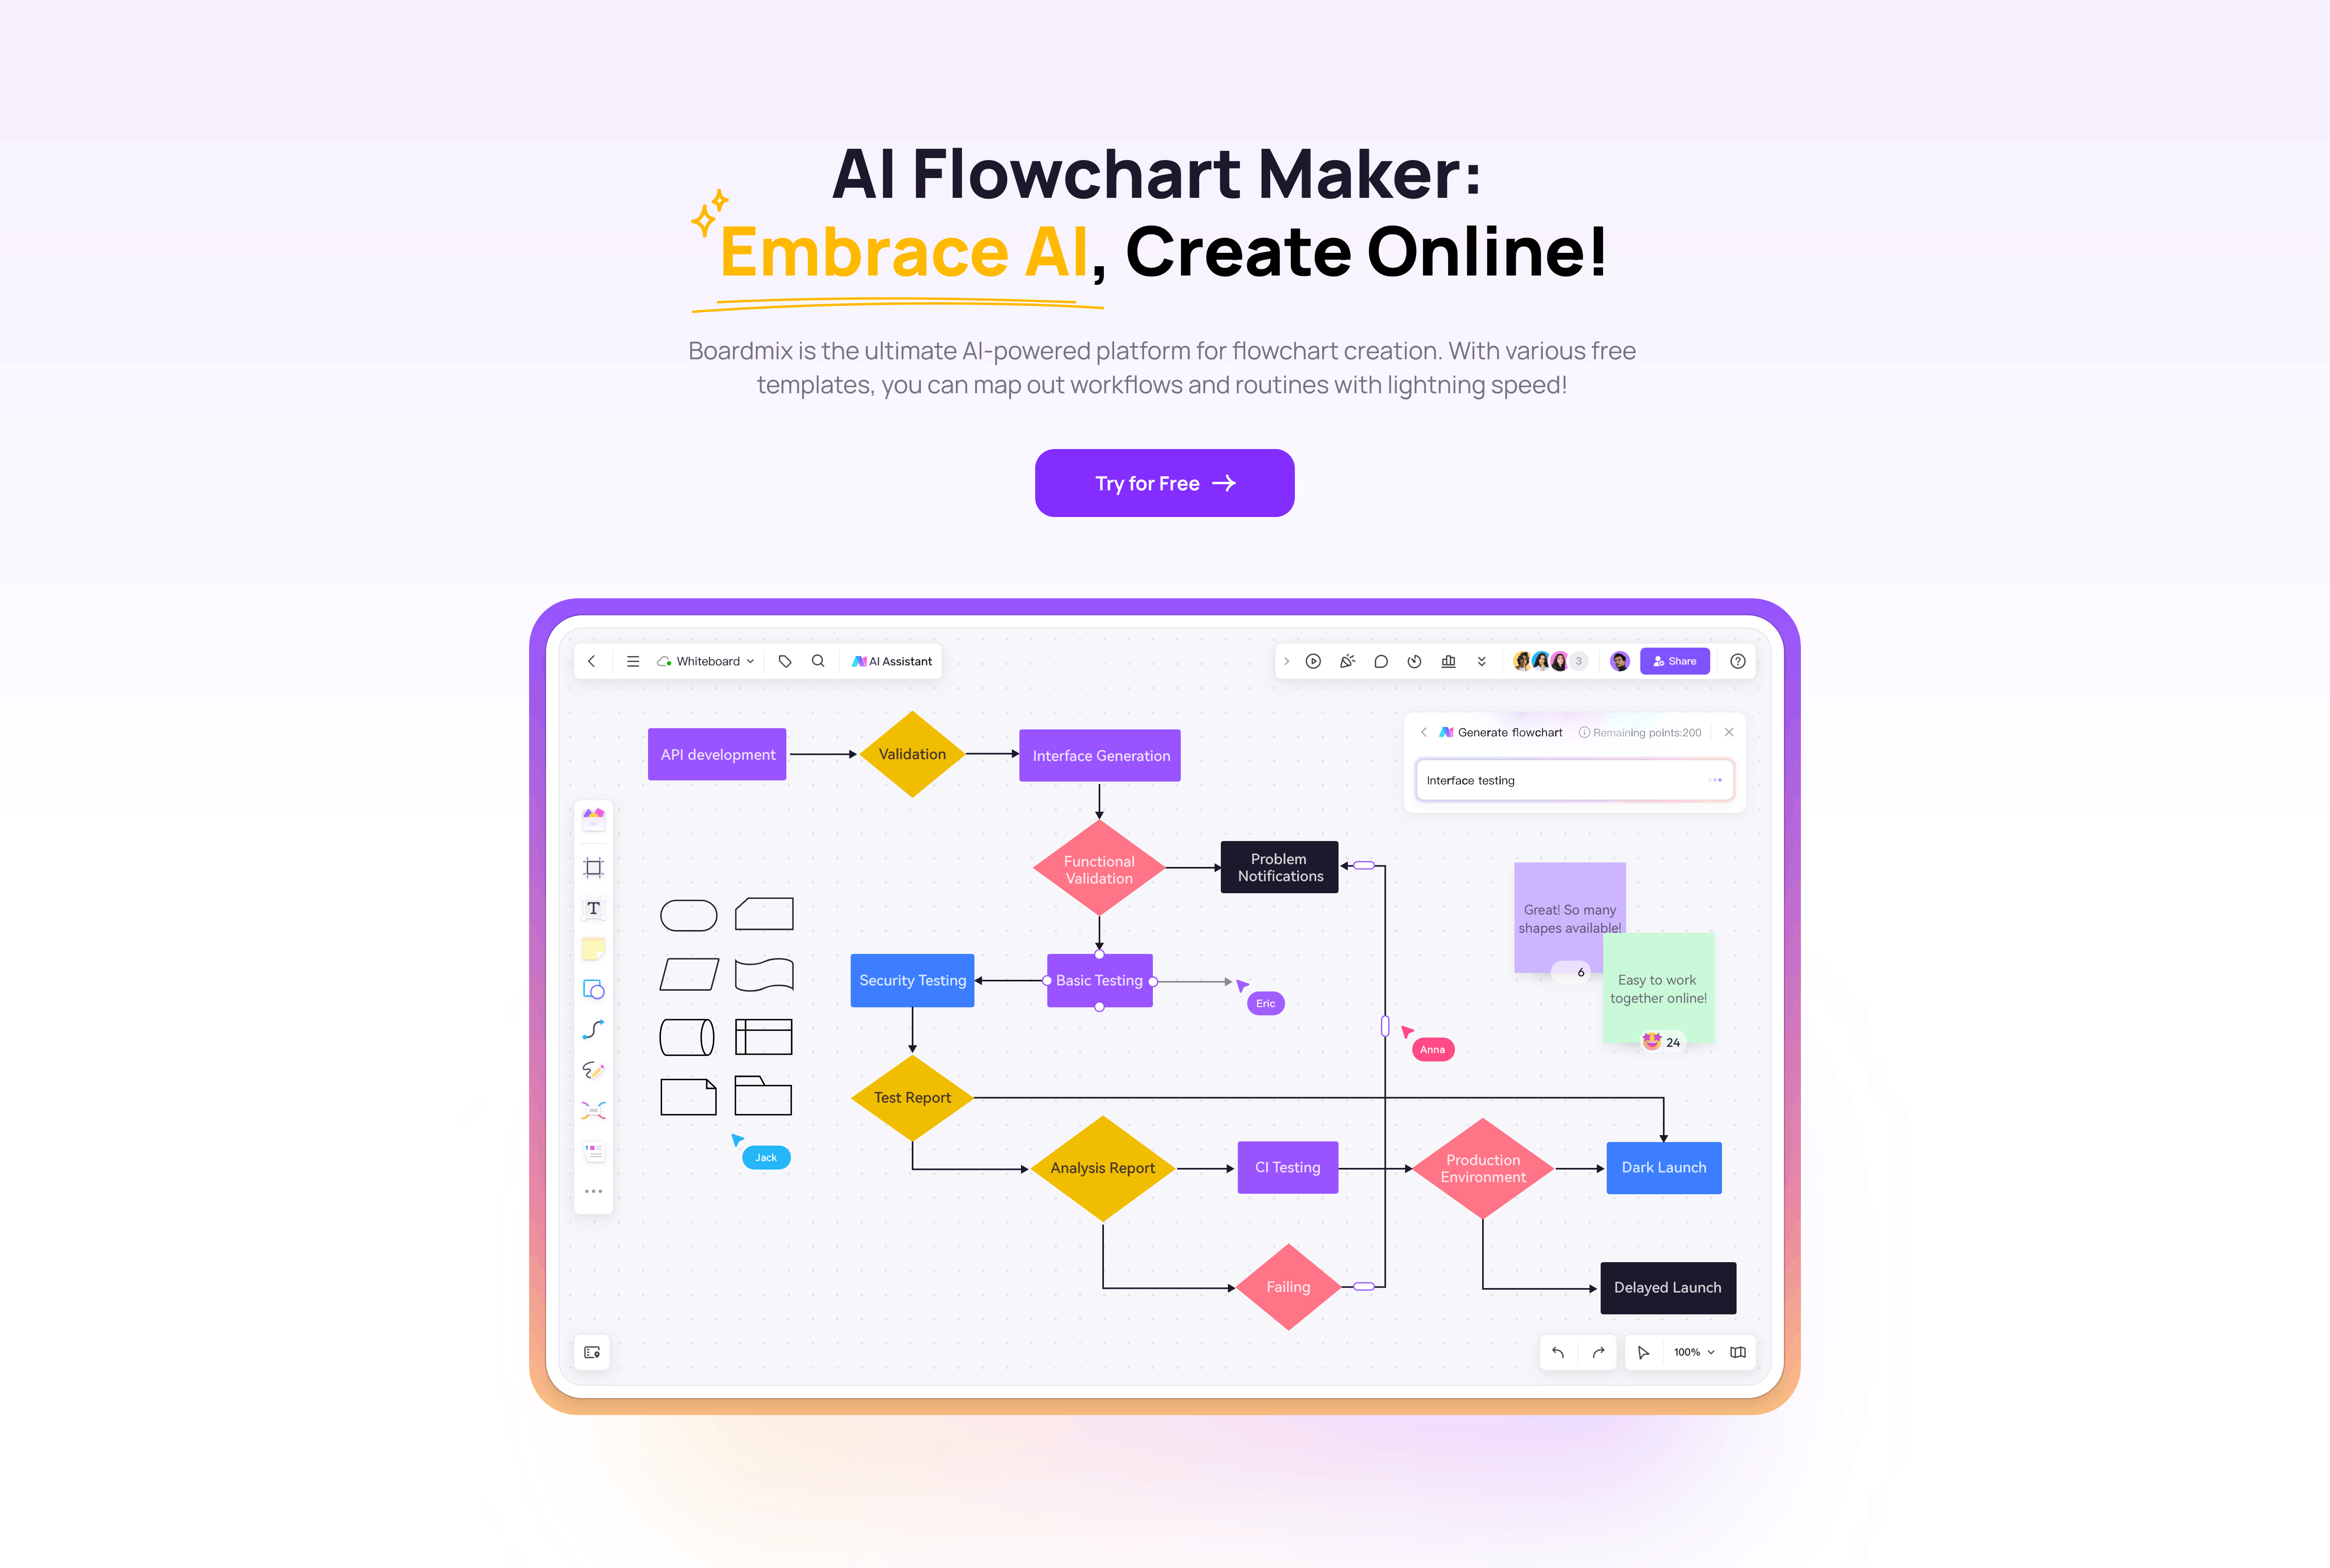
In today's fast-paced work environment, optimizing workflows and enhancing efficiency have become key priorities for organizations and teams. Traditional manual flowchart creation is time-consuming and prone to errors. Boardmix supports AI auto-generated flowcharts, utilizing machine learning and natural language processing algorithms to intelligently create accurate and clear flowcharts.
The value of Slides is evident in any scenario. Whether it’s a small work report, a project proposal, a large product launch, or an international conference, slides are ubiquitous. Their visual representation allows us to convey our thoughts and ideas deeply and intuitively, making our presentations impactful.
A character relationship diagram visually maps out the connections between characters in a story, highlighting relationships such as friendships, rivalries, and family ties. These diagrams help in understanding complex narratives by providing a clear overview of character interactions. For authors, depicting interactions between characters can help create more detailed and engaging stories that resonate with readers. This article will use examples from famous films and books to show you how to create an attractive and clear character relationship diagram using Boardmix.
A sitemap is a file where you provide information about the pages, videos, and other files on your site, and the relationships between them. It can help search engines like Google to crawl your site more intelligently. In this article, we will introduce 3 sitemap examples and 5 sitemap generators to help you optimize your website.
This guide will walk you through the basics of what a sitemap is, how it functions, and how to create a sitemap and use a sitemap template, ensuring your site is both user-friendly and SEO-optimized.
Architecture diagrams help visualize various parts of a system and interrelationships. Architecture diagrams can guide development, evaluate the rationality of system design, identify potential issues, and support decision-making, effectively planning and optimizing the design and development process.
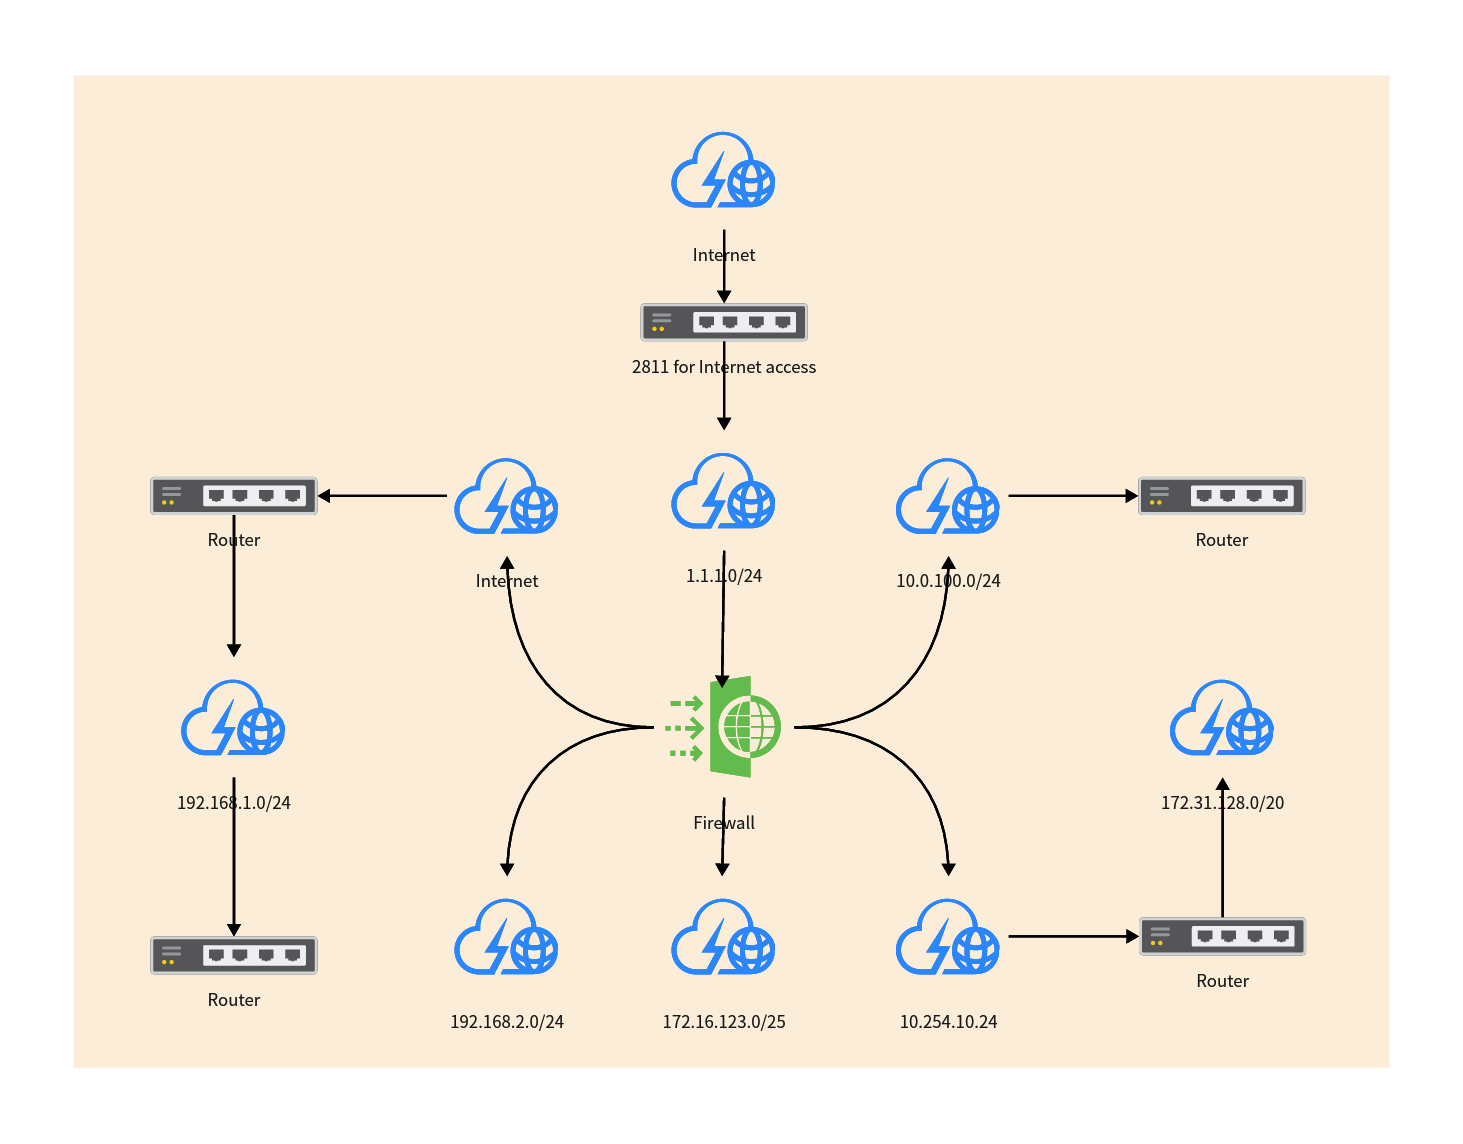
As computer networks continue to evolve, network topology diagrams have become an indispensable part of network design and management. A network topology diagram is a graphical representation used to show the relationships between devices and connections within a network. For beginners, choosing the right drawing software is crucial. This article will introduce some commonly used software and provide a guide for novices on drawing network topology diagrams.
ER diagrams (Entity-Relationship Diagrams) are commonly used models in database design to describe the relationships between entities. These graphical representations play an important role in understanding and designing database structures and are extremely useful in database development and design. This article will share 10 ER diagram tools, providing detailed analyses of their features, pricing, and applicable scenarios, allowing you to choose based on your needs.