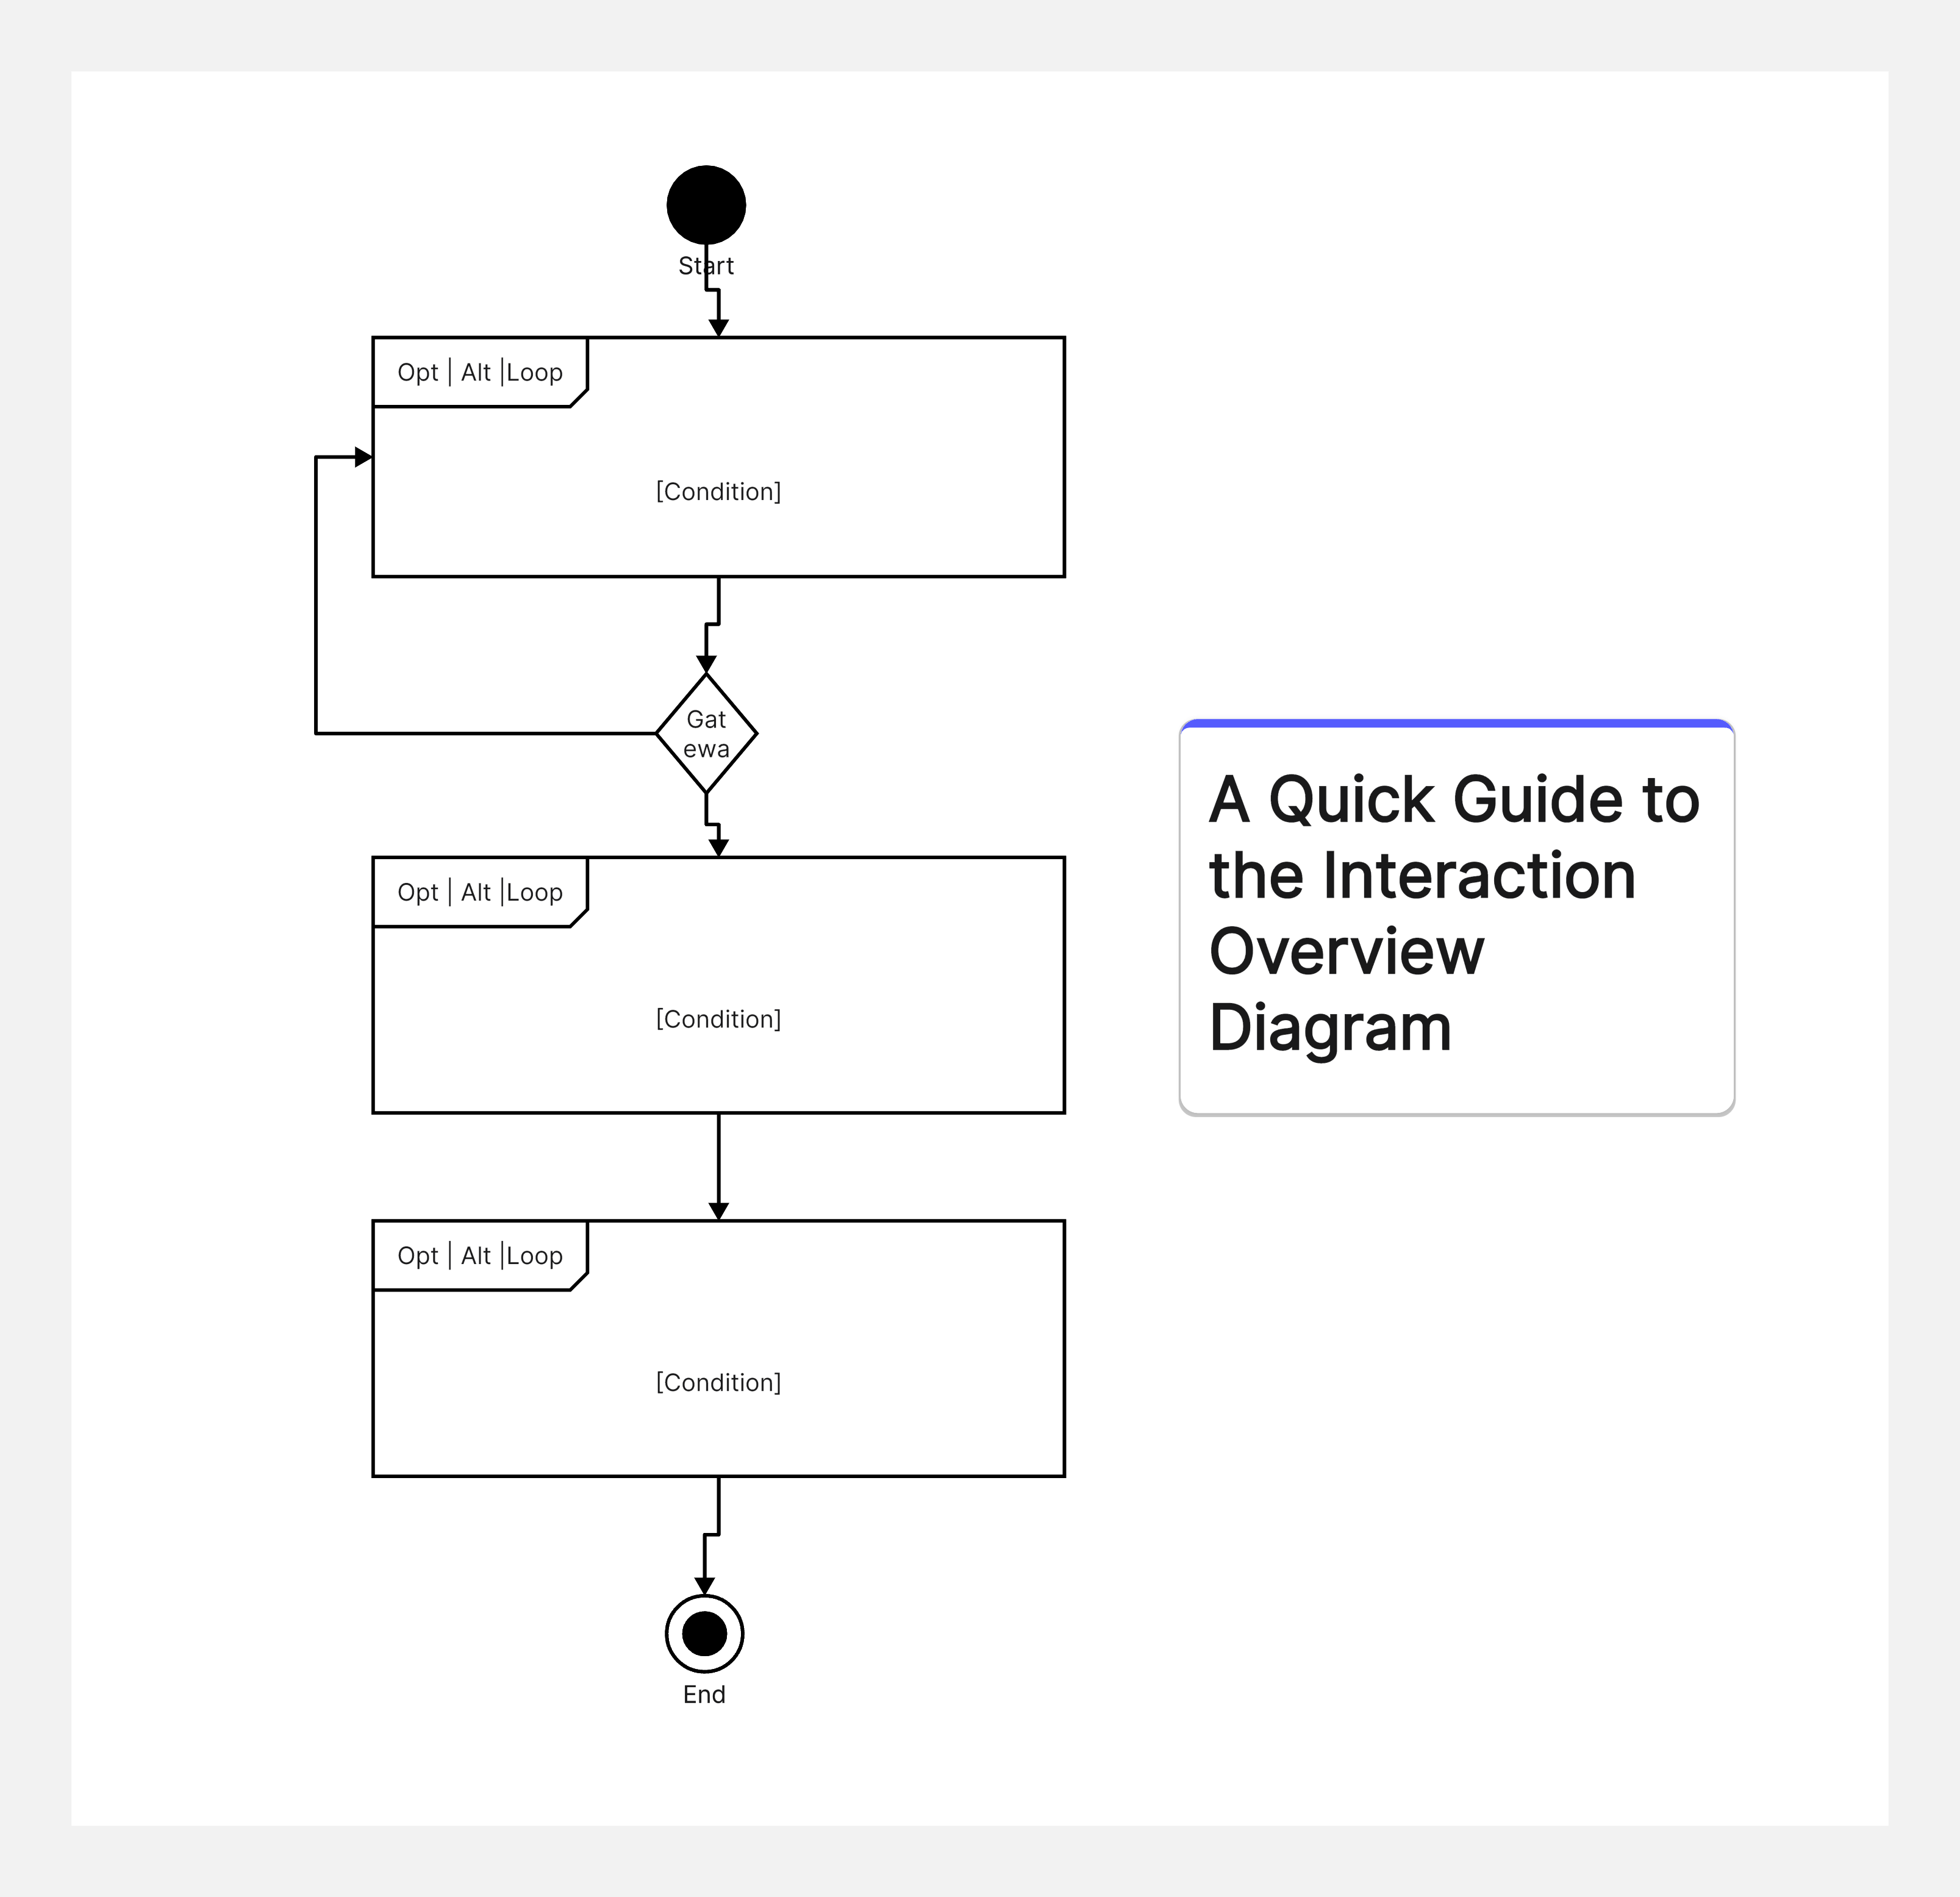
[Quick Guide] Interaction Overview Diagram
An interaction overview diagram is a type of UML diagram that displays the interactions in your system. Create it with boardmix without much effort or time.
Read article


Online Collaborative Whiteboard

Boardmix Developer Platform

AI tools for diagrams, writing, and ideas

UI/UX Tool, Figma Alternative

AI PPT Maker, Gamma Alternative
Run workshops, plan projects, and work with colleagues on a shared whiteboard.
Explore collaborative work
1,543 articles to explore, from the latest guides to the archive.
Articles 1,465–1,488 of 1,543
An interaction overview diagram is a type of UML diagram that displays the interactions in your system. Create it with boardmix without much effort or time.
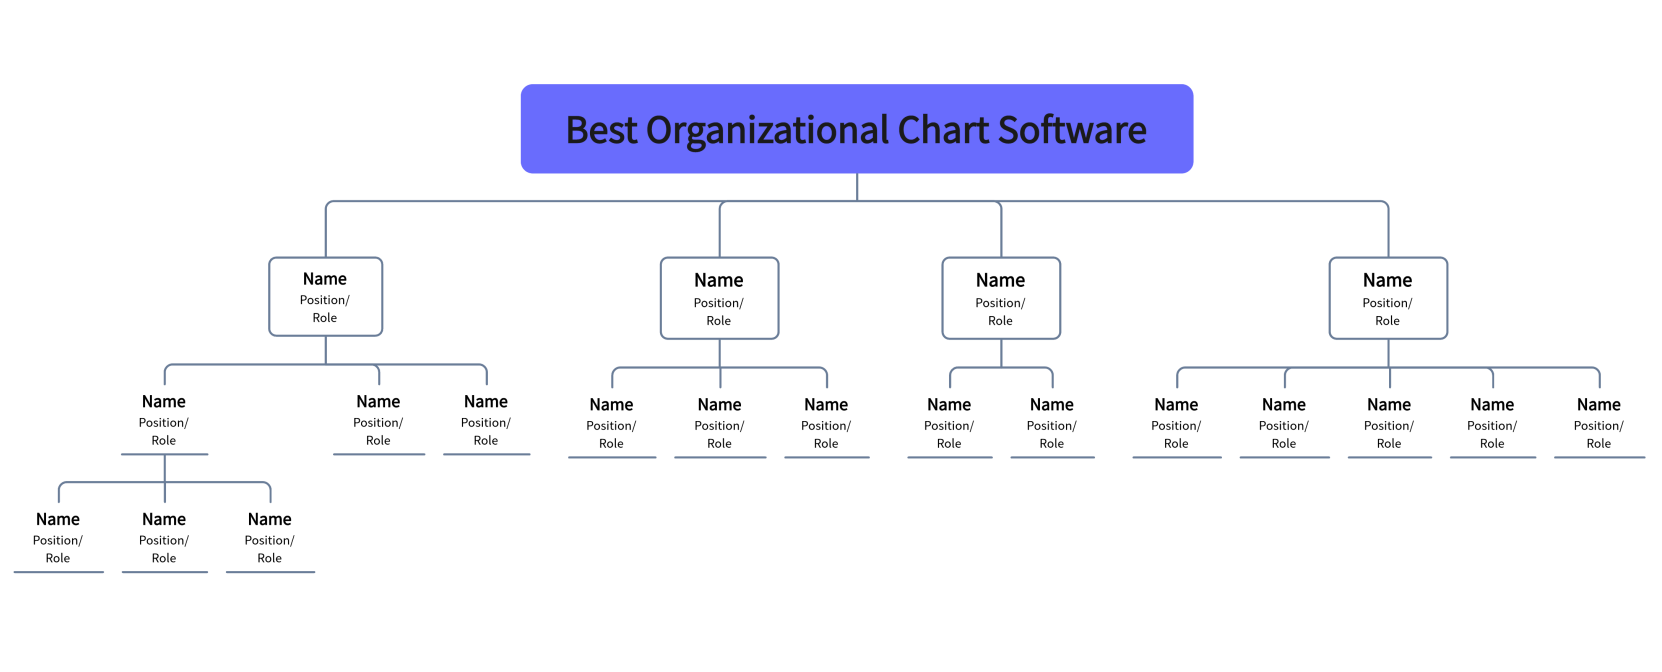
Read articleAn organizational chart software is essential for a company that wants to inform its employees of its structure. boardmix is the best tool to create org charts.
Read articleHaving a sales process is vital for a sales team. This blog will show you how to create a free sales process flowchart template with an effective whiteboard tool.
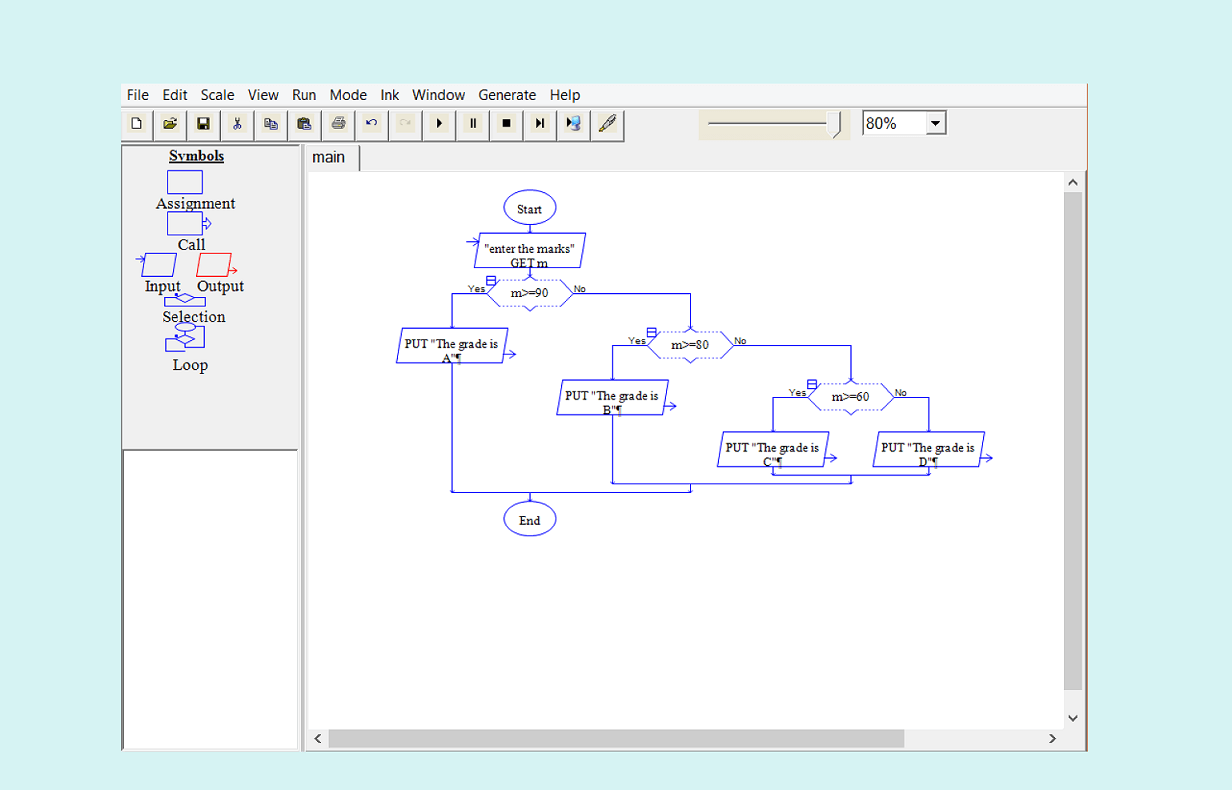
Read articleRaptor flowchart is a design-learning environment for programmers to visualize their algorithms. Read this blog to learn how to create a flowchart on Raptor.
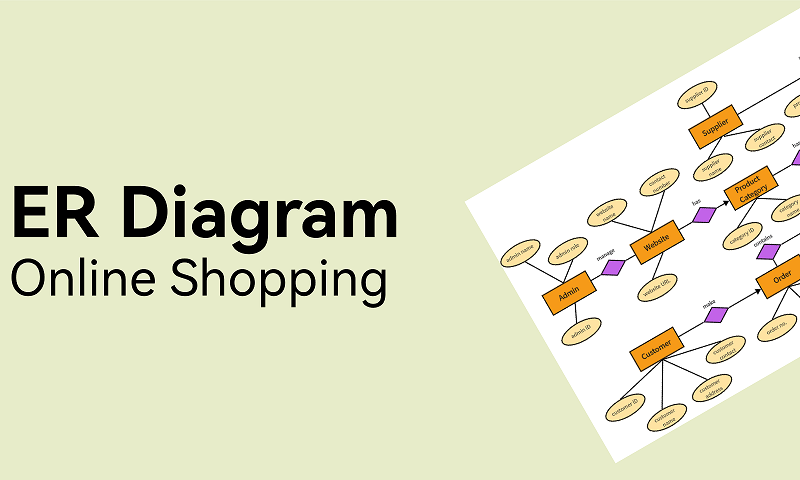
Read articleRead this blog to learn how to create a free ER diagram for online shopping using a collaborative and multi-functional whiteboard tool that boosts your creativity.
Read articleRead this blog to know how to create a flowchart in word and help to visually represent your projects and business goals with transparency.
Read articleA relationship in DBMS is the basis on which we understand all other concepts related to database management systems. Learn how these relationships work.
Read articleUsing boardmix, creating an ER diagram for your banking system becomes an easy task. Learn how to create an ER diagram for banking databases in minutes.
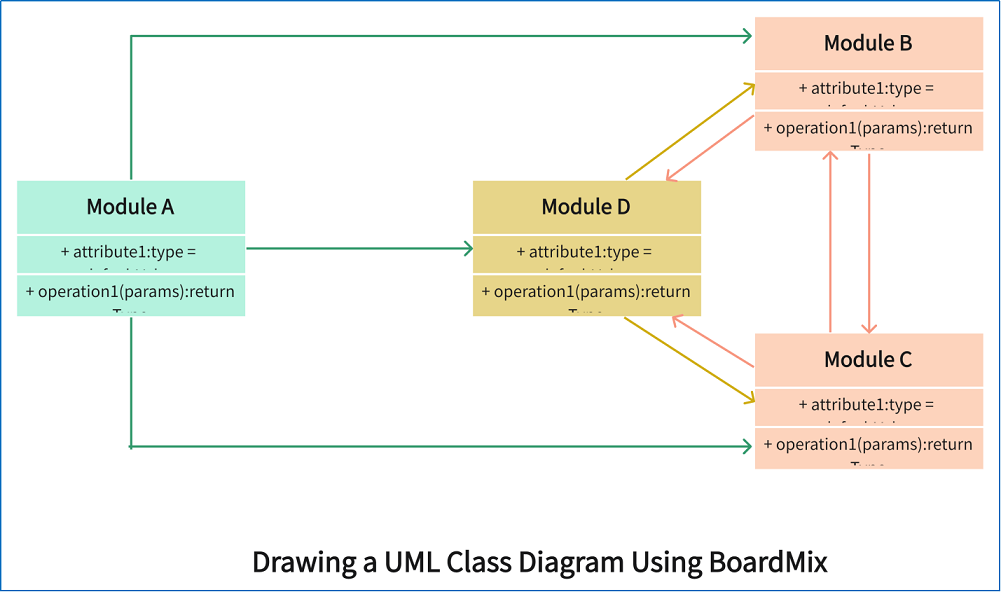
Read articleWith boardmix, you can make a class diagram online in a simple steps. Learn how to do that using customizable class diagram templates within minutes.
Read articleIf you want to understand and draw a great block flow diagram, this article is for you. Using boardmix, you can create block flow diagrams for free.
Read articleA collaboration diagram in UML is a tool that visualizes the relationships between the objects in a system. boardmix is the best tool to create one.
Read articleWith a project organization chart, you can visualize the hierarchical structure of your project. Use boardmix to create this chart quickly and easily.
Read articleEvery organization needs to create a BPMN online. boardmix enables you to create a BPMN diagram online in just a few clicks.
Read articleA free UML diagram tool enables you to create all the UML diagrams you need for your project. boardmix is one of the tools that stand out for the task.
Read articleA reliable user story mapping tool is essential for any agile product management team. boardmix is the best story mapping tool for every case.
Read articleUnderstanding the customer journey is the key to increasing retention and revenue. Find out more about customer journey stages and strategies in this article.
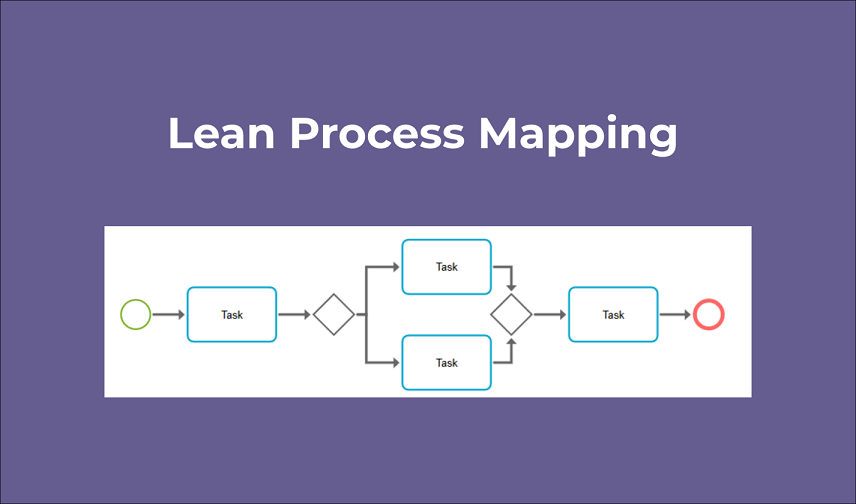
Read articleLean process mapping is a perfect process map to pinpoint waste activities and optimize time and cost. Find out more about lean process mapping in this article.
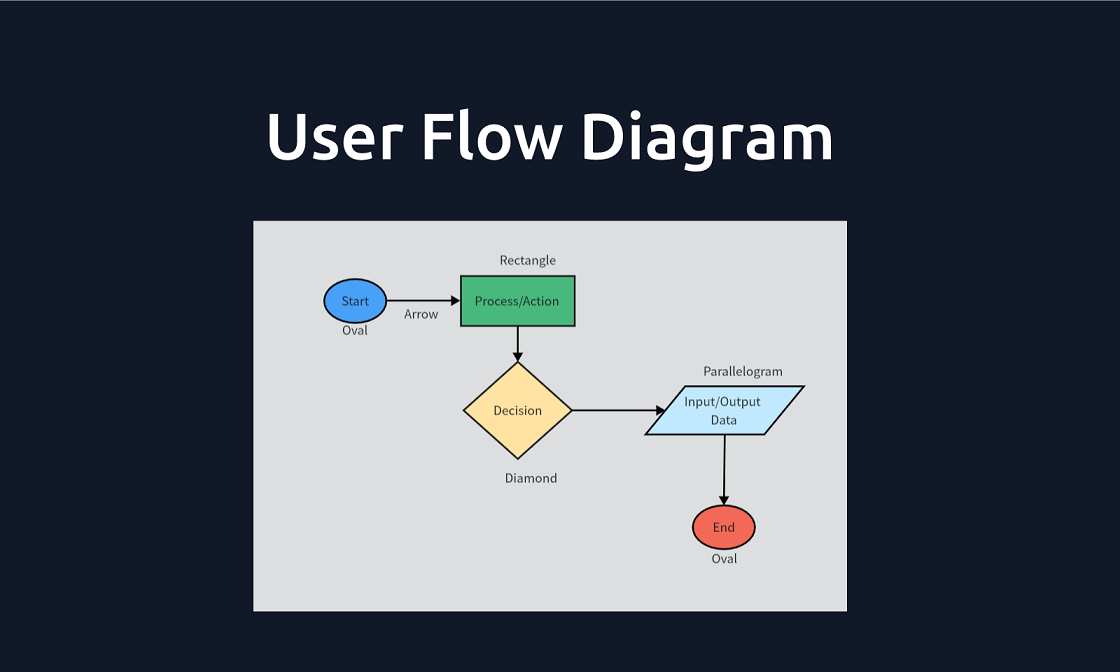
Read articleThe user flow diagram is the easiest way to understand how users flow through your app/website. Find out all about user flow diagram in this detailed article.
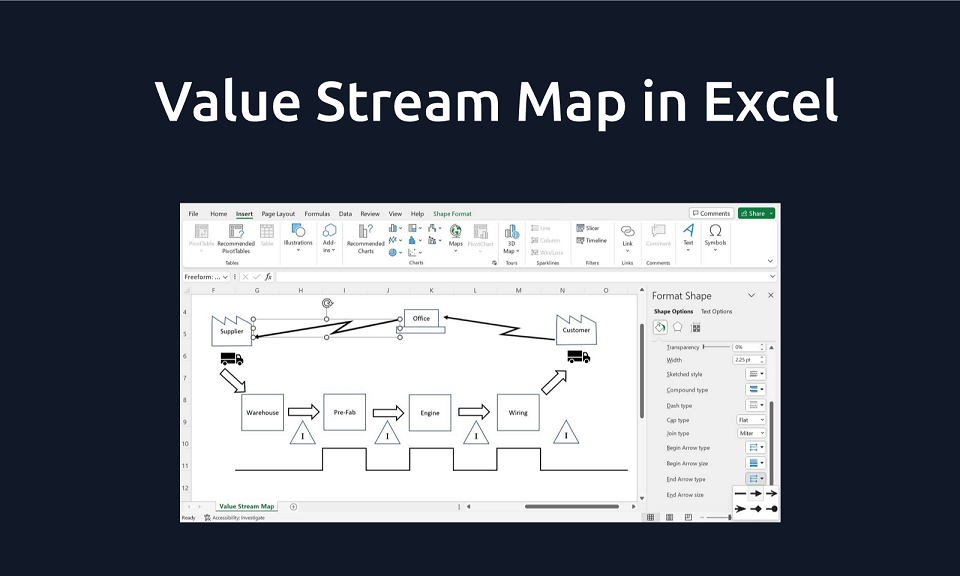
Read articleA value stream map is important for organizations to minimize waste and maximize efficiency. This blog will teach you how to do value stream mapping in excel.
Read articleDBMS is an important part in many organizations and so is understanding what an entity is. Read this blog to know all you need to know about entity in DBMS.
Read articleAgile marketing is an approach that adapts perfectly to this dynamic and competitive industry. boardmix is the perfect tool to bring your strategy to life.
Read articleEvery project manager knows the significance of the activity network diagram. Create an AON diagram for your project using boardmix.
Read articleCompare ten whiteboards for remote teamwork, from live brainstorming to asynchronous comments, saved decisions and follow-up tasks.
Read articleLearn how a context diagram defines a system boundary, how it differs from a flowchart, and how to label data flows in three examples.
Read articleTry another keyword or browse all topics.
Keep exploring ideas for visual work and collaboration.
Visit the Boardmix blog