

Venn Diagram
#Diagram creator
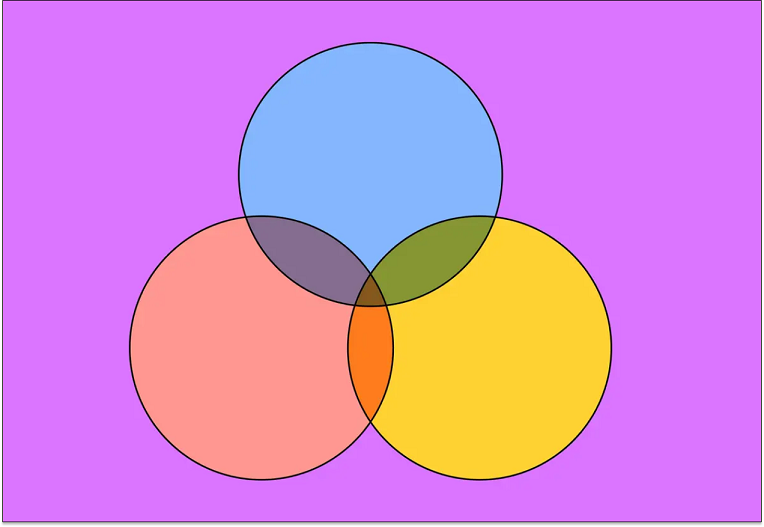
Exploring Venn Circles:
A Guide to 4-Way Venn Diagrams
This article delves deep into the concept of Venn circles, with a particular focus on 4-way Venn diagrams. Discover how these diagrams can simplify complex data analysis, enhance understanding, and aid in decision-making.
Posted by Mackenzie Carter | 2024-07-18
Read more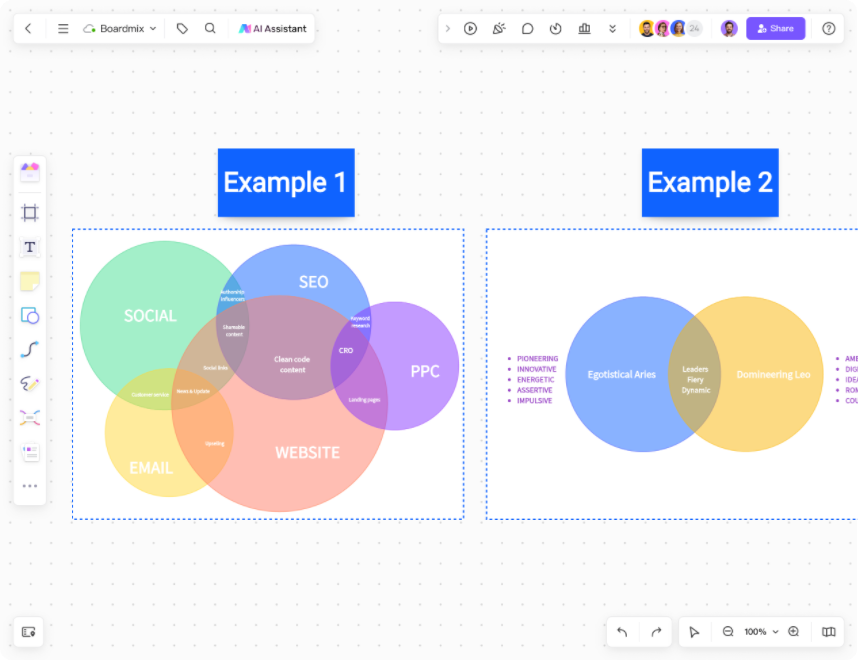
Explore AI Tool
All-in-One Whiteboard AI Tool, Enhance Productivity, Creativity, and Collaboration
Boardmix AI is an AI tool integrated into the digital whiteboard. Effortlessly generate mind maps, flowcharts, presentations, and business canvases. Bring sketches to life, create images, organize tasks, and perform business analysis—all within one versatile platform.
Use Boardmix AI Now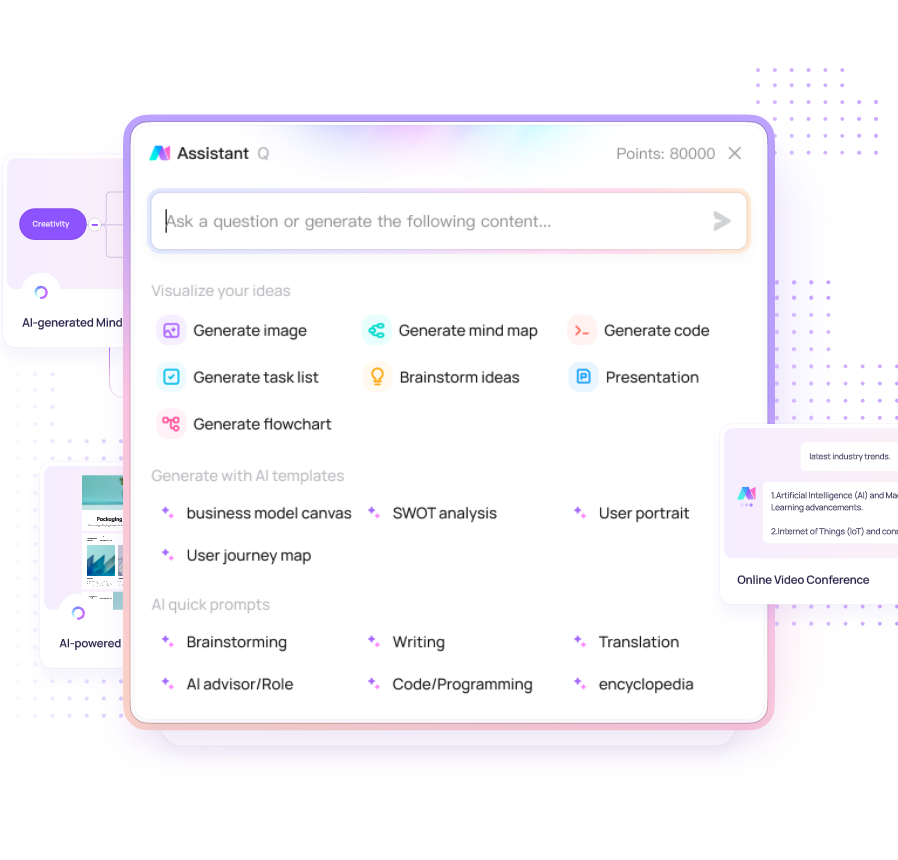
#Diagram creator
Workflow Diagrams for Client Onboarding: Simplify Processes
Client onboarding is crucial yet complex. Workflow diagrams with stages, decision points, and visual cues simplify it. Boardmix helps create them easily. Follow steps like logging in, choosing templates, etc. Remember to be specific, simple, update, and seek feedback. Diagrams enhance onboarding.

#Diagram creator
Flowchart for Hydroelectric Energy: Simplify Complex Process
Hydroelectric flowchart illustrates how energy flows from water reservoirs to the power grid, and learn the process behind hydroelectric power can be simplified with a flowchart.
#Diagram creator
Flowchart to Show the Relationship Between Domains and Kingdoms
Simplify biological classifications with the flowchart to show the relationship between domains and kingdoms. Learn how to visualize the relationship between domains and kingdoms using Boardmix.
#Diagram creator
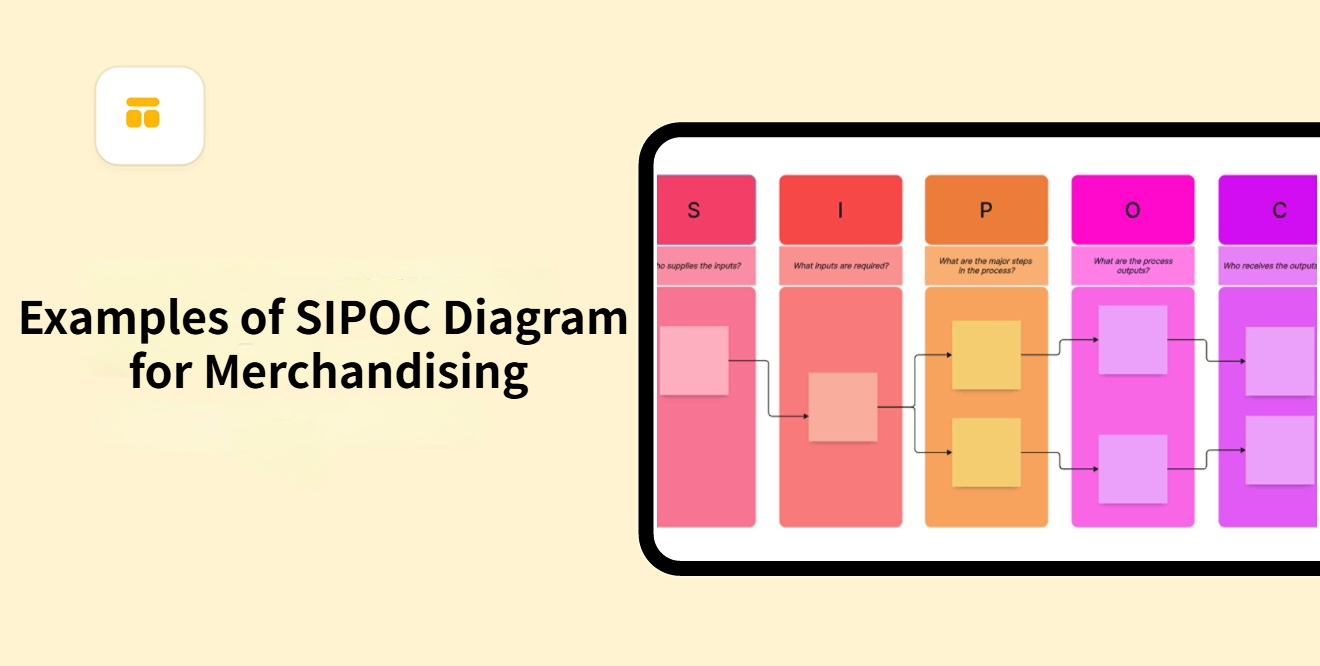
6 Examples of SIPOC Diagram for Merchandising: Process Optimization
SIPOC diagram for merchandising is a valuable tool for process optimization, providing a clear overview of key components. Boardmix is an intuitive platform with customizable templates that allows teams to design, collaborate, and refine SIPOC diagrams efficiently.
#Diagram creator
USF Honors Flowchart Computer Science: Enpower Your CS Path
Simplify your USF computer science journey with the honors flowchart. Learn how to plan effectively and create your flowchart online with Boardmix.

#Diagram creator
How to Use a Loop Limit Symbol in Flowchart
The Loop Limit Symbol plays a crucial role in managing repetitive processes in flowcharts. Boardmix simplifies its application with a comprehensive shape library, templates, and real-time collaboration features.
#Diagram creator
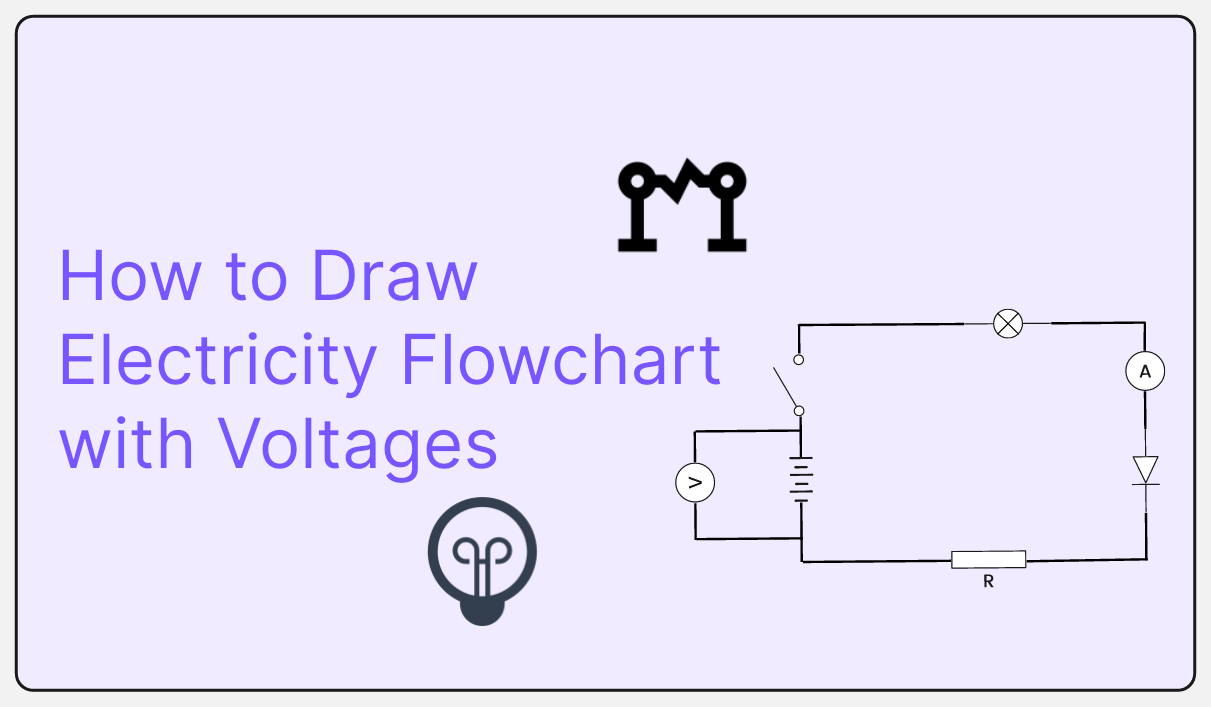
How to Draw Electricity Flowchart with Voltages
Discover how to create professional electricity flowcharts with voltages using Boardmix. Learn the steps, benefits, and tips for seamless diagramming.
#Diagram creator
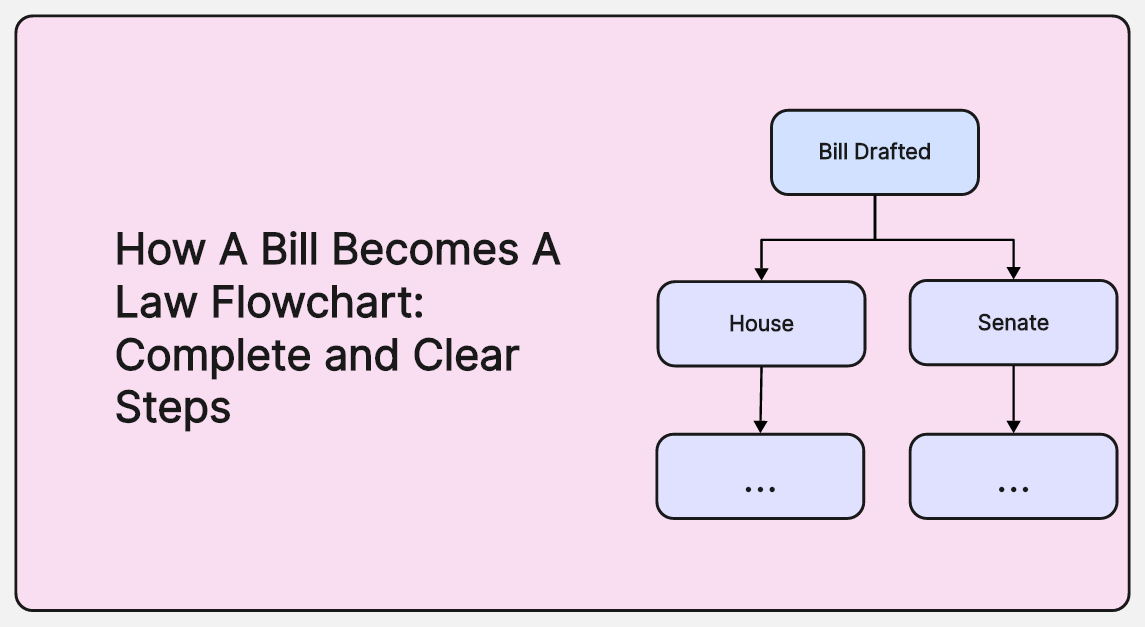
How A Bill Becomes A Law Flowchart: Complete and Clear Steps
Discover the complete steps of the legislative process with our "How a Bill Becomes a Law Flowchart." Learn how Boardmix, an online collaborative tool, makes creating professional flowcharts easy and efficient.
#Diagram creator
Best Tool to Create Work Flows and Documents 2025
The best tools to create workflows and documents are essential for productivity. Boardmix, with its customizable templates, AI-powered features, and real-time collaboration, stands out as a top choice for efficient workflow and document creation.
#Diagram creator
10 Flowchart Examples for Selections: Simplify Your Choices
Discover 10 flowchart examples for selections, from algorithms to business workflows. Use Boardmix templates to create, customize, and simplify your flowchart effortlessly!
#Diagram creator
Best Calendar Organizational Map for 2025
The best calendar organizational map helps prioritize tasks and meet deadlines. Boardmix provides customizable templates and real-time collaboration, making it ideal for organizing and achieving goals in 2025.
#Diagram creator
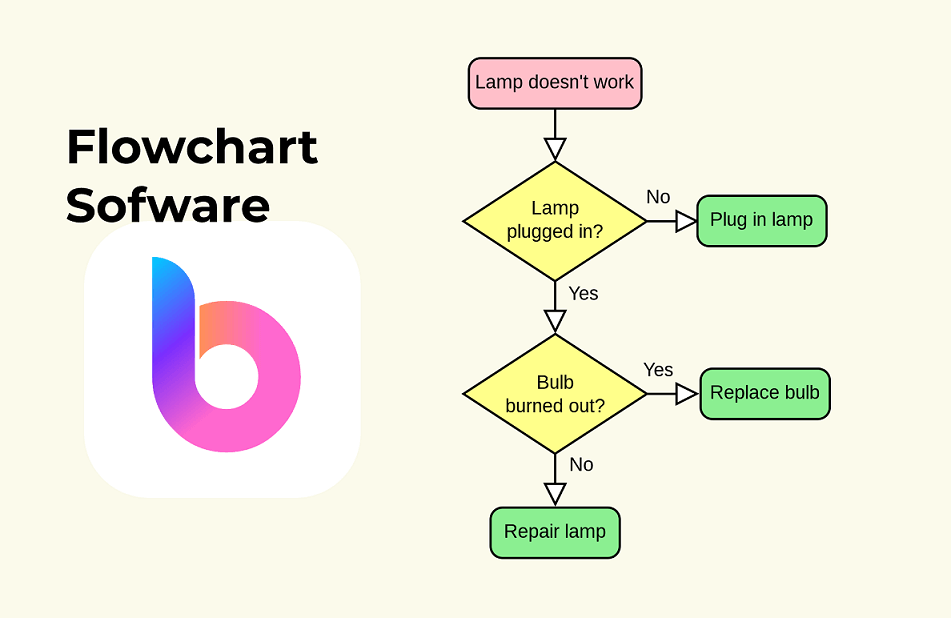
Best Flowchart Software 2025: Free & Paid
This guide showcases the best software for flowchart in 2025, including both free and paid options. Boardmix stands out as the best free flowchart tool, offering a vast library of templates, AI-assisted flowchart features, and real-time collaboration capabilities.
#Diagram creator
Types of Flowcharts: Unraveling the Diversity
Delves into the various types of flowcharts, explore their applications, and learn how to create them effectively using Boardmix.
#Diagram creator
6 State Diagram Examples: Tips & Draw It Online
Learn with practical state diagram simple and how to use state diagrams. Discover their application in various situations to optimize your projects.
#Diagram creator
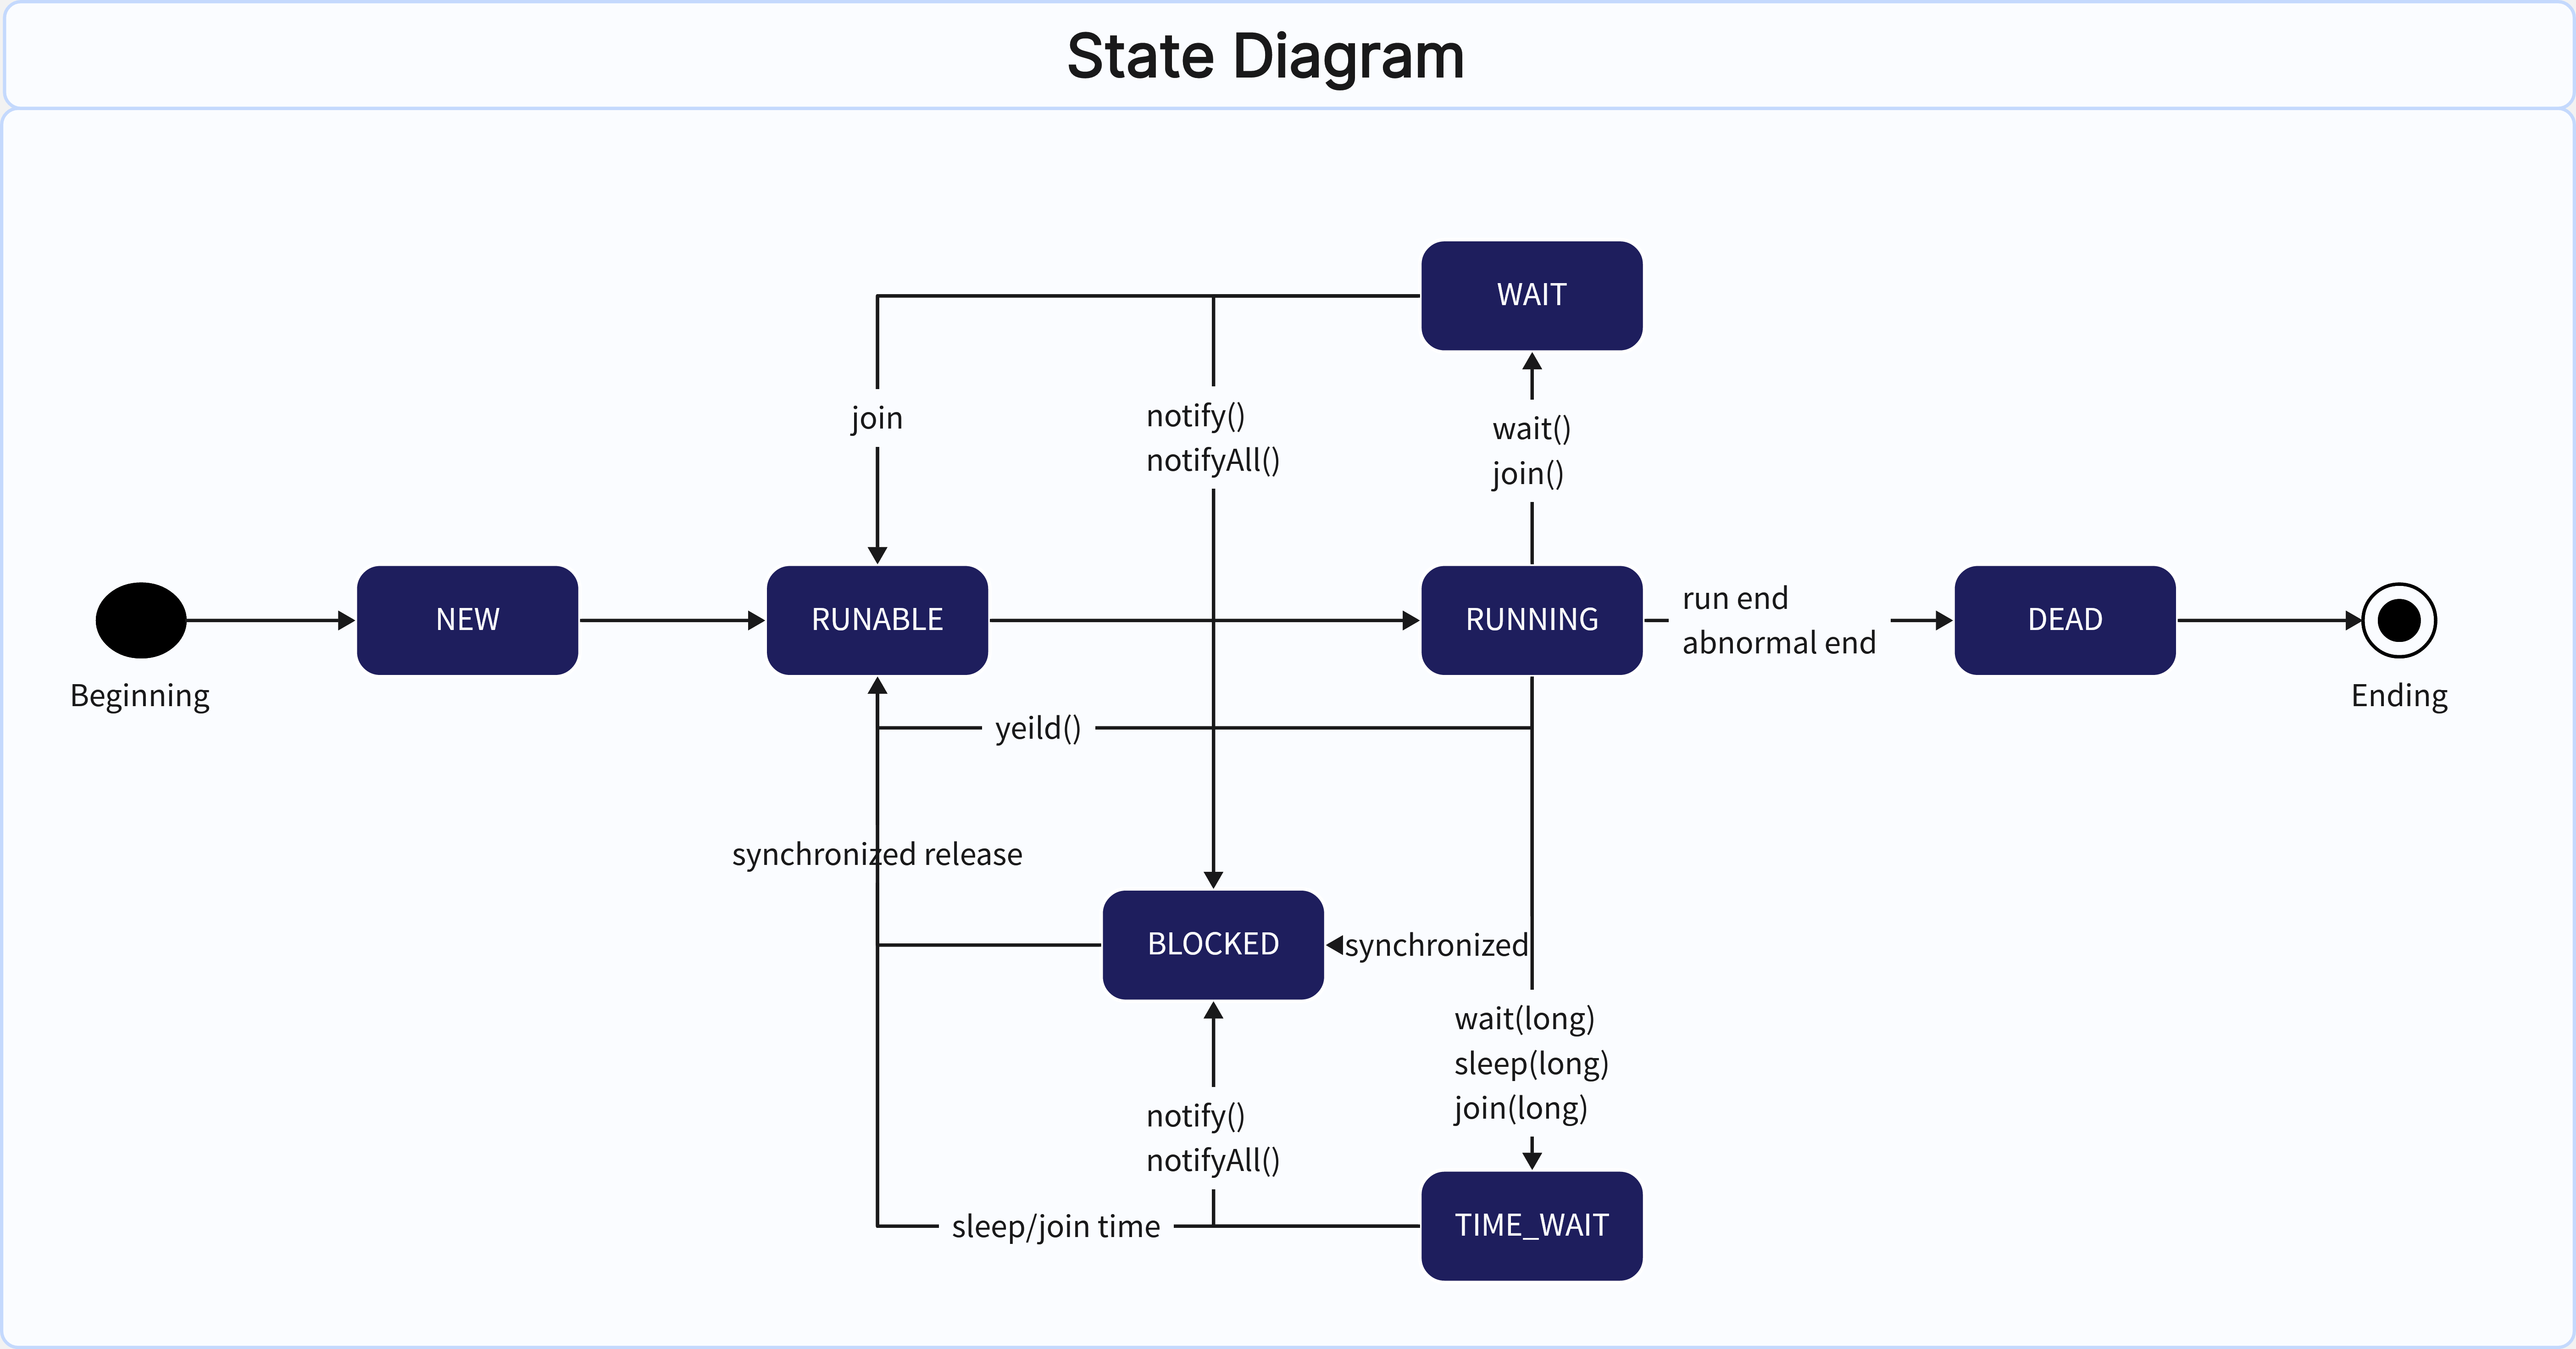
What is State Diagram: Complete Tutorial
Discover our comprehensive tutorial on the state diagram. Explore fundamental concepts, practical examples, and expert tips to master this essential tool in systems analysis.
#Diagram creator
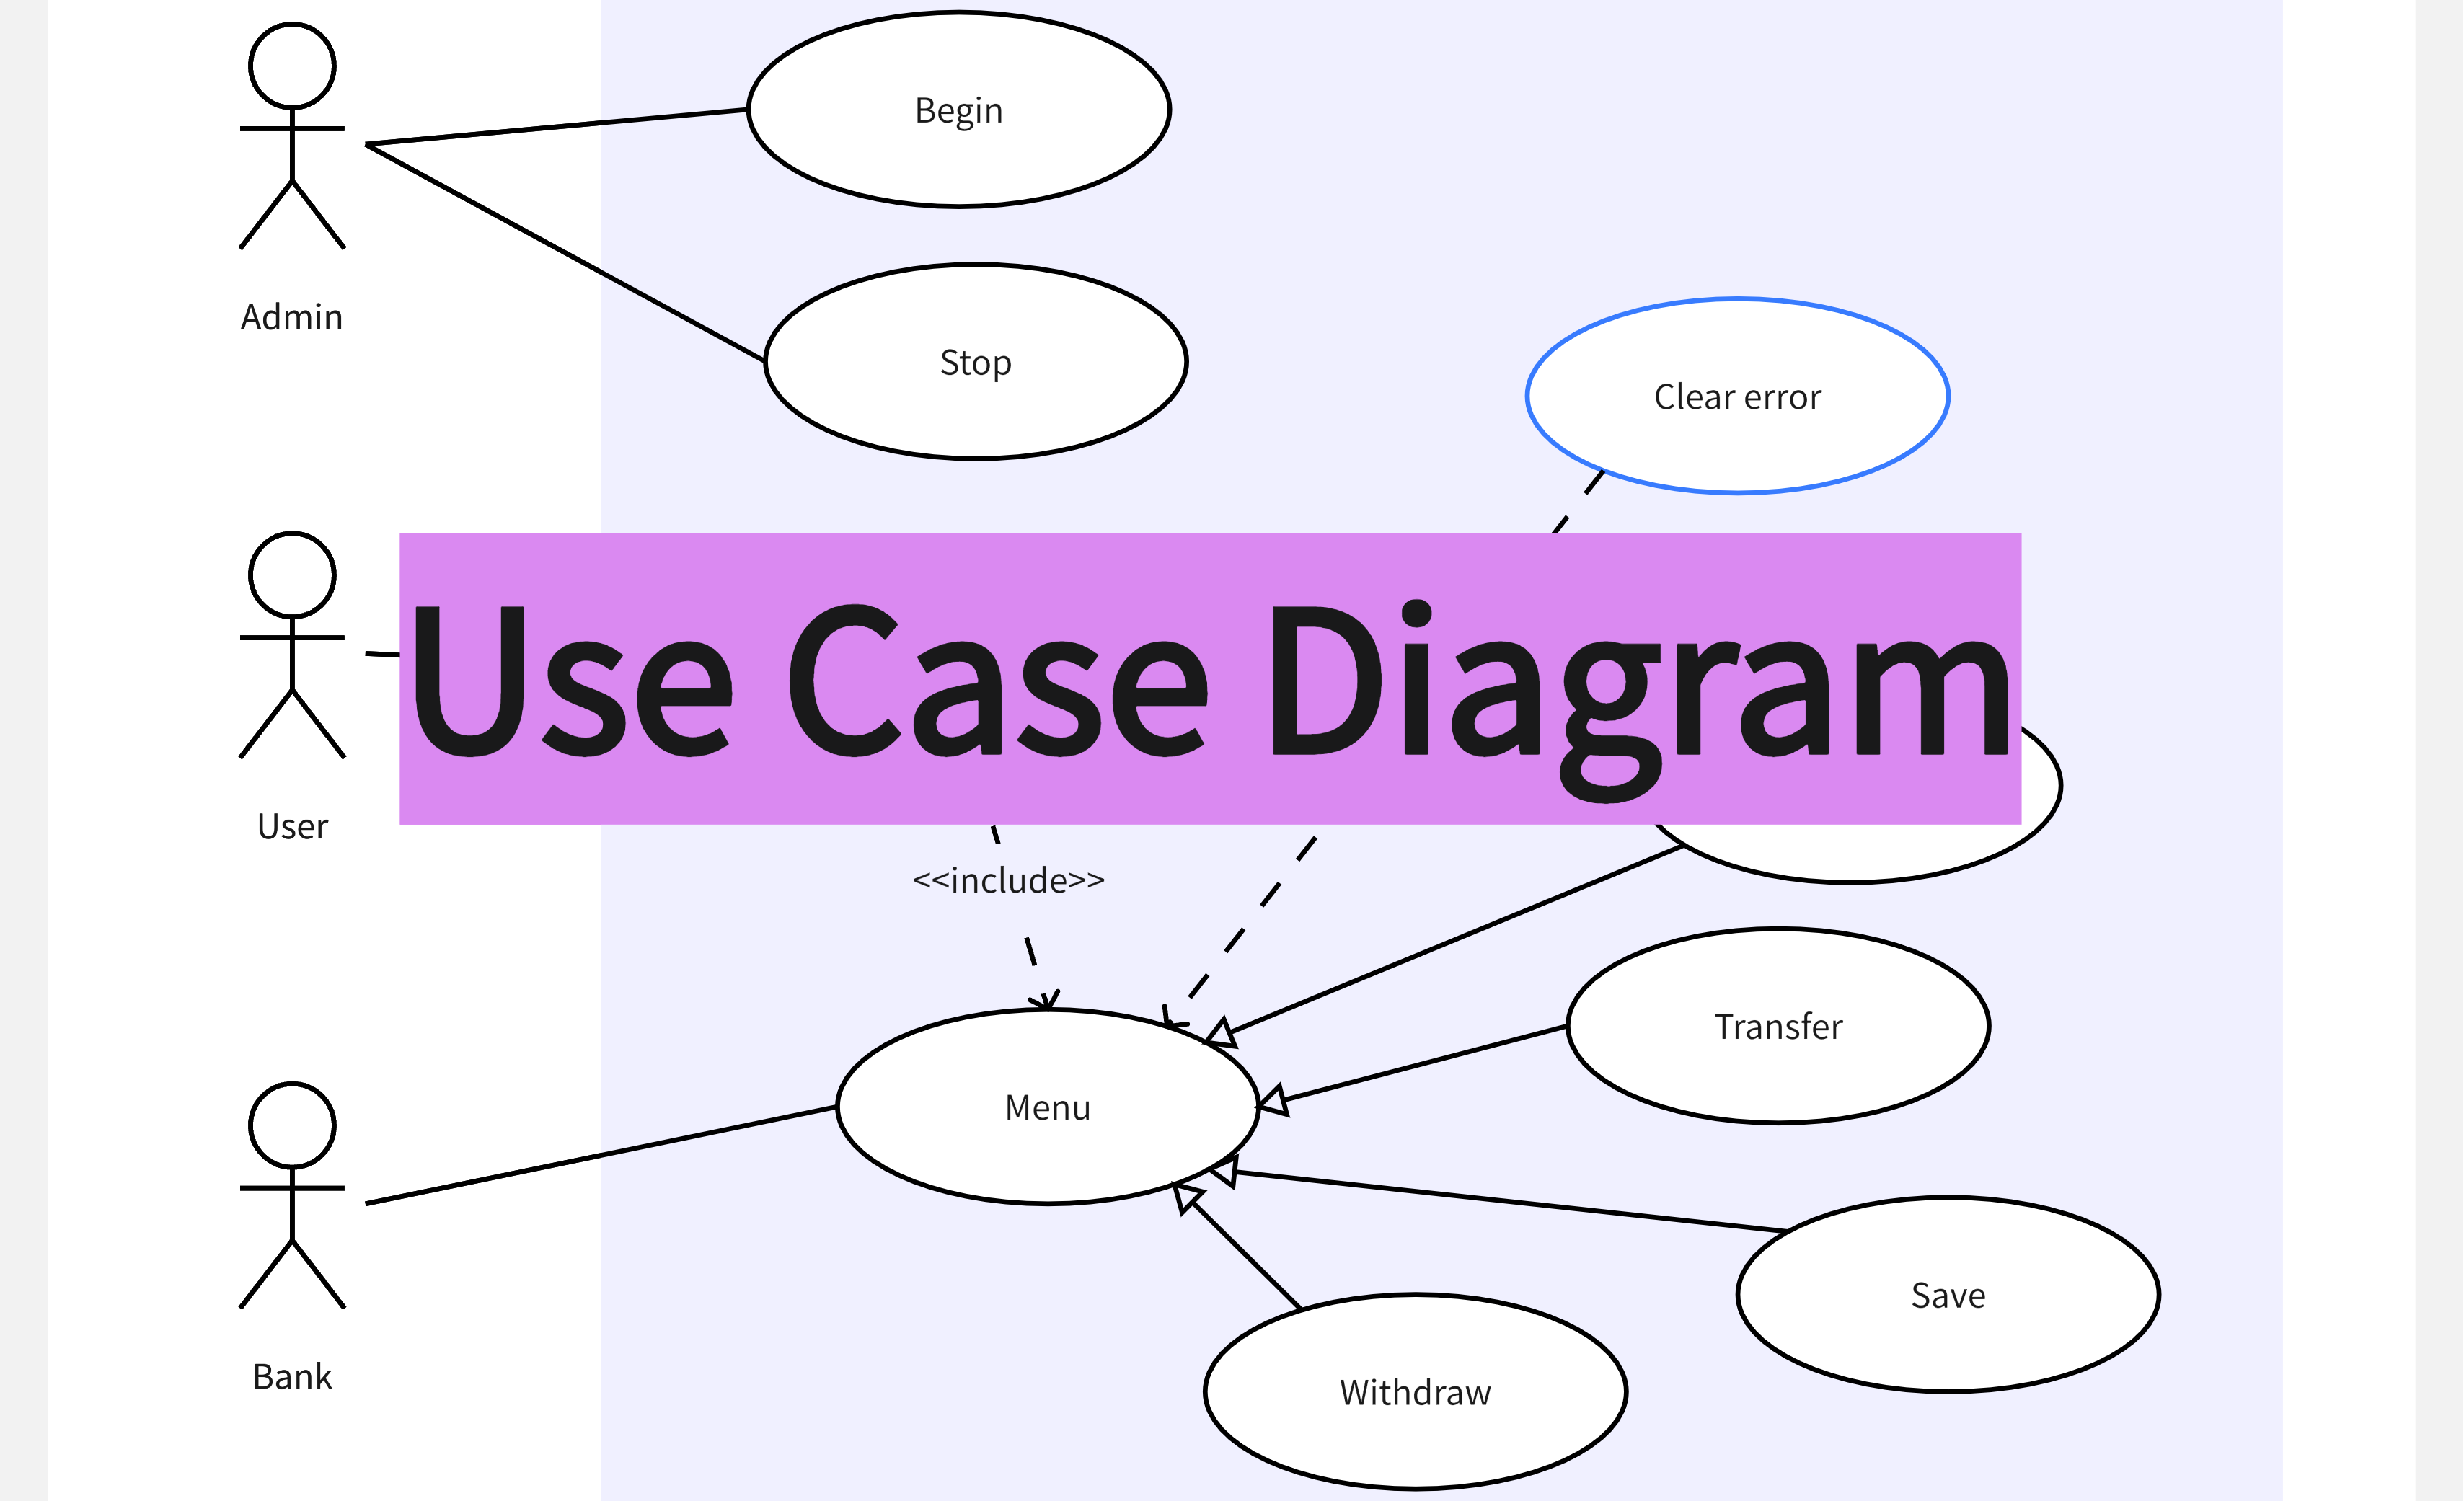
How to Make Use Cases Diagram with Online Whiteboard
Delves into the essence of what a use case diagram is, explores why online whiteboards are the ideal medium for creating them, and provides a comprehensive guide on how to create a use case diagram using Boardmix.
#Diagram creator
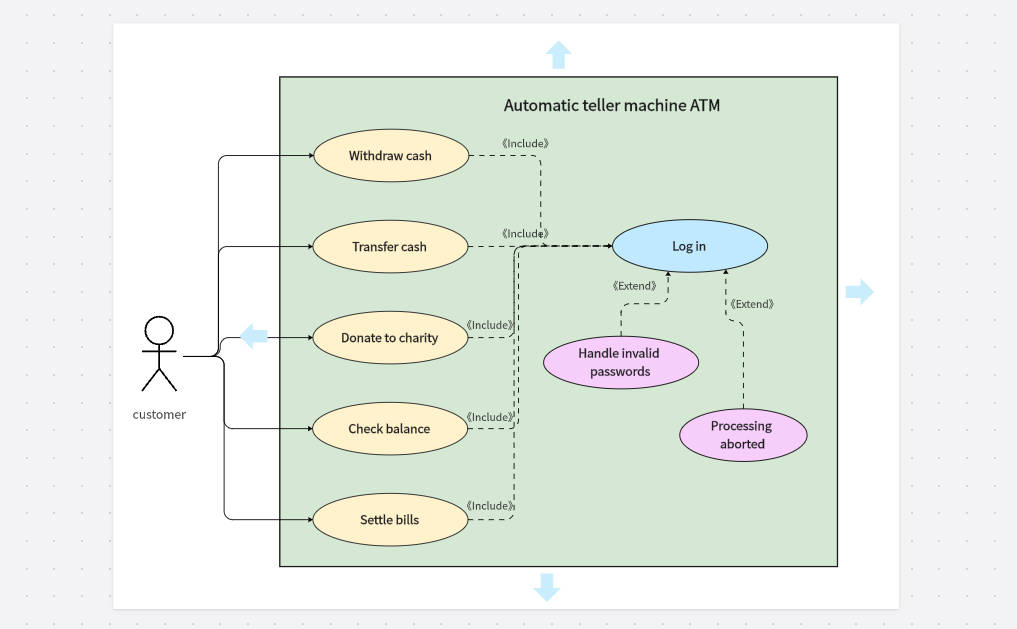
Discover Free Online Use Case Diagrams Makers & Examples
Explore free online use case diagram makers and examples to visualize system interactions effectively. Simplify complex processes with powerful tools and templates!
#Diagram creator
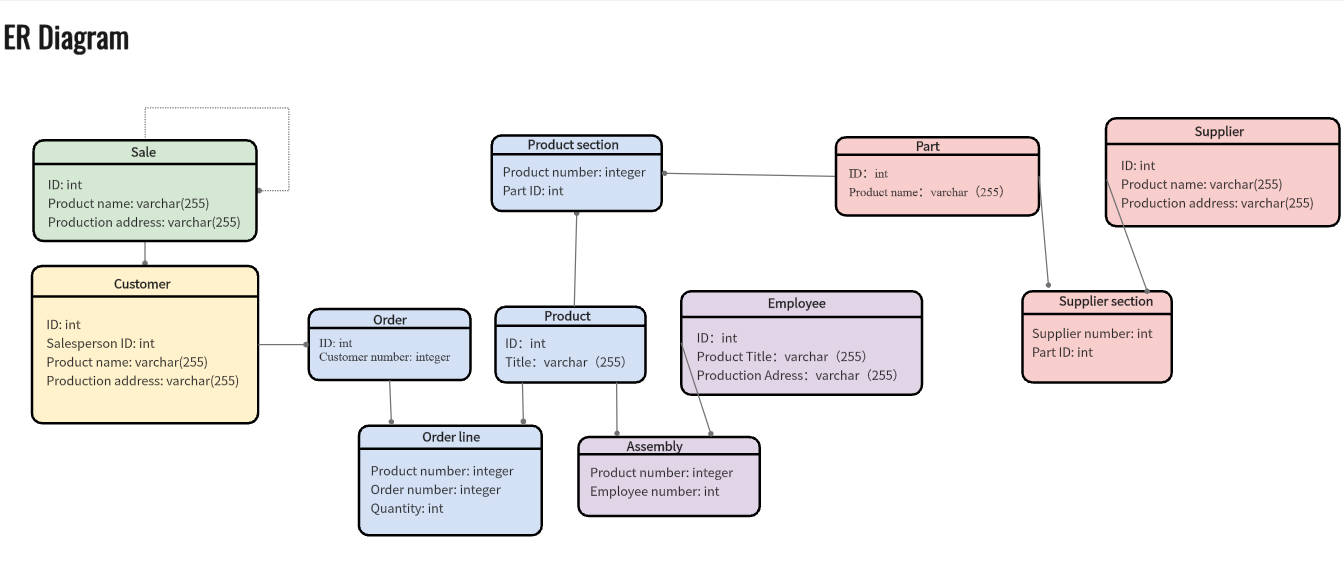
Create an Entity Relationship Diagram Online
Discover the 8 best online tools to create entity relationship diagrams efficiently. Improve your projects with our expert recommendations.
#Diagram creator
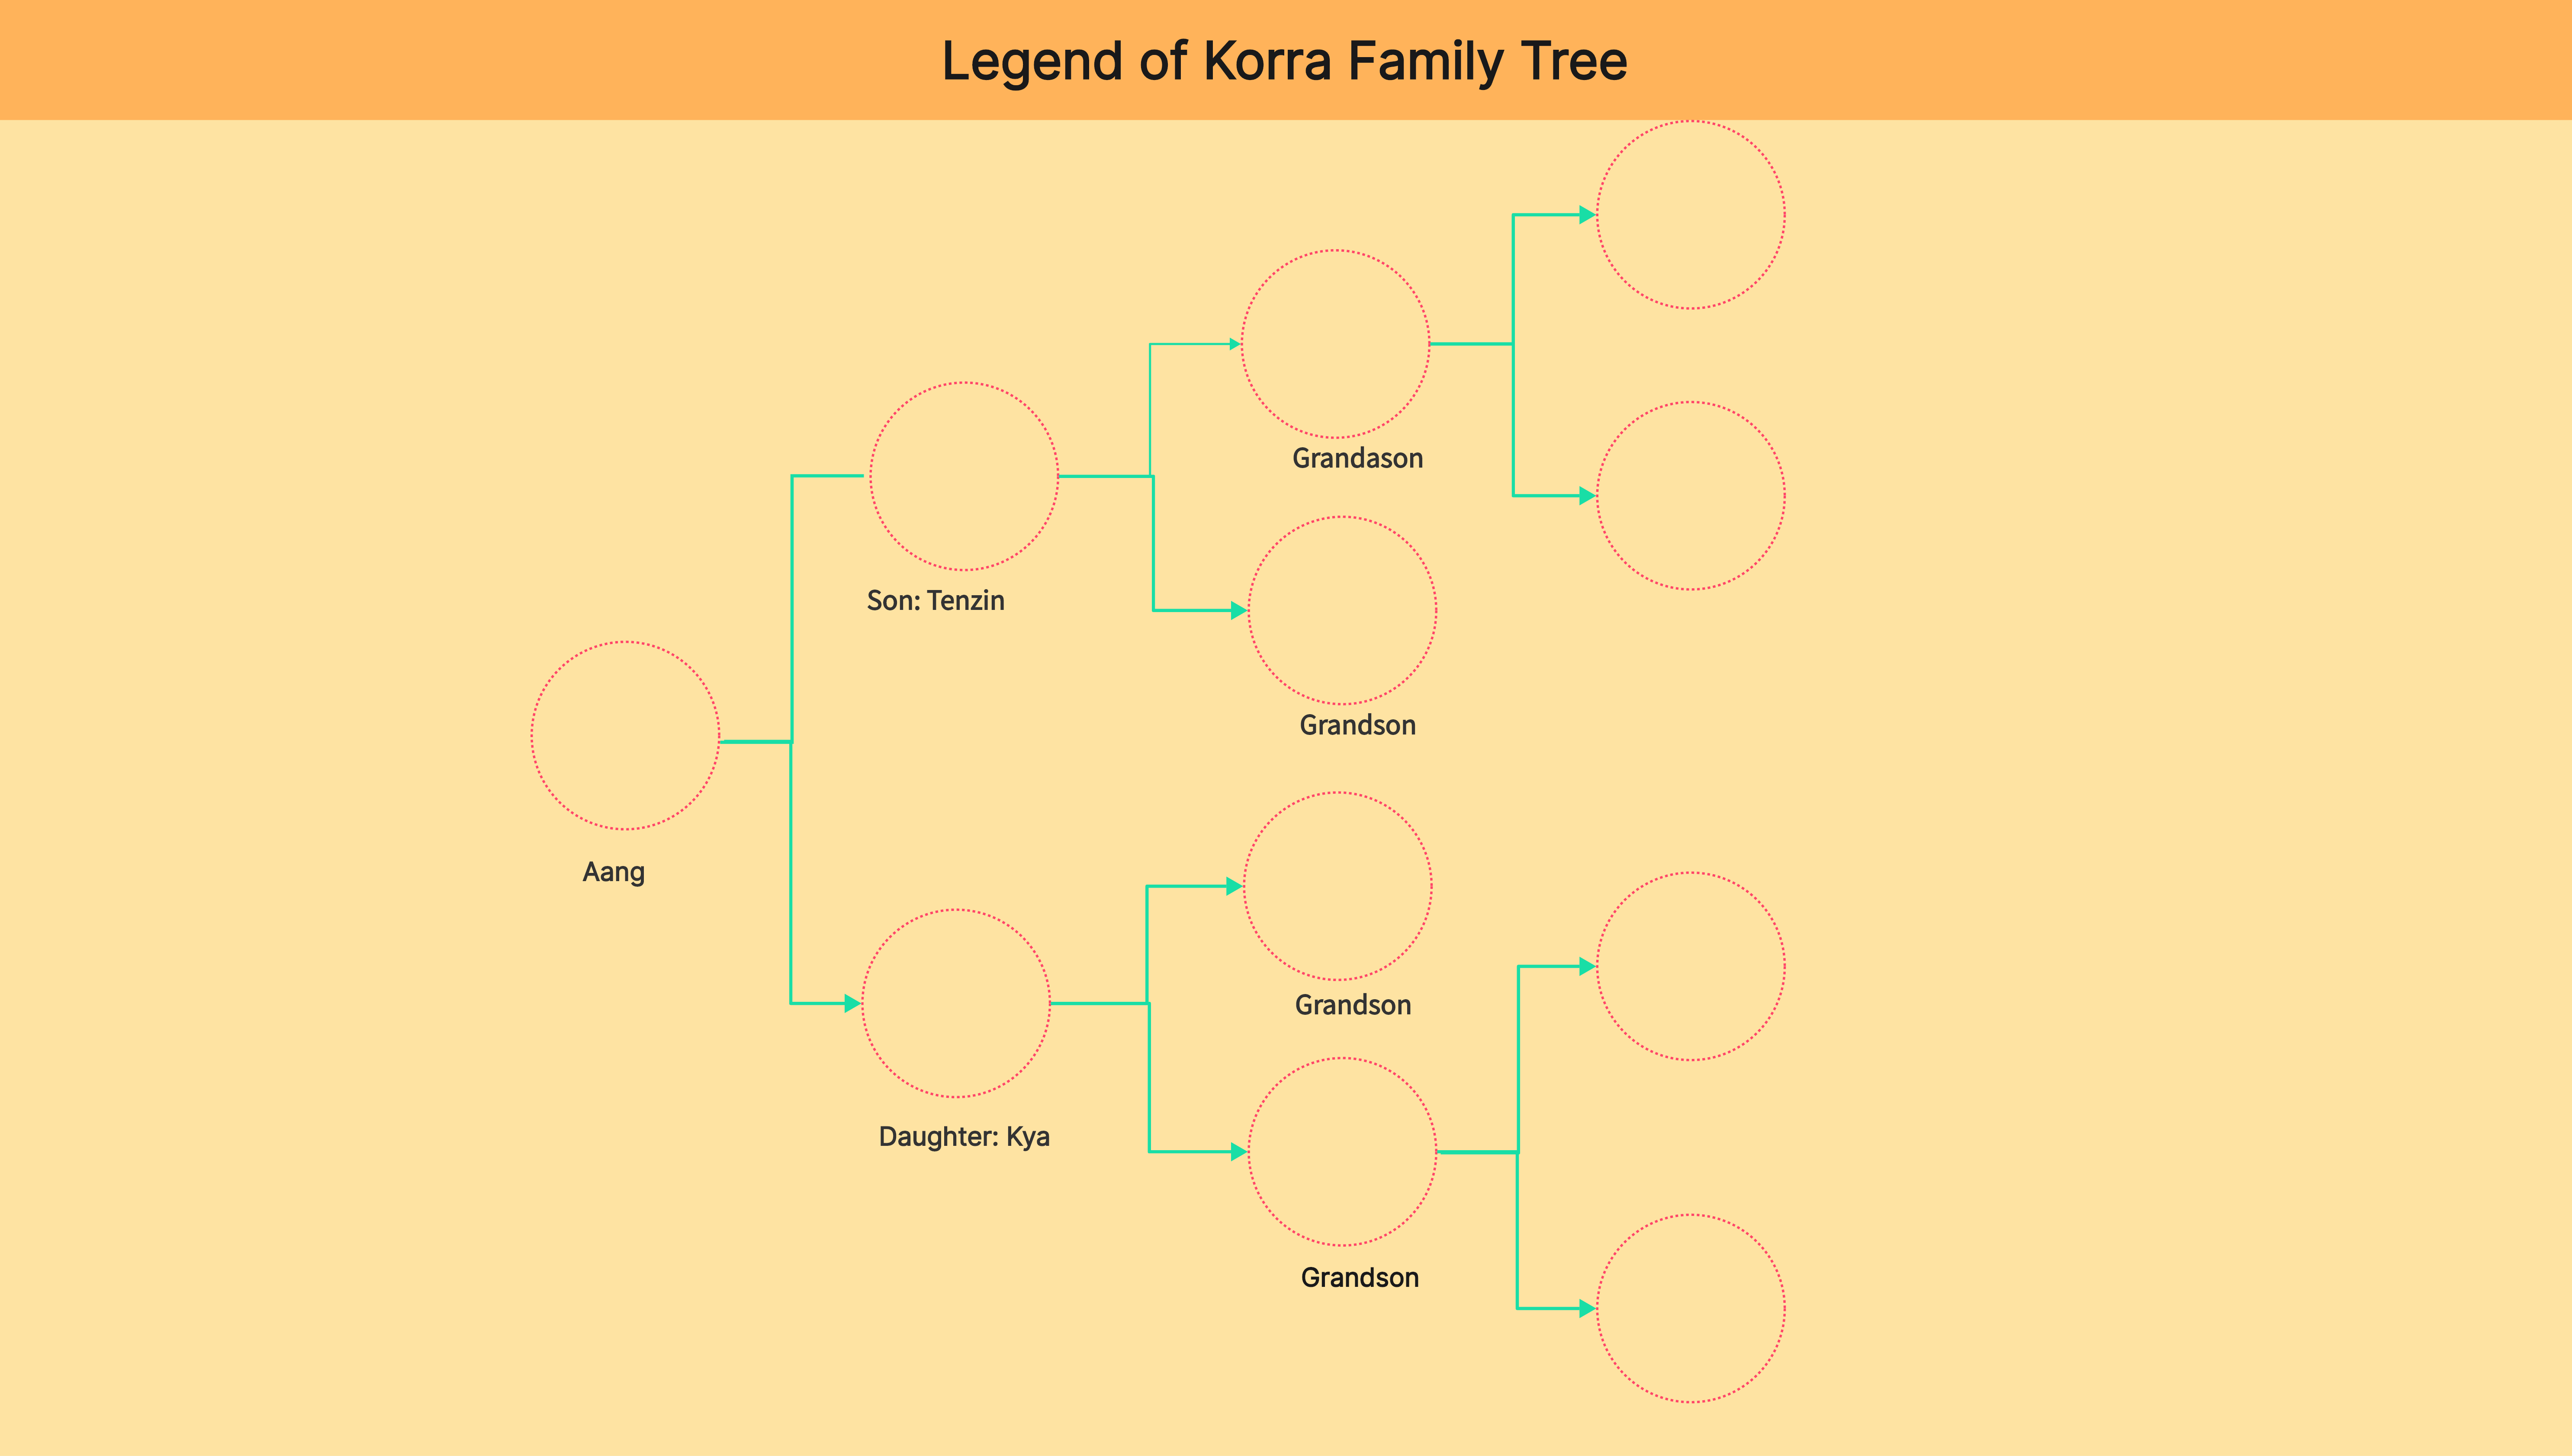
How to Create a Legend of Korra Family Tree Effectively
Explore The Legend of Korra's characters and legacies through a customizable family tree using Boardmix, uncovering deep connections, rich histories, and the evolving world of this beloved series.
![Family Trees for Career and Legacy Insights [Free Blank Templates]](https://boardmix.com/assets/family-tree-cover1_0b15a070b70e378e139c.png)
#Diagram creator
Family Trees for Career and Legacy Insights [Free Blank Templates]
Boardmix offers free blank family tree templates to explore career and legacy insights. Visualize career and legacy journeys of famous families and build your legacy strategy with Boardmix' blank family tree templates.
#Diagram creator
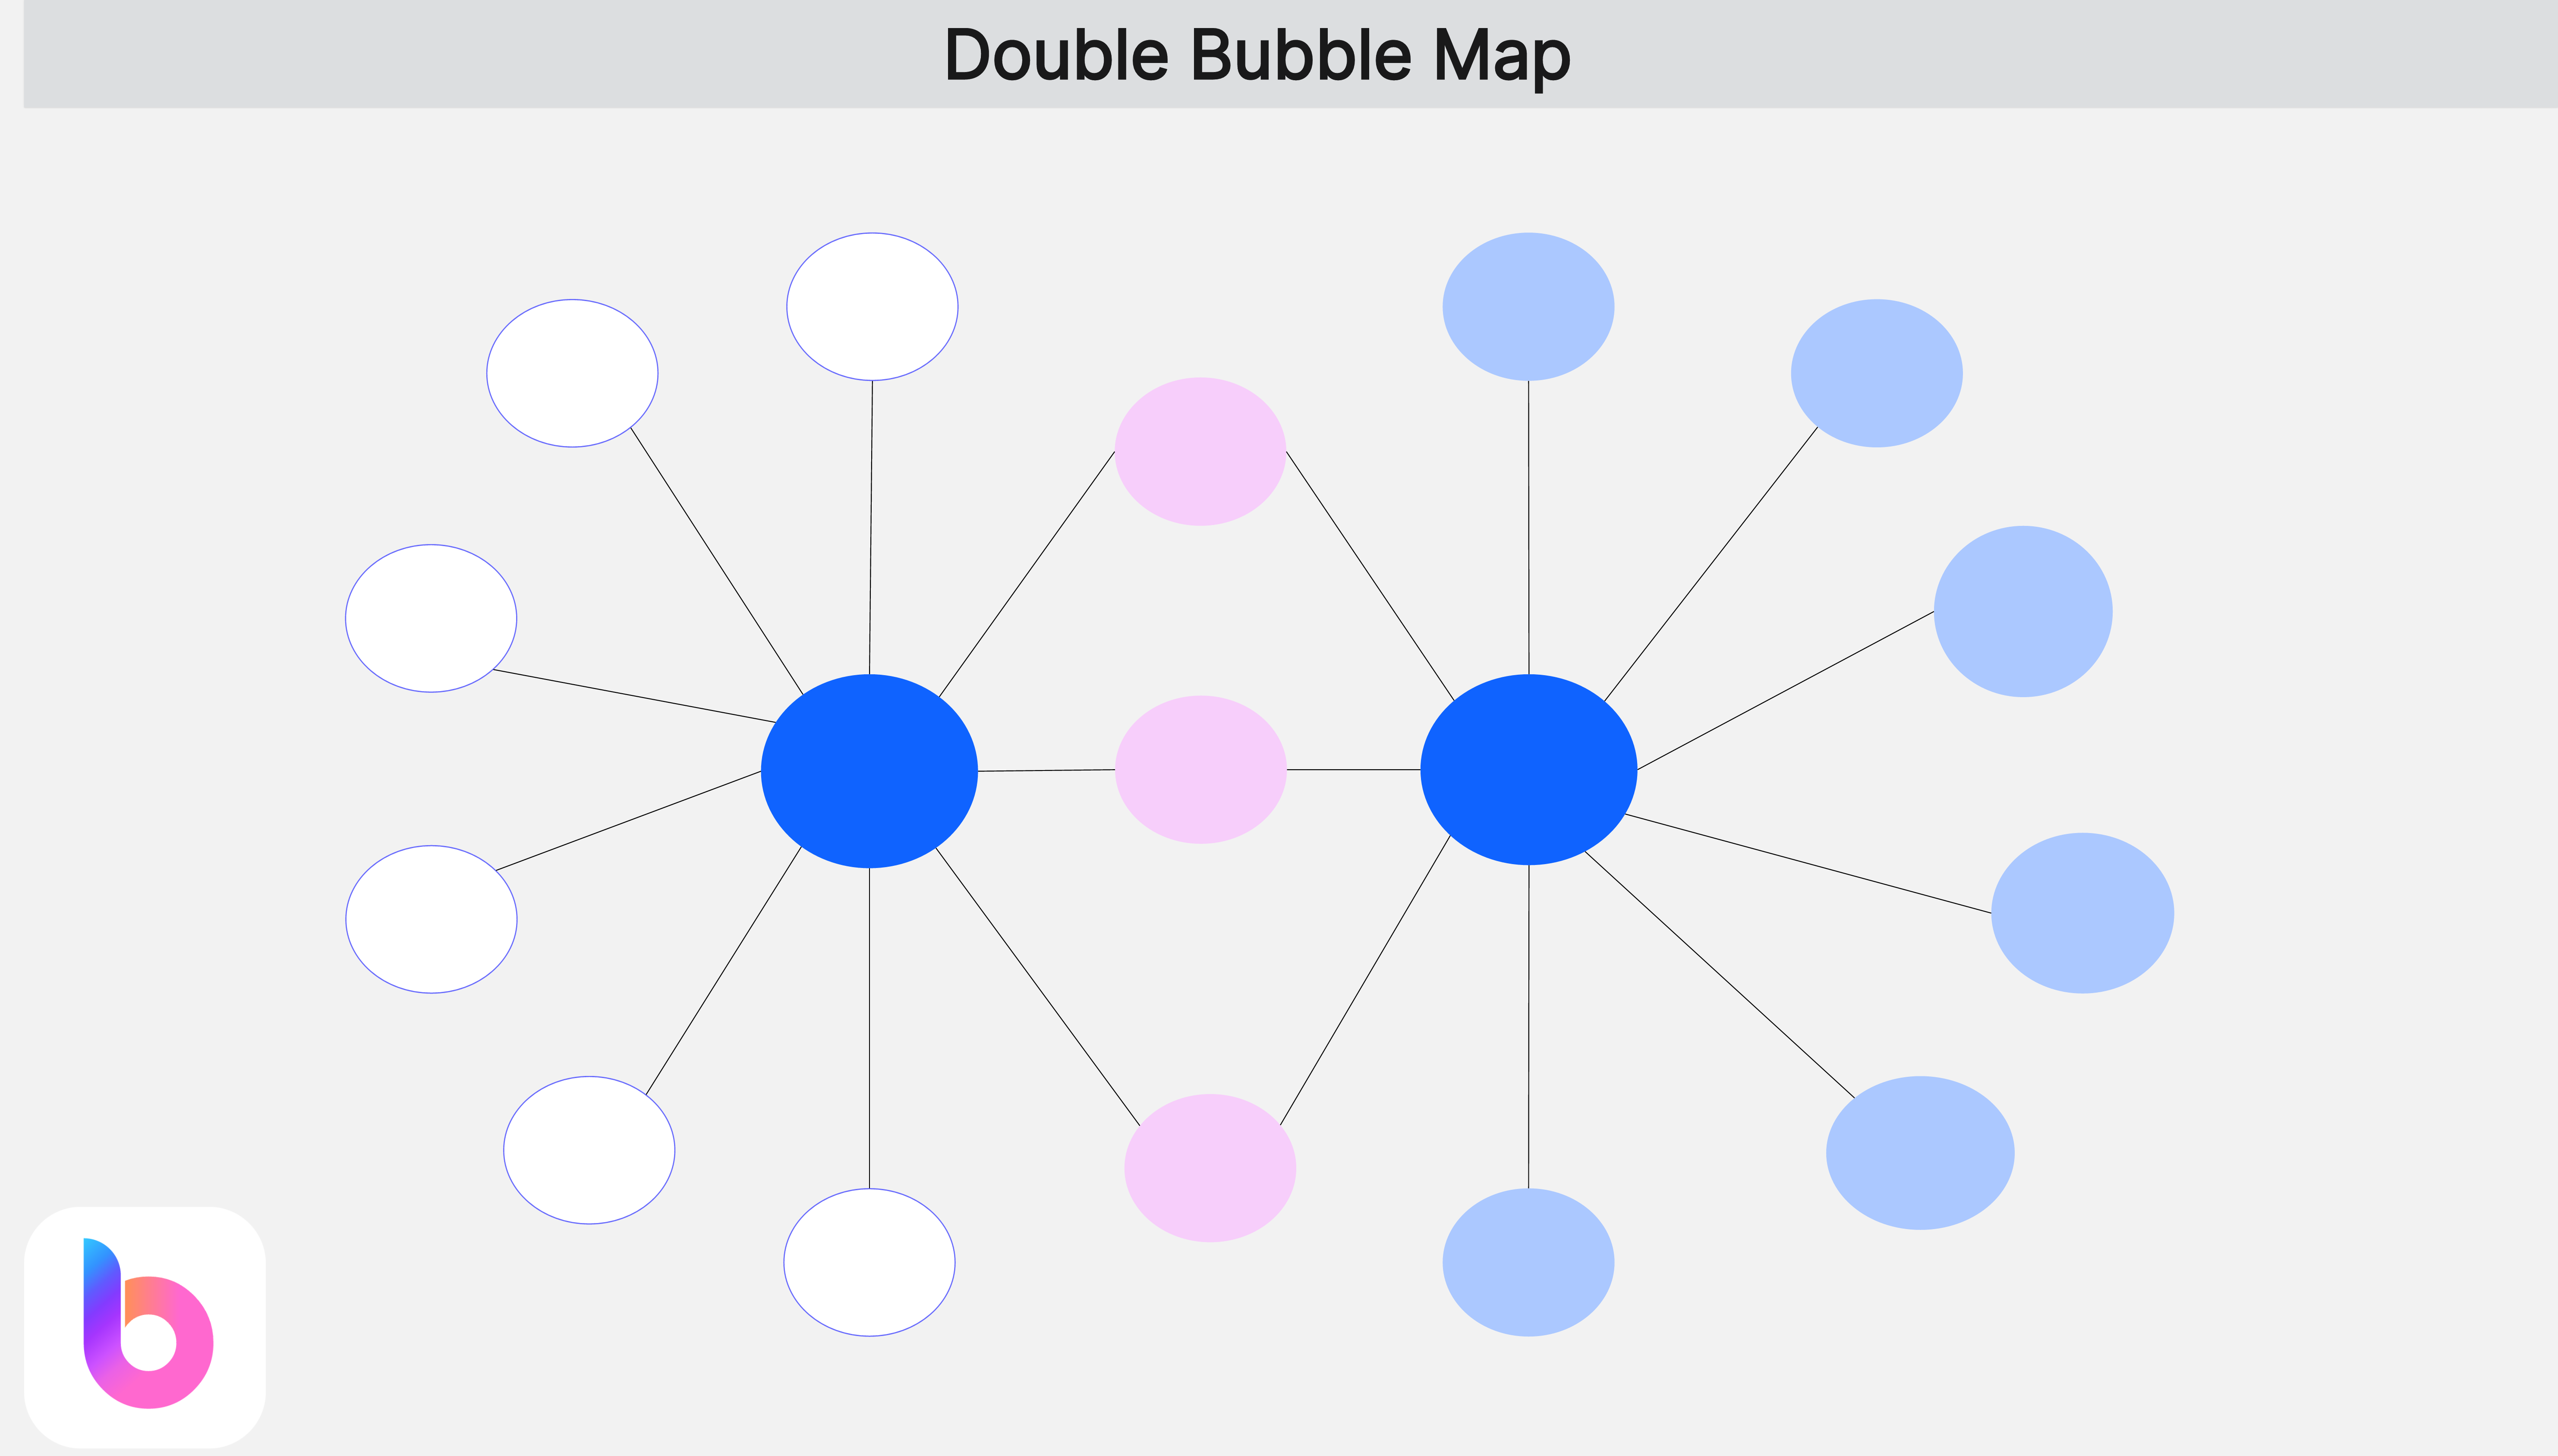
Double Bubble Map Maker: Edit Online & Download PDF
Discover the power of Double Bubble Maps to compare ideas effectively. Learn how to create, customize, and download templates with examples for education, business, and personal use.
#Diagram creator
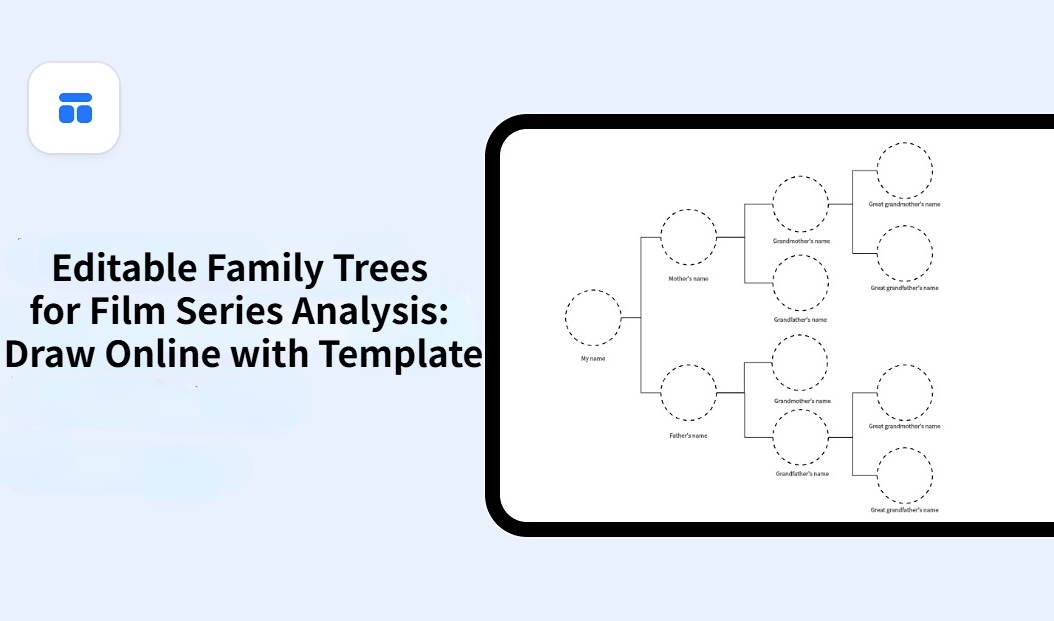
Editable Family Trees for Film Series Analysis: Draw Online with Template
With editable family tree templates, Boardmix can help you create insightful family trees for film series analysis. Organize and visualize character dynamics and storylines effectively with Boardmix editable family tree templates.
#Diagram creator
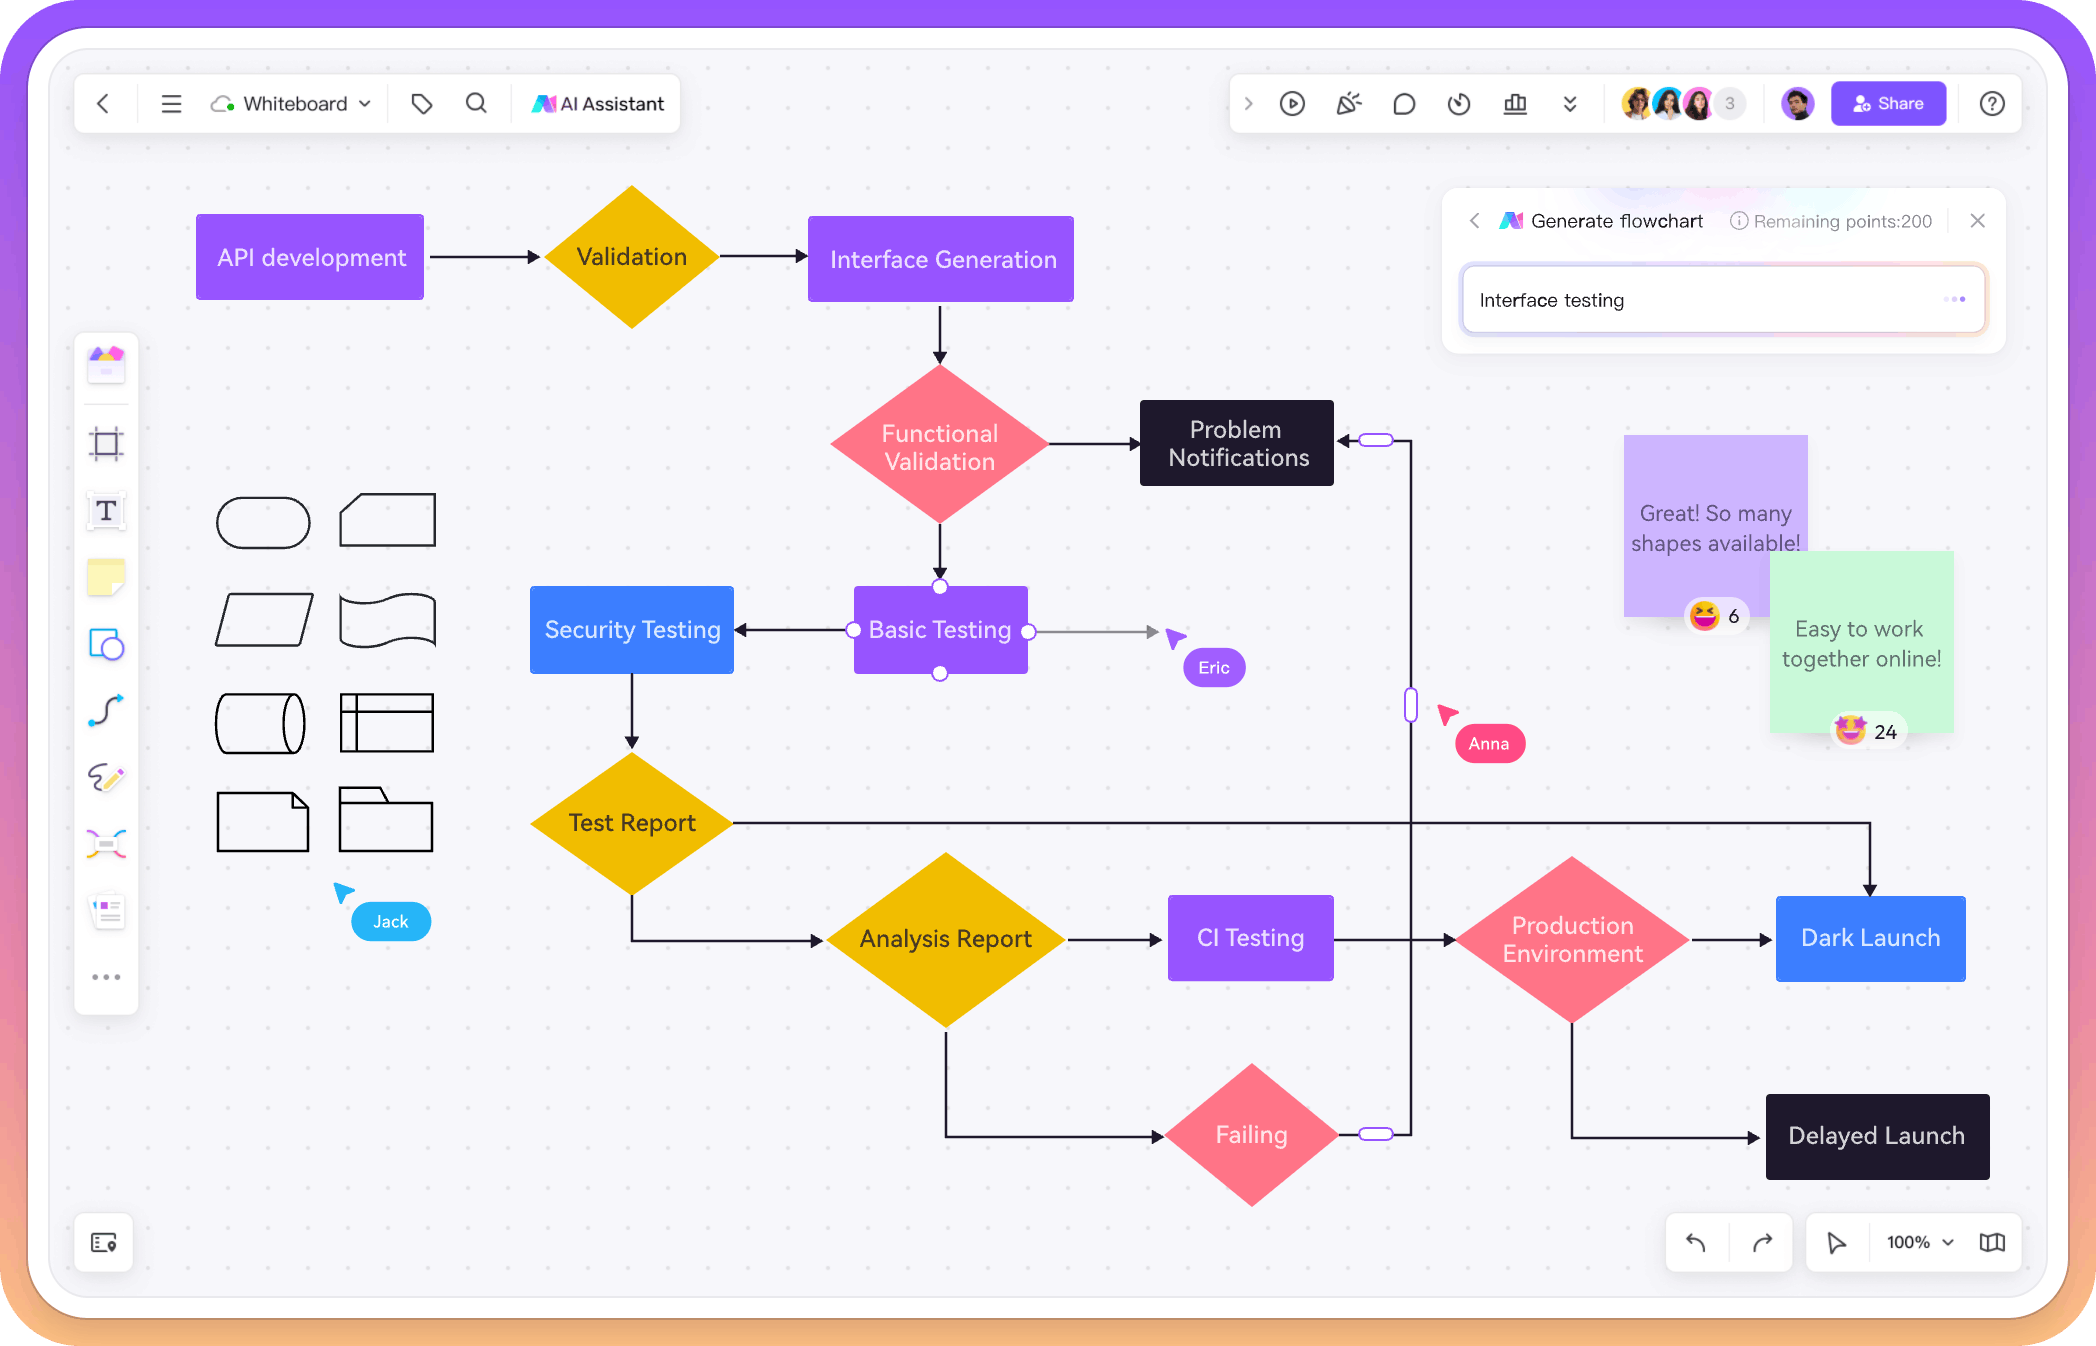
AI Flowchart Generators for Smart Visual Workflows
Explores how AI flowchart generators can transform your workflow, delve into the workings of AI flowchart makers, and take a deep dive into Boardmix, a multifunctional AI flowchart maker that stands out for its features and ease of use.
#Diagram creator
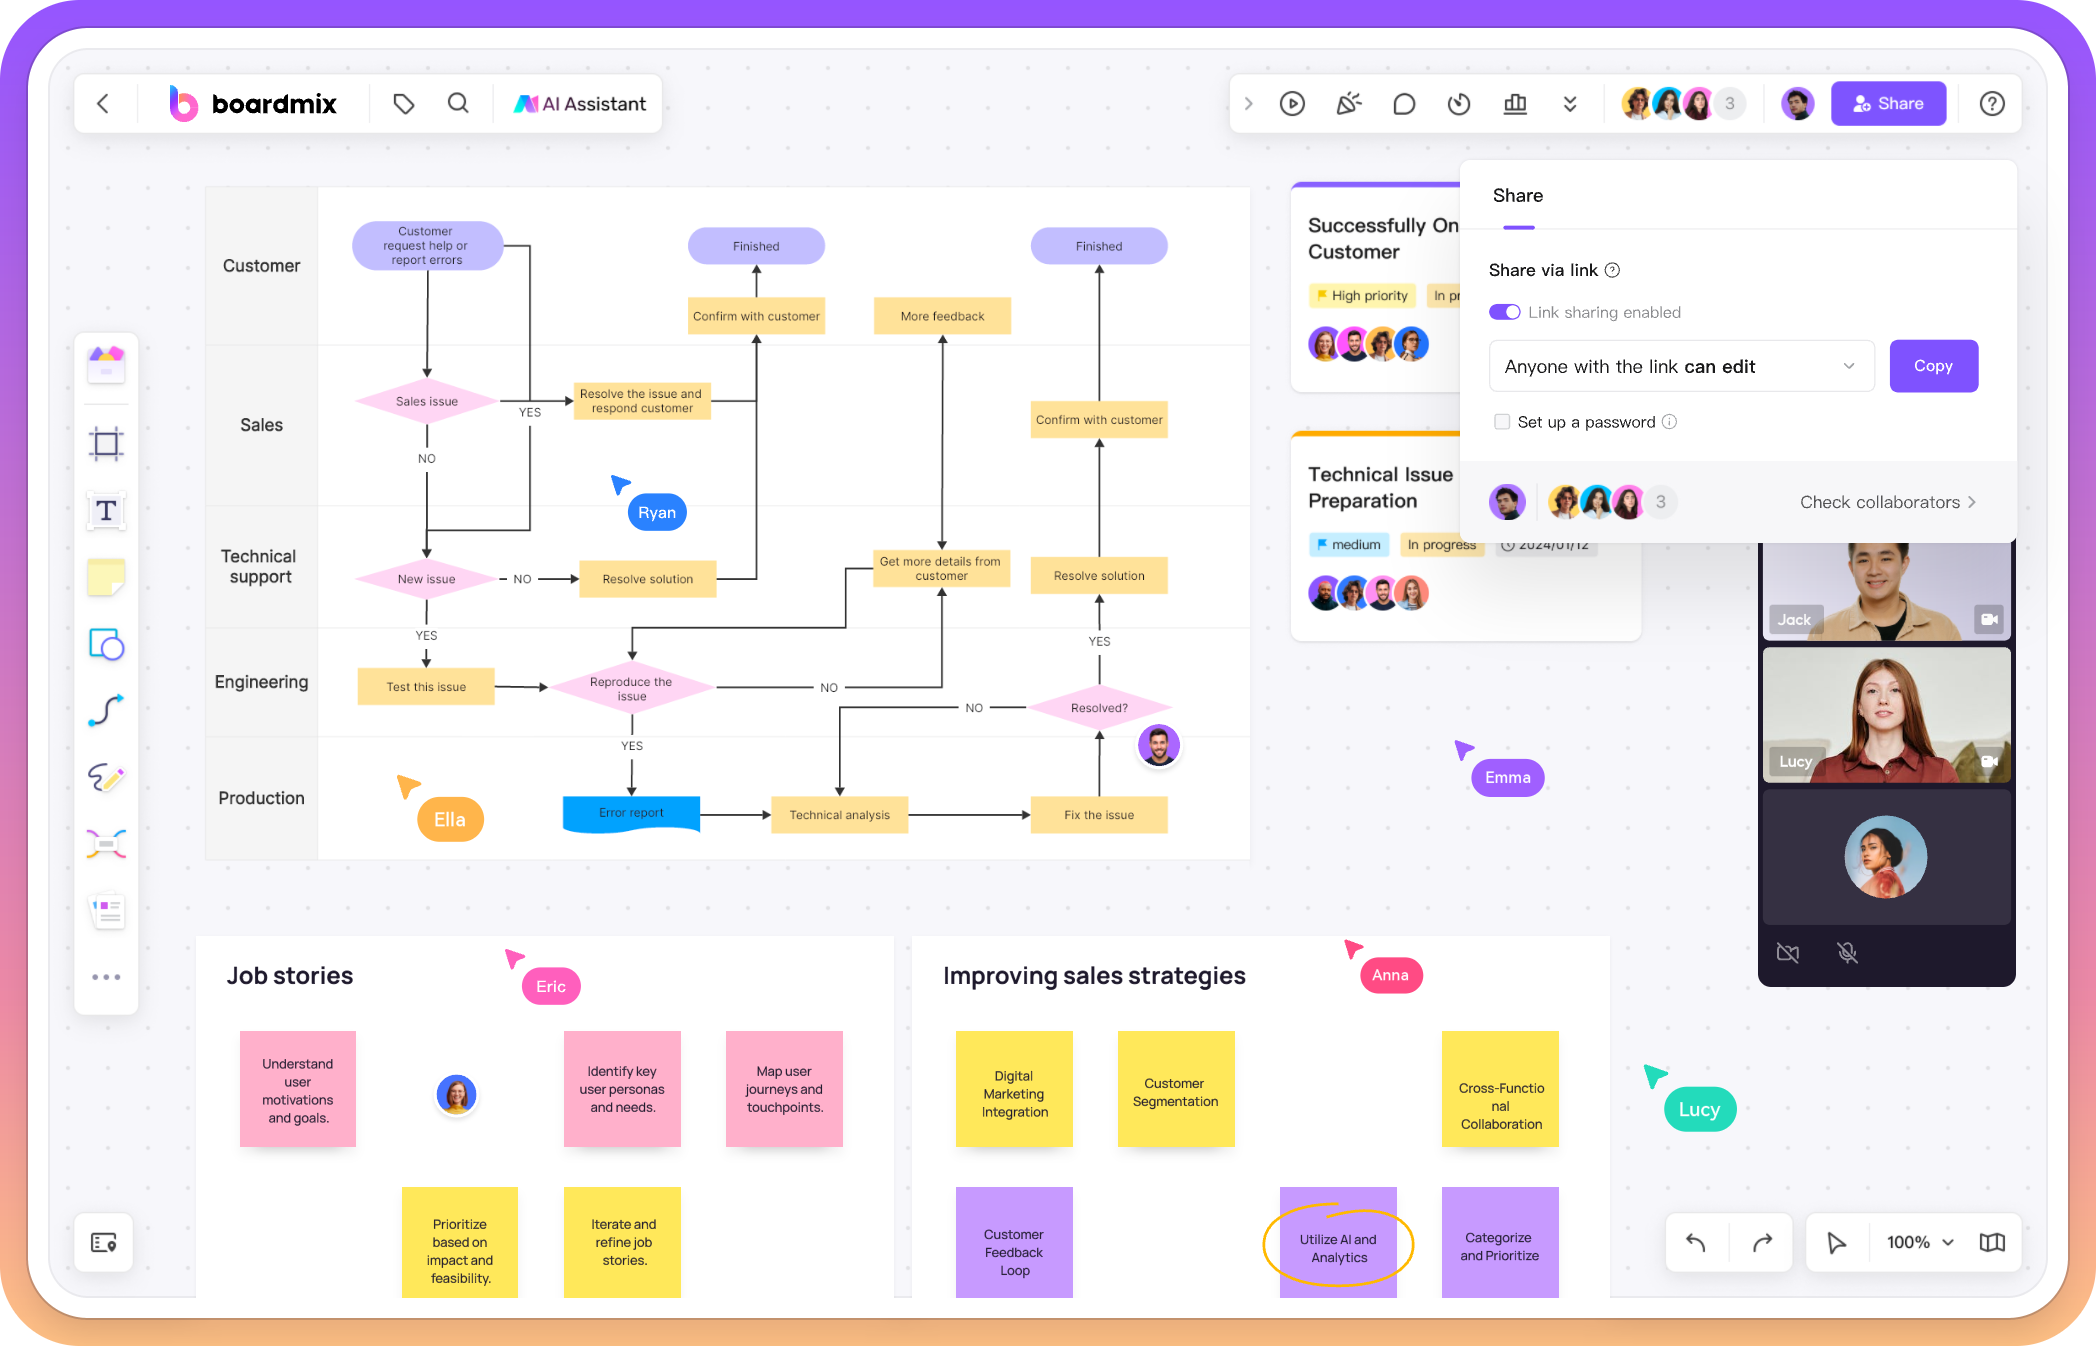
Swimlane Flowchart Maker: Streamline Your Workflows
Explores what swimlane flowcharts are, how to choose the right flowchart maker, and discover the top tools available for creating these diagrams and delves into the process of making a swimlane flowchart on Boardmix.
#Diagram creator
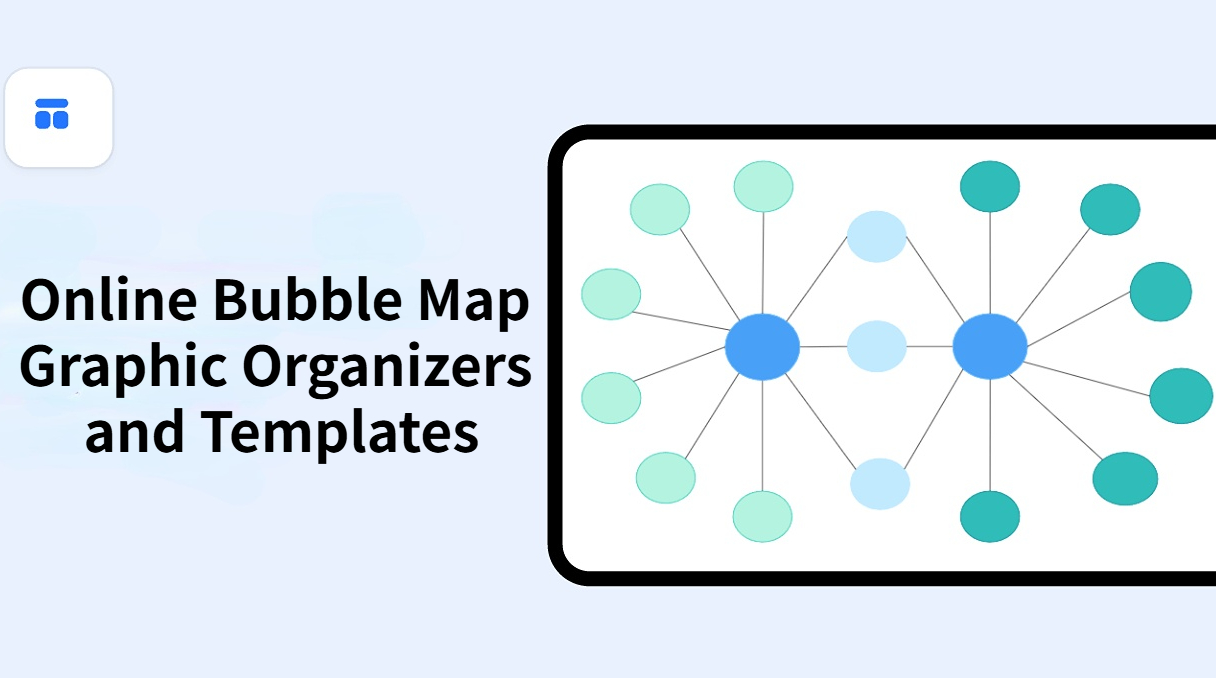
Online Bubble Map Graphic Organizers and Templates
Explore different types of bubble map graphic organizers and how to use them effectively. Learn how to create, customize, and share bubble maps online with Boardmix.
#Diagram creator
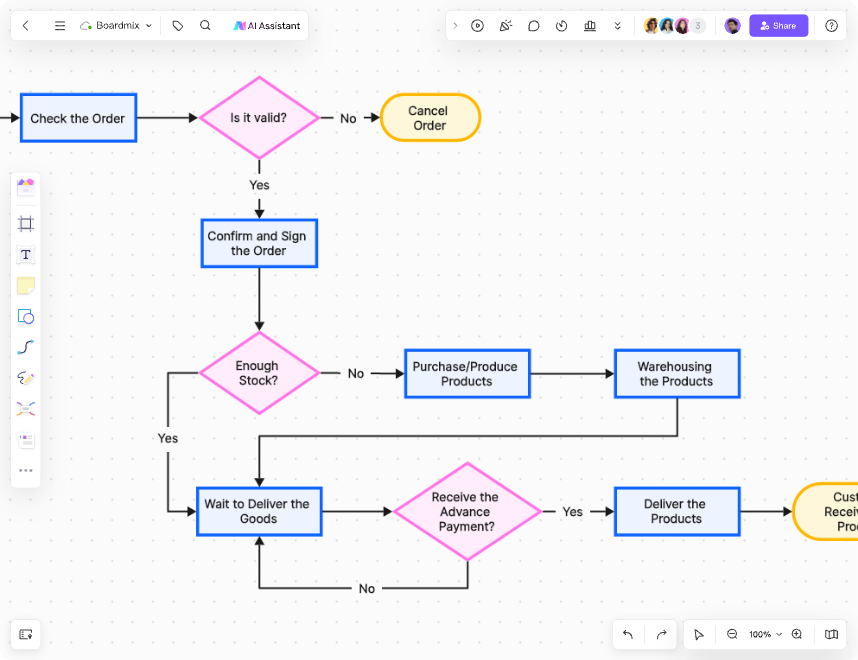
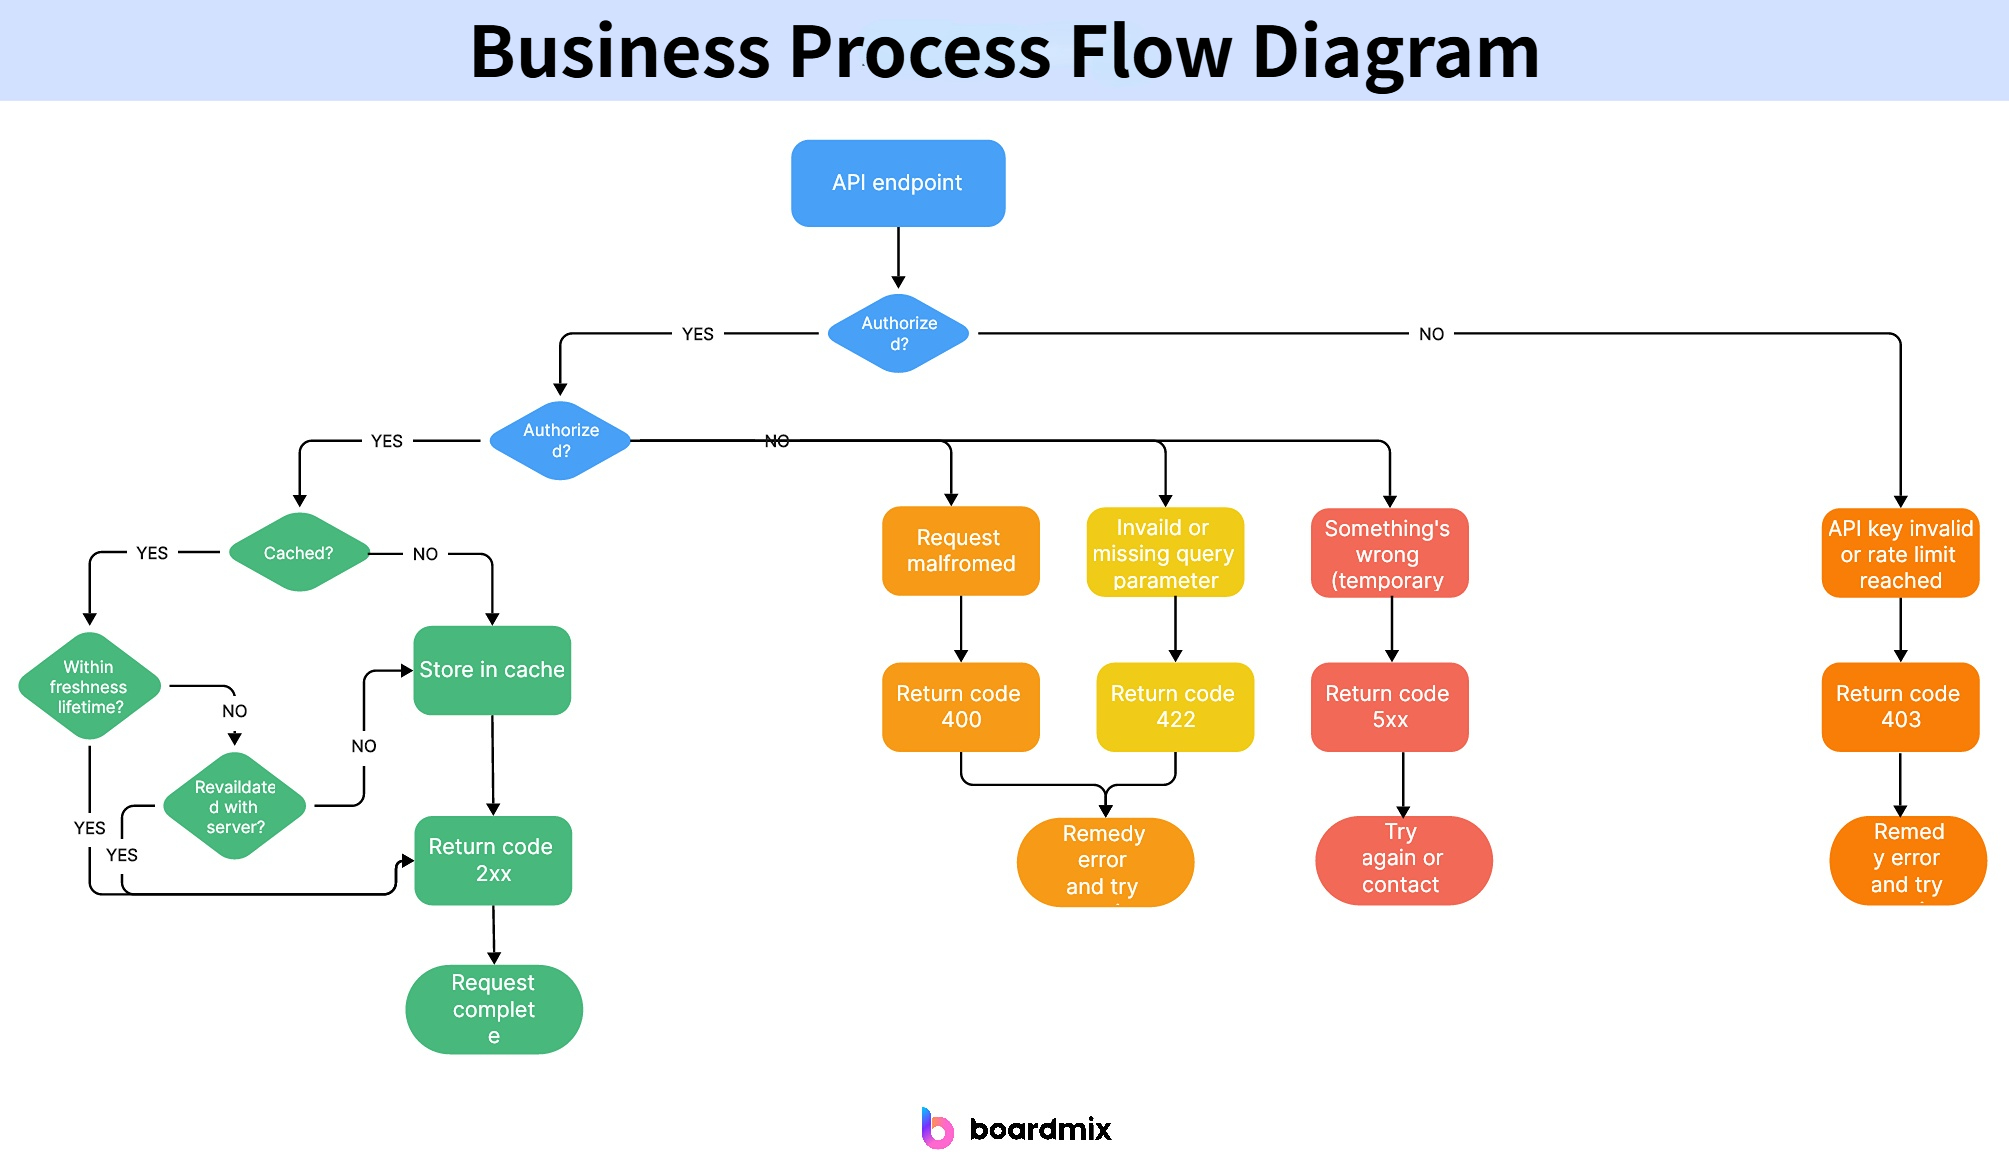
Business Process Flow Diagrams: Examples and Draw Online
Discover how business process flow diagrams can simplify workflows, improve communication, and drive efficiency across industries with practical insights and tools.
#Diagram creator
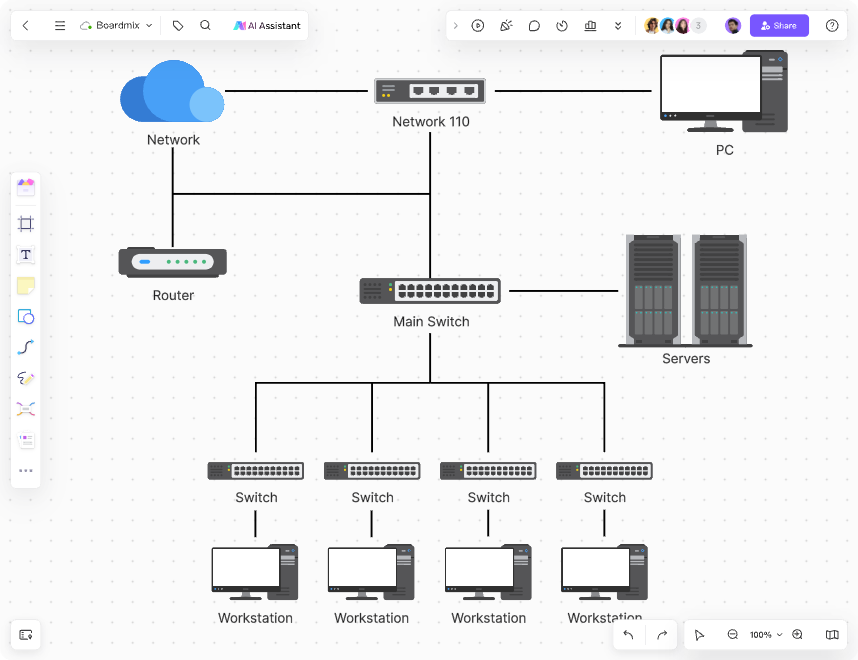
10 Network Diagrams Builders for Optimizing Your Network
Delves into the importance of network diagrams, offers a selection of top network diagram builders, and provides a step-by-step tutorial on using Boardmix to create and optimize network diagrams for improved IT management and network infrastructure planning.
#Diagram creator
Venn Diagram Maker: Create Venn Diagram Easily with It
Create Venn diagrams effortlessly with an intuitive Venn diagram maker. Explore templates, customize designs, and visualize ideas seamlessly!
#Diagram creator
10 Top-Rated Flowchart Software in 2025
Flowchart software is vital for communicating complex ideas through visual diagrams. Read on to know which is best as well as their strengths and weaknesses.

#Diagram creator
How to Easily Create a Visio Flowchart
Flowcharts help to present processes, systems, and other business activities in a visual way. Follow this guide to learn how to easily create a Visio flowchart.

#Diagram creator
Spaghetti Diagram: Definition & Benefits & Examples
#Diagram creator
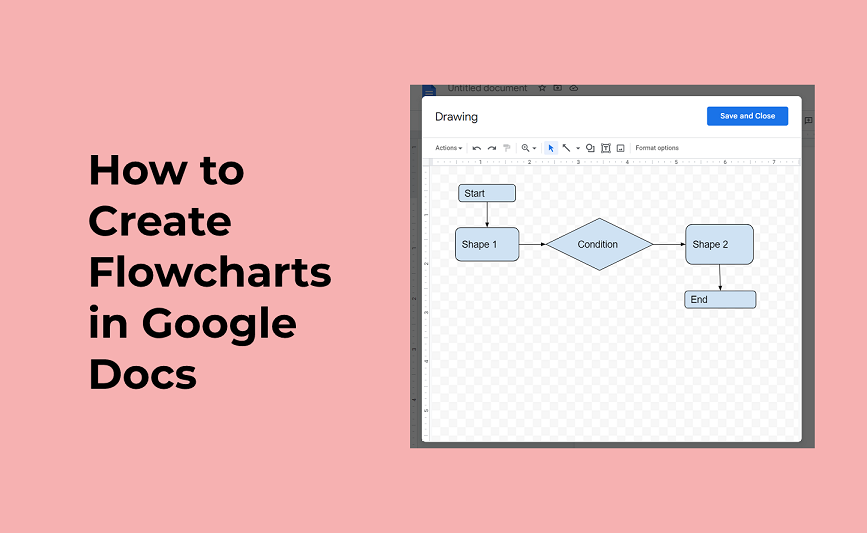
How to Create a Flowchart in Google Docs
#Diagram creator
What Is a Network Diagram in Project Management?
Network diagrams are the most effective approach to demonstrate, convey, and express the links between many activities that may be included in a project.

#Diagram creator
What Is a PERT Diagram
You can draw a PERT chart by hand or use PERT chart software to create visualizations. Boardmix is the software that helps you create PERT charts that helps you to visualize complex projects and improve your team's resource distribution.
![A Comprehensive Guide to the Context Diagram [2023]](https://cms.boardmix.com/images/articles/context-diagram.png)
#Diagram creator
A Comprehensive Guide to the Context Diagram [2023]
Discover how a context diagram can help you in your system’s development. With Boardmix, you can have a context diagram example in minutes.

#Diagram creator
Activity Network Diagram – A Complete Guide
Every project manager knows the significance of the activity network diagram. Create an AON diagram for your project using Boardmix.
#Diagram creator
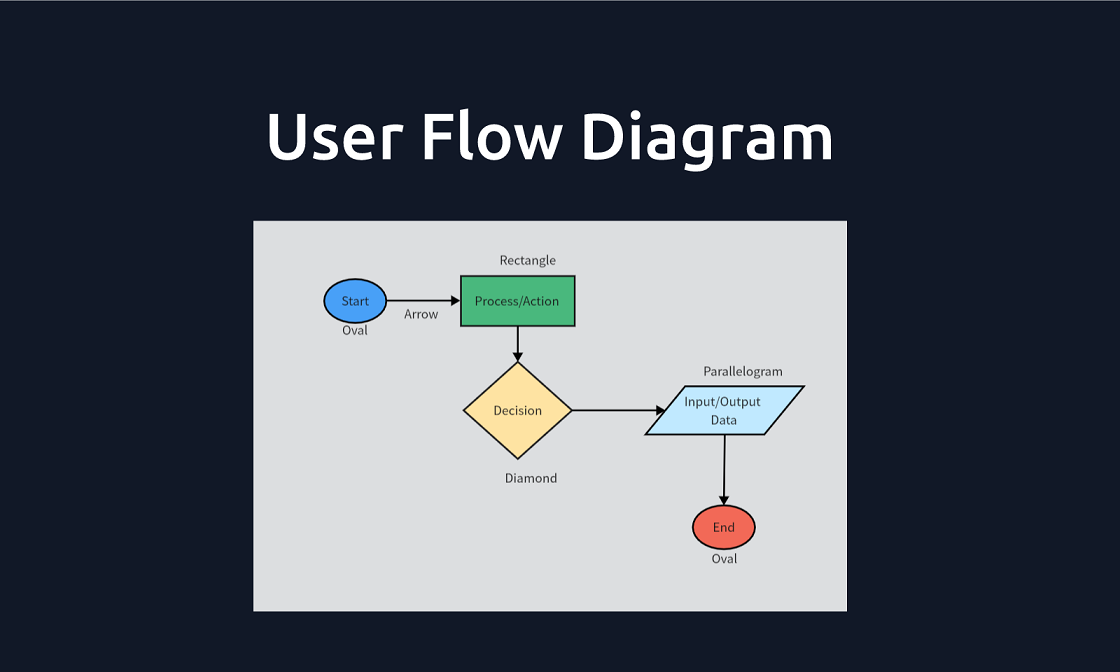
What is a User Flow Diagram and How to Easily Create One?
![[Top List] UML Diagram Tools](https://cms.boardmix.com/images/articles/uml-software.png)
#Diagram creator
[Top List] UML Diagram Tools
A free UML diagram tool enables you to create all the UML diagrams you need for your project. Boardmix is one of the tools that stand out for the task.
![[Full Guide] Collaboration Diagram in UML](https://cms.boardmix.com/images/articles/collaboration-diagram.png)
#Diagram creator
[Full Guide] Collaboration Diagram in UML
A collaboration diagram in UML is a tool that visualizes the relationships between the objects in a system. Boardmix is the best tool to create one.

#Diagram creator
How to Create an Impressive Block Flow Diagram Online
#Diagram creator
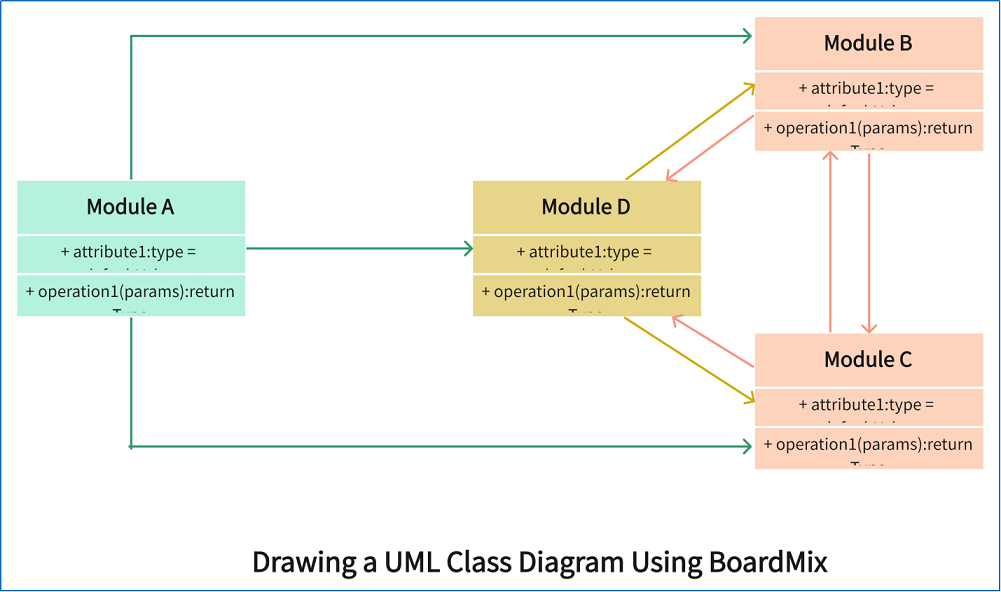
How to Create a Class Diagram Online for Free

#Diagram creator
Make an ER Diagram for Banking System & Databases
![[Newest] How to Create a Flowchart in Word (Microsoft & WPS)](https://cms.boardmix.com/images/articles/flowchart-in-word.png)
#Diagram creator
[Newest] How to Create a Flowchart in Word (Microsoft & WPS)
#Diagram creator
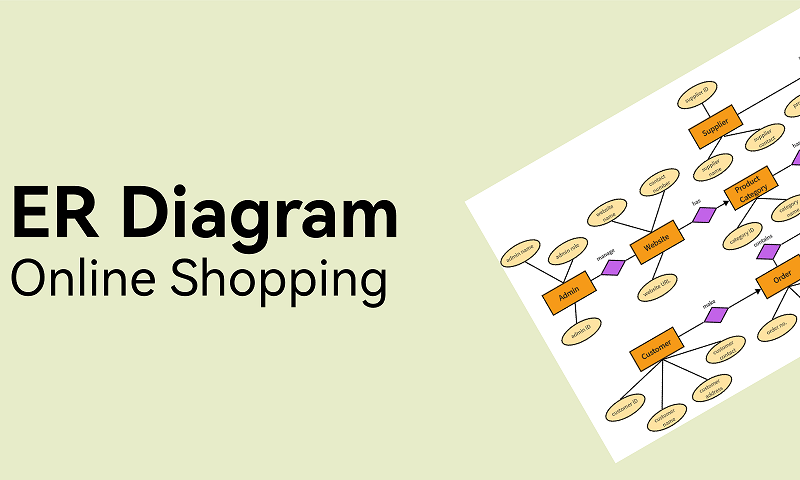
How to Create Free ER Diagram for Online Shopping-Step Guide with Example
E-commerce and online shopping is a rising phenomenon in the modern world and it keeps growing each year. Online businesses looking to maintain an effective information system and manage their day-to-day processes through thorough strategic planning.
#Diagram creator
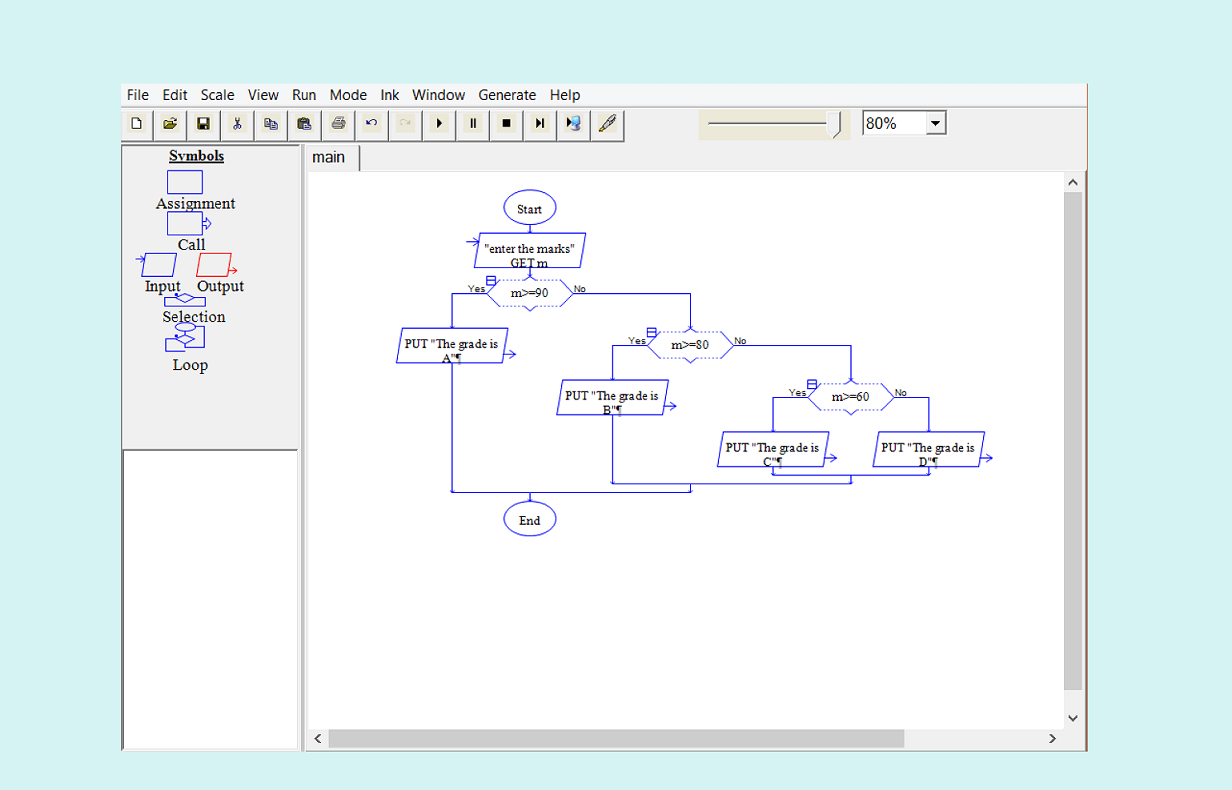
Raptor Flowchart: Everything You Should Know About It
Raptor flowchart is a design-learning environment for programmers to visualize their algorithms. Read this blog to learn how to create a flowchart on Raptor.

#Diagram creator
Sales Process Flowchart: How to Create it with Free Templates
![[2024] What Is the Best Organizational Chart Software](https://cms.boardmix.com/images/image/article-images/best-organizational-chart-software.png)
#Diagram creator
[2024] What Is the Best Organizational Chart Software
An organizational chart software is essential for a company that wants to inform its employees of its structure. Boardmix is the best tool to create org charts.
![[Quick Guide] Interaction Overview Diagram](https://cms.boardmix.com/images/image/article-images/a-quick-guide-to-the-interaction-overview-diagram.png)
#Diagram creator
[Quick Guide] Interaction Overview Diagram
An interaction overview diagram is a type of UML diagram that displays the interactions in your system. Create it with Boardmix without much effort or time.
#Diagram creator
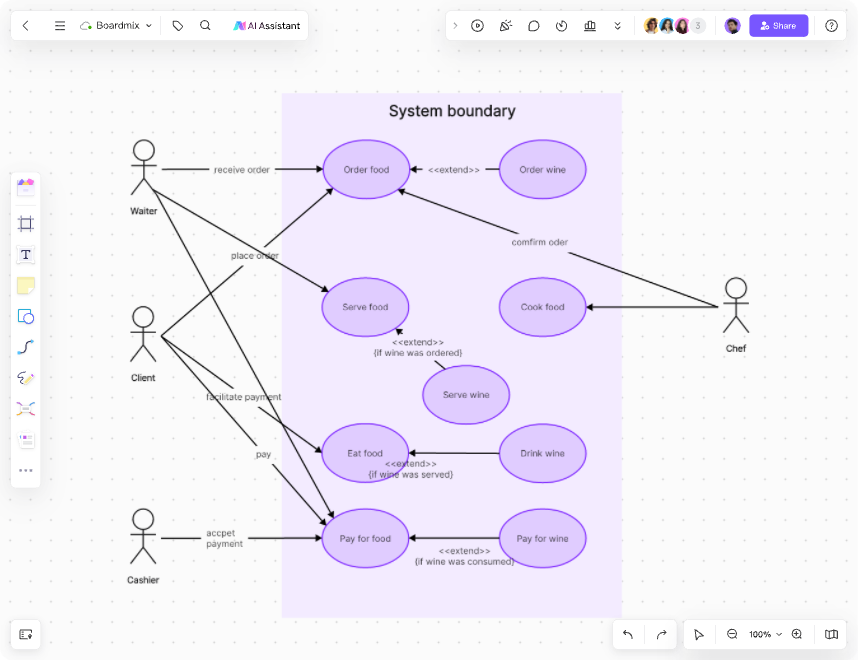
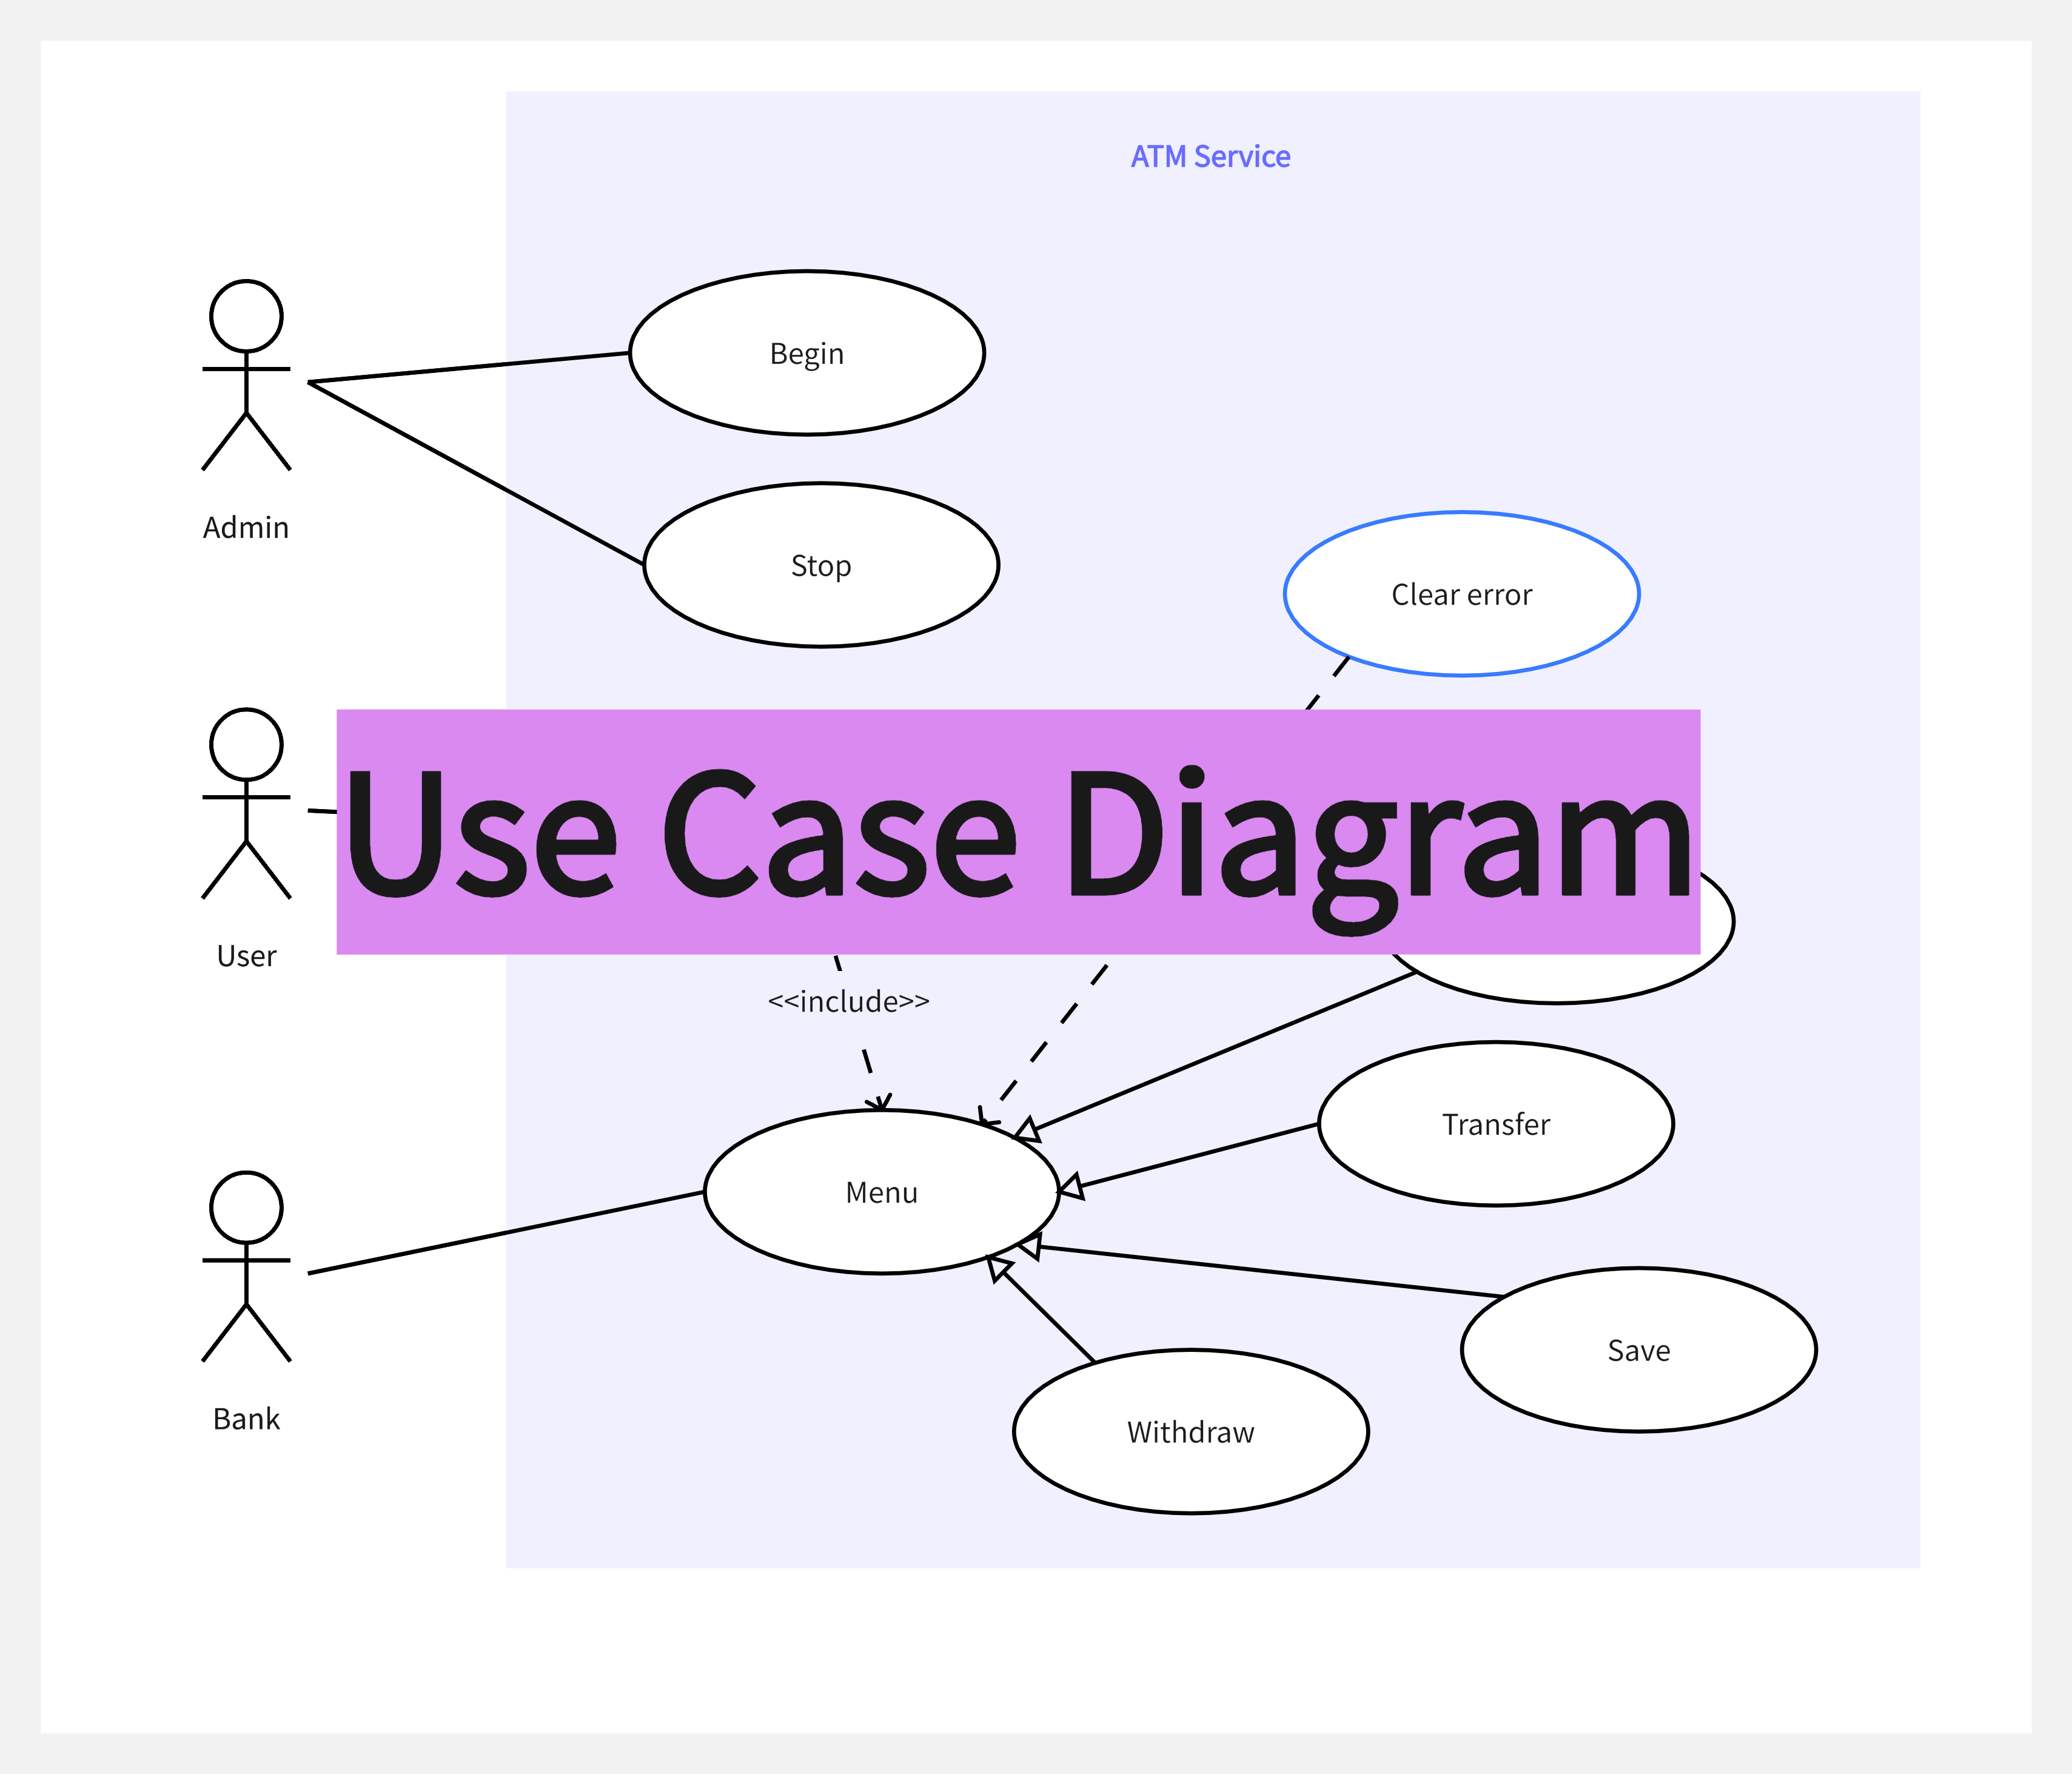
Use Case Diagram – A Quick Guide
The use case diagram is a diagram that shows how each user type interacts with your system. boardmix can help users create an effective use case diagram online.
![[Full Guide] Matrix Diagrams for Data Visualization](https://cms.boardmix.com/images/image/article-images/everything-you-need-to-know-about-matrix-diagram.png)
#Diagram creator
[Full Guide] Matrix Diagrams for Data Visualization
This article introduces everything you need to know about matrix diagrams which can be used for data visualizrion.
![[Must Know] All About Organizational Chart Online](https://cms.boardmix.com/images/image/article-images/all-you-need-to-know-about-organizational-chart.png)
#Diagram creator
[Must Know] All About Organizational Chart Online
Here you can learn almost everything about organizational chart online.
#Diagram creator
Arrow Diagrams: What They Are and How to Use Them
In this post you'll learn everything about arrow diagrams.
#Diagram creator
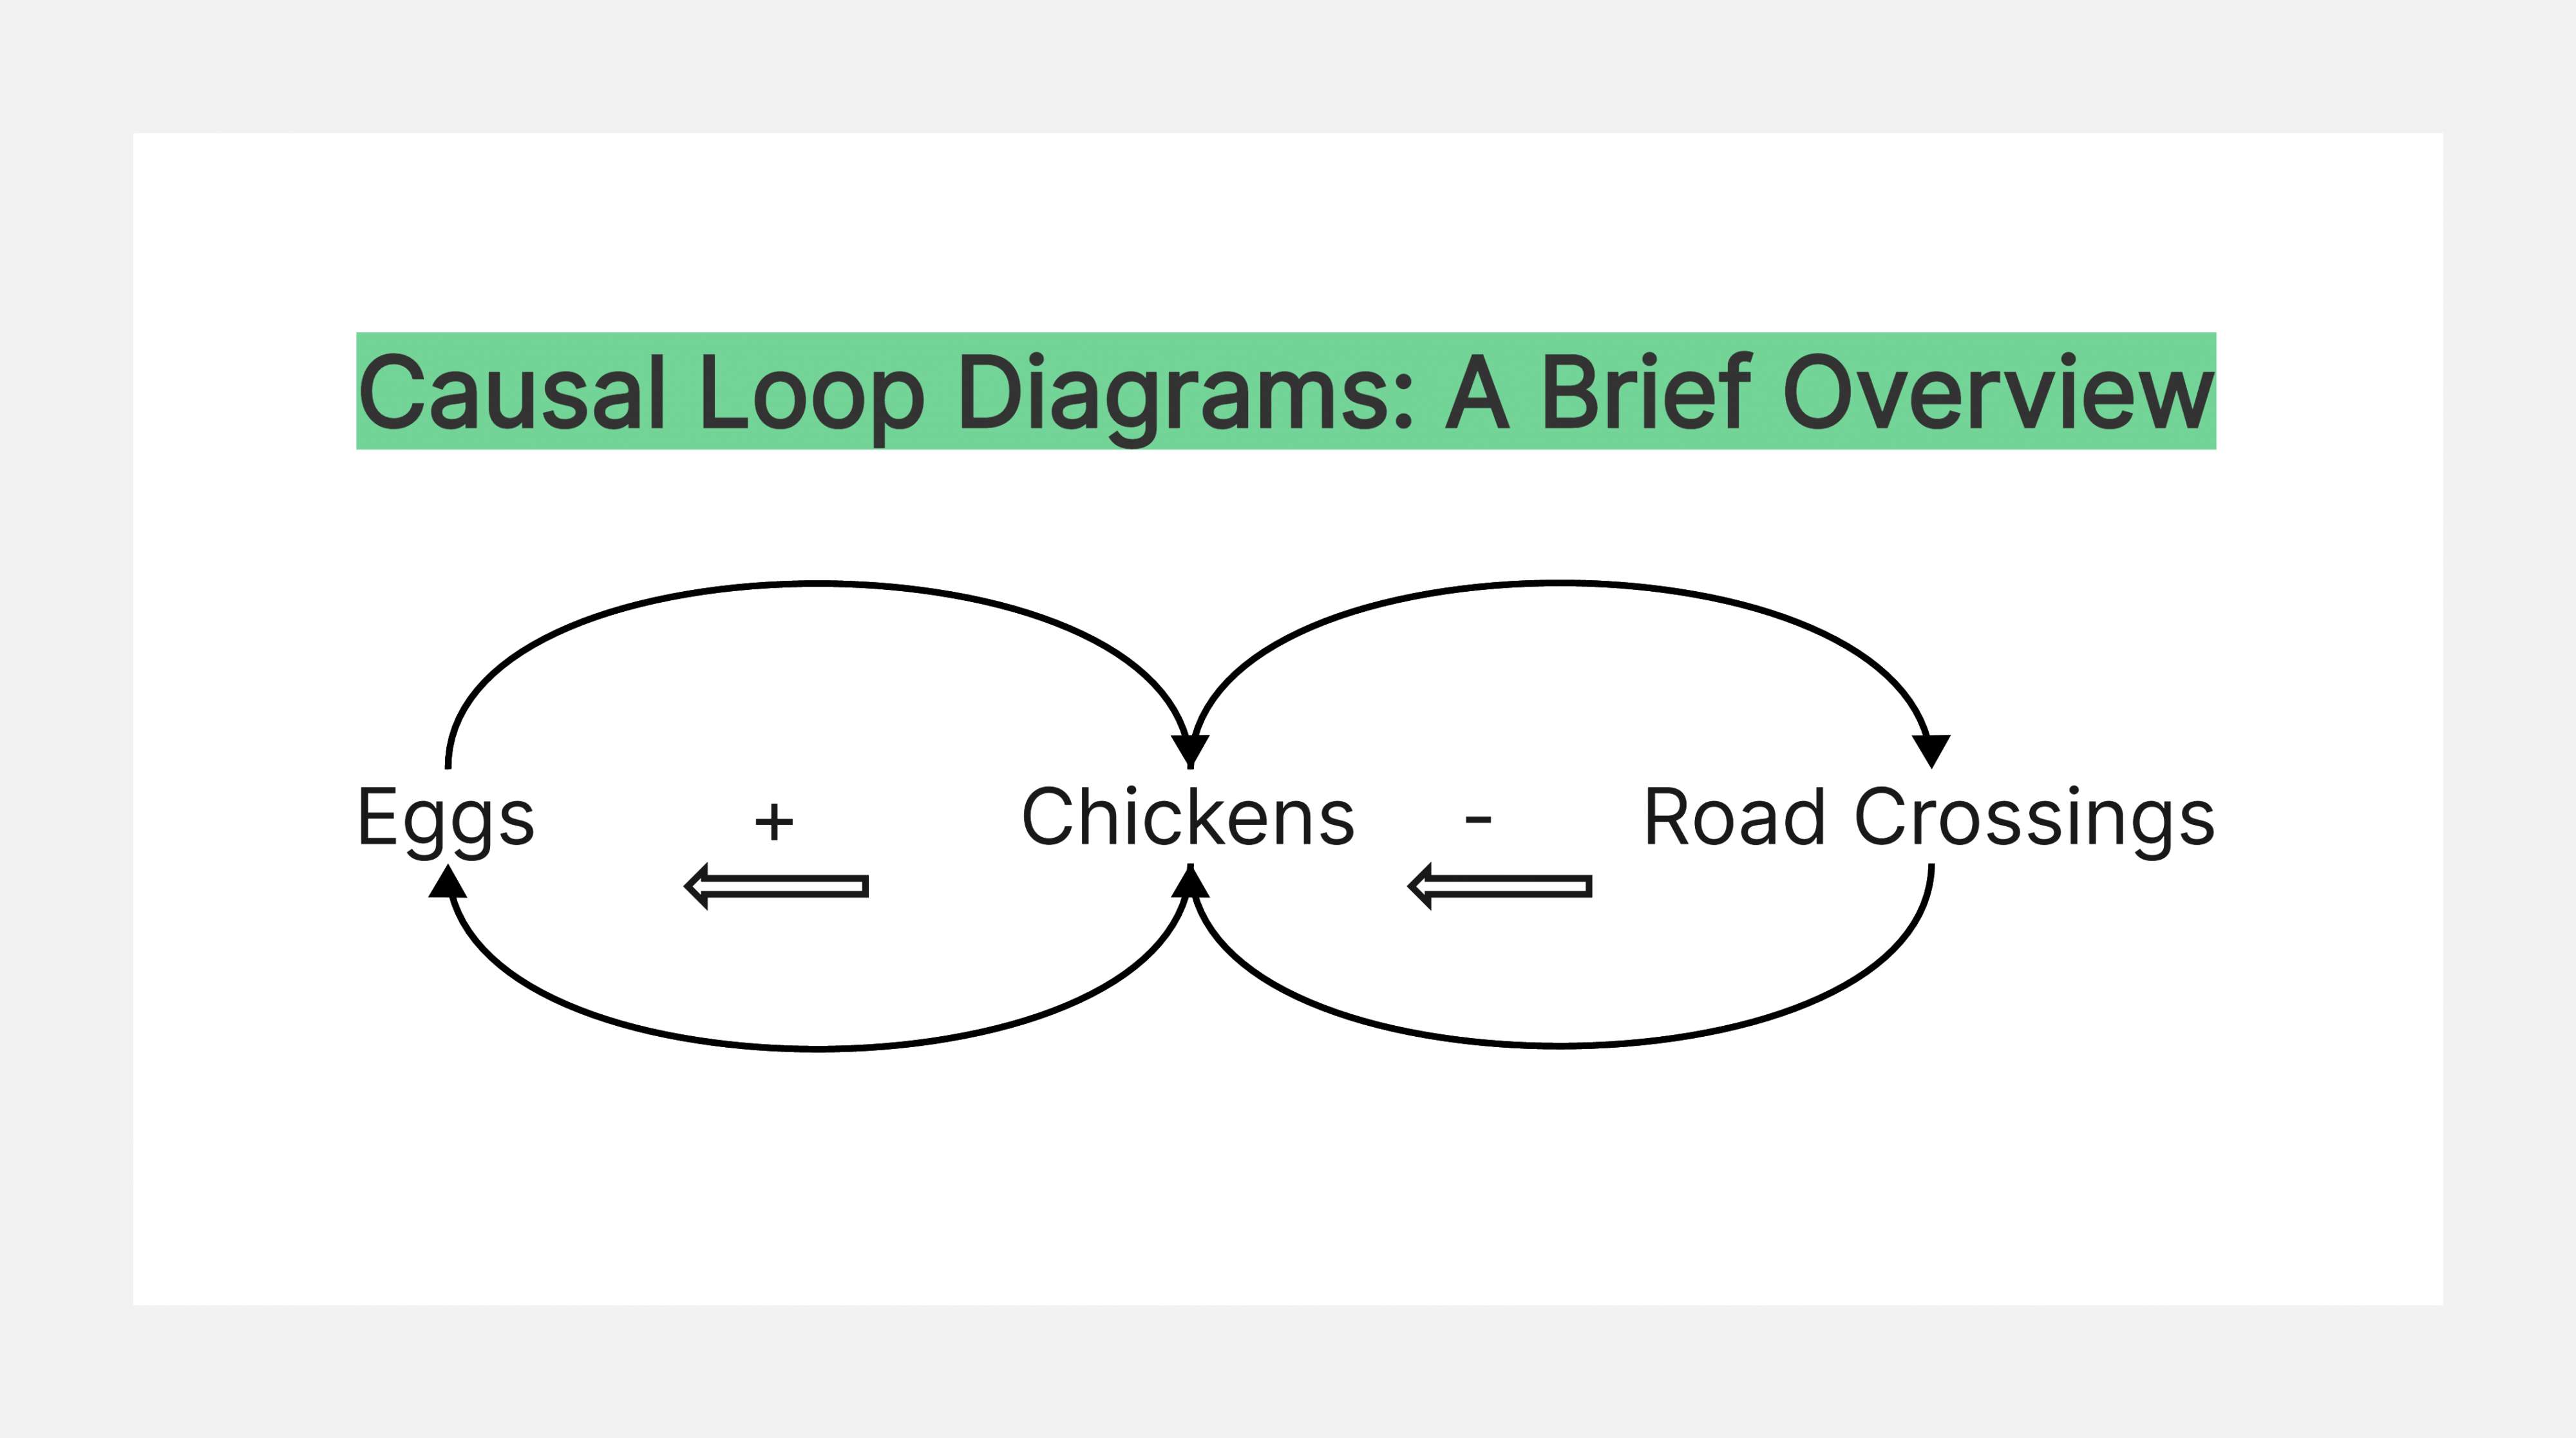
Causal Loop Diagrams: A Brief Overview
Causal loop diagrams are a great way to model complex systems or solve problems. But do you know clearly what is a causal loop diagram? Read on to learn more about this beneficial tool.
![[Full Guide] Cluster Diagram](https://cms.boardmix.com/images/image/article-images/cluster-diagram.png)
#Diagram creator
[Full Guide] Cluster Diagram
Here you can learn everything about cluster diagrams.
![[Quick Guide] Concept Diagrams](https://cms.boardmix.com/images/image/article-images/quick-guide-to-concept-diagrams.png)
#Diagram creator
[Quick Guide] Concept Diagrams
Here you can learn everything about concept diagrams!
![[Full Guide] Communication Diagram](https://cms.boardmix.com/images/image/article-images/everything-about-communication-diagram.png)
#Diagram creator
[Full Guide] Communication Diagram
Here you can learn everything you need to know about communication diagram.
![[Full Guide] System Diagrams: Definition, Example & Free Tool to Draw One](https://cms.boardmix.com/images/image/article-images/everything-about-system-diagram.png)
#Diagram creator
[Full Guide] System Diagrams: Definition, Example & Free Tool to Draw One
Want to learn more about system diagrams? Here’s a quick system diagram guide to help you visualize and organize your ideas!
#Diagram creator
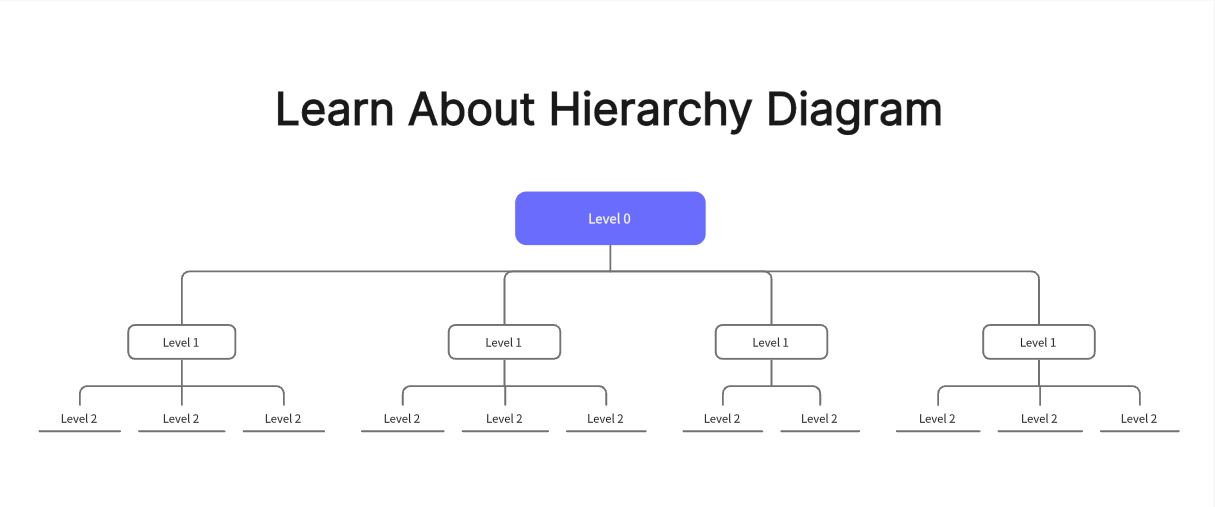
Learn About Hierarchy Diagram
Here you can learn almost everything about hierarchy diagram.
#Diagram creator
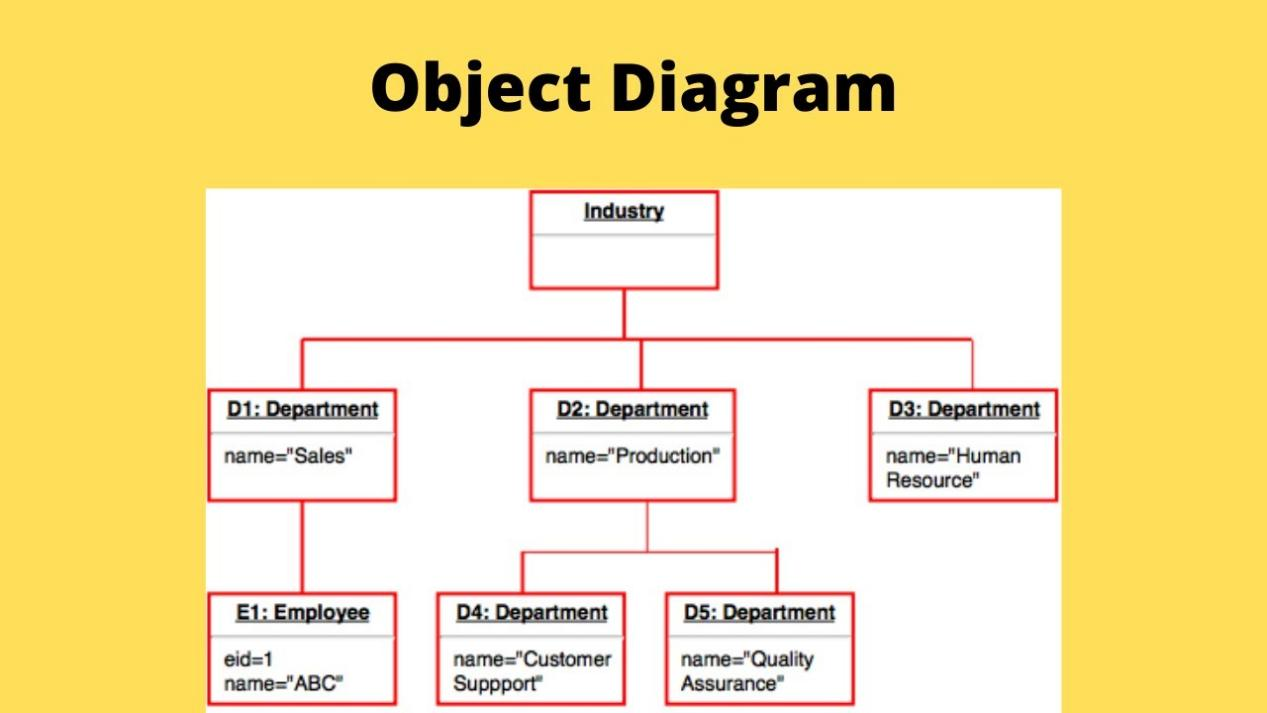
Object Diagram: What You Need to Know
In this article, you'll learn everything necessary about object diagrams!
#Diagram creator
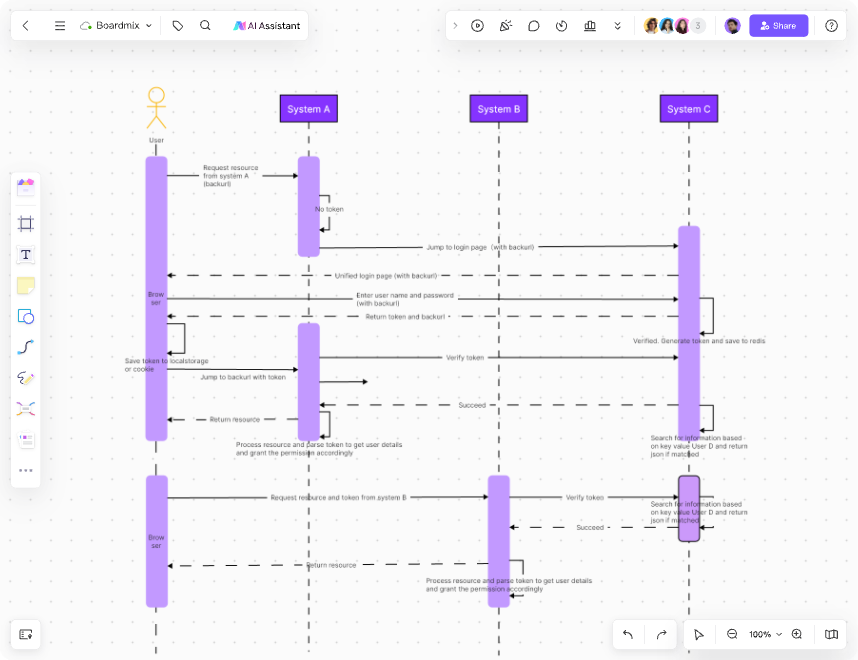
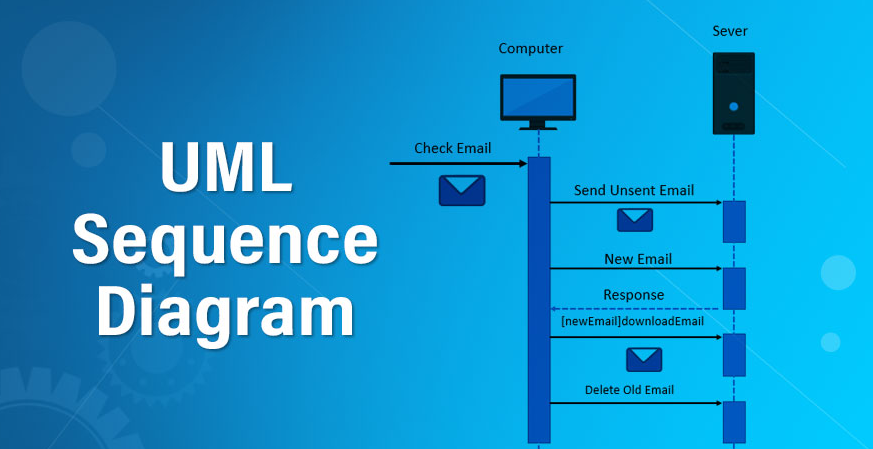
Sequence Diagram: A Complete Guide to Visualizing Process Flows
Here you can learn almost everything about sequence diagrams. Dive into the comprehensive guide to Sequence Diagrams, the ultimate tool for visualizing process flows. Learn how these diagrams can simplify complex processes, enhance understanding, and streamline project execution.
![[Quick Guide] Spider Diagram](https://cms.boardmix.com/images/image/article-images/what-is-spider-diagram.png)
#Diagram creator
[Quick Guide] Spider Diagram
Here you can learn everything necessary about spider diagram.
#Diagram creator
Activity Diagram: What Is It and How to Draw One?
Here you can learn everything about the activity diagram.
#Diagram creator
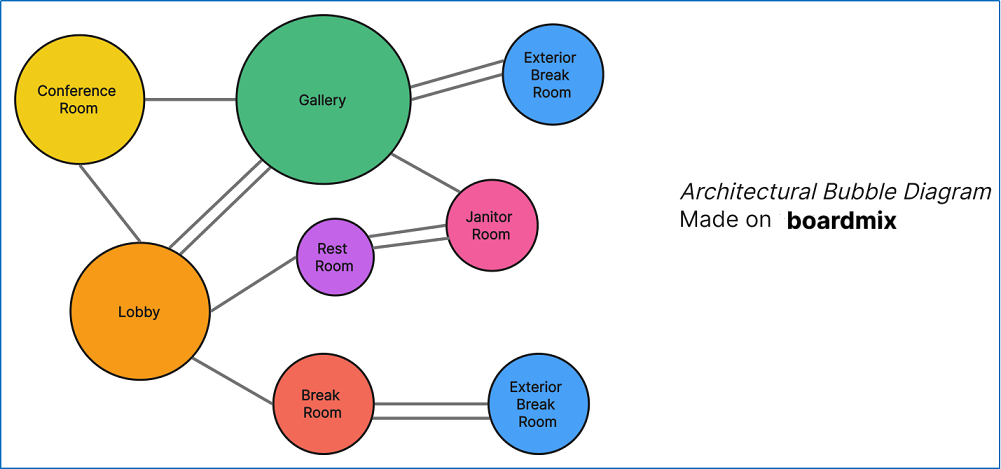
Bubble Diagram in Architecture: How to Create One with a Free Online Tool
Learn what the bubble diagram is and what its significance in architecture is. You can make these diagrams with boardmix, an online architecture diagrams maker.
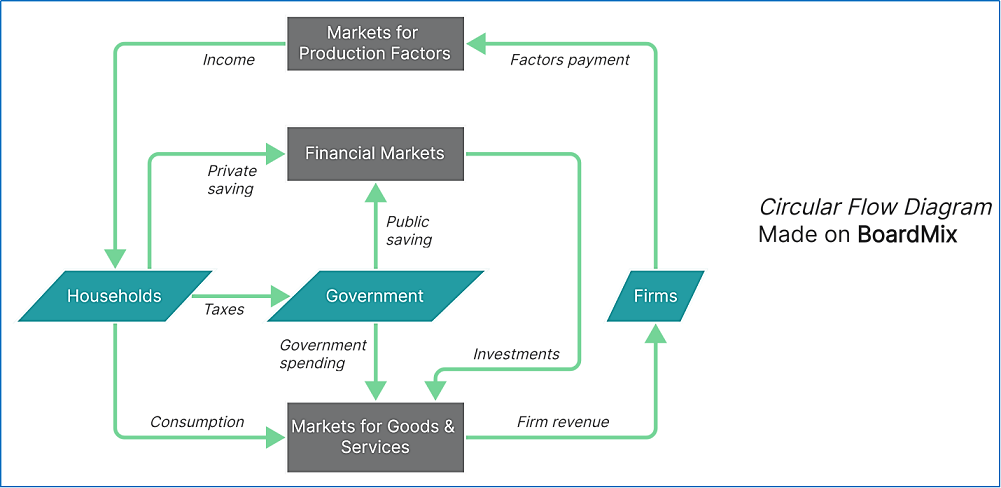
#Diagram creator
Understanding the Circular Flow Diagram – with Example
![[Newest] How to Create a Flowchart in Excel (MS Office and WPS)](https://cms.boardmix.com/images/article-image/create-flowchart-in-excel.png)
#Diagram creator
[Newest] How to Create a Flowchart in Excel (MS Office and WPS)
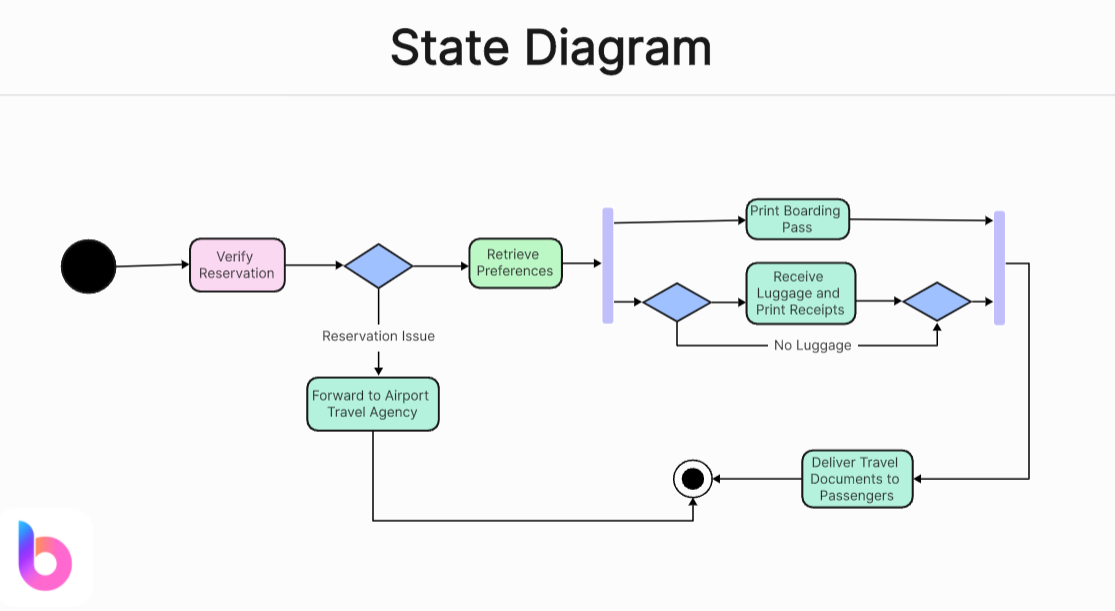
![A Comprehensive Guide to State Diagram [2023]](https://cms.boardmix.com/images/articles/state-diagram-cover.png)
#Diagram creator
A Comprehensive Guide to State Diagram [2023]
A state diagram is a UML diagram that focuses on a system’s states. Use boardmix to create an effective state diagram online with the rest of your team.
#Diagram creator
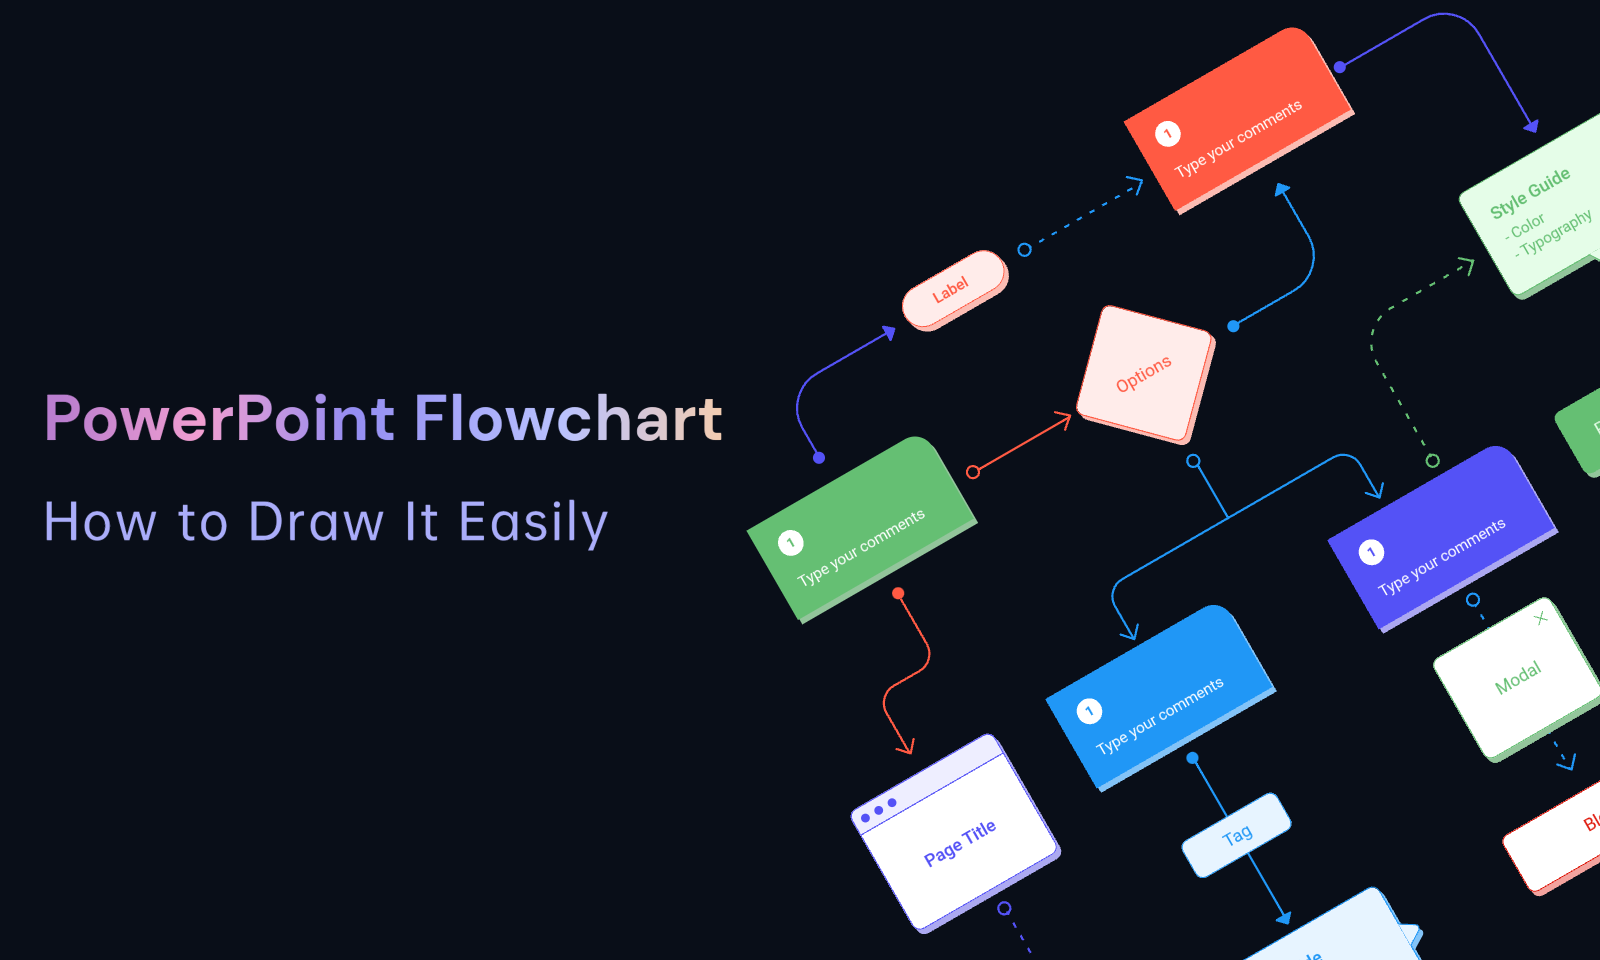
PowerPoint Flowchart - How to Draw It Easily
A PowerPoint flowchart is used in many presentations to show the flow of a computer system or process. You can now create better flowcharts with Boardmix.
![How to Draw a Figma Flowchart [Plus an Alternative]](https://cms.boardmix.com/images/articles/figma-flow-chart.png)
#Diagram creator
How to Draw a Figma Flowchart [Plus an Alternative]
With a Figma flowchart, you can visually show the flow within a system or process. You can also create effective flowcharts in boardmix.
#Diagram creator
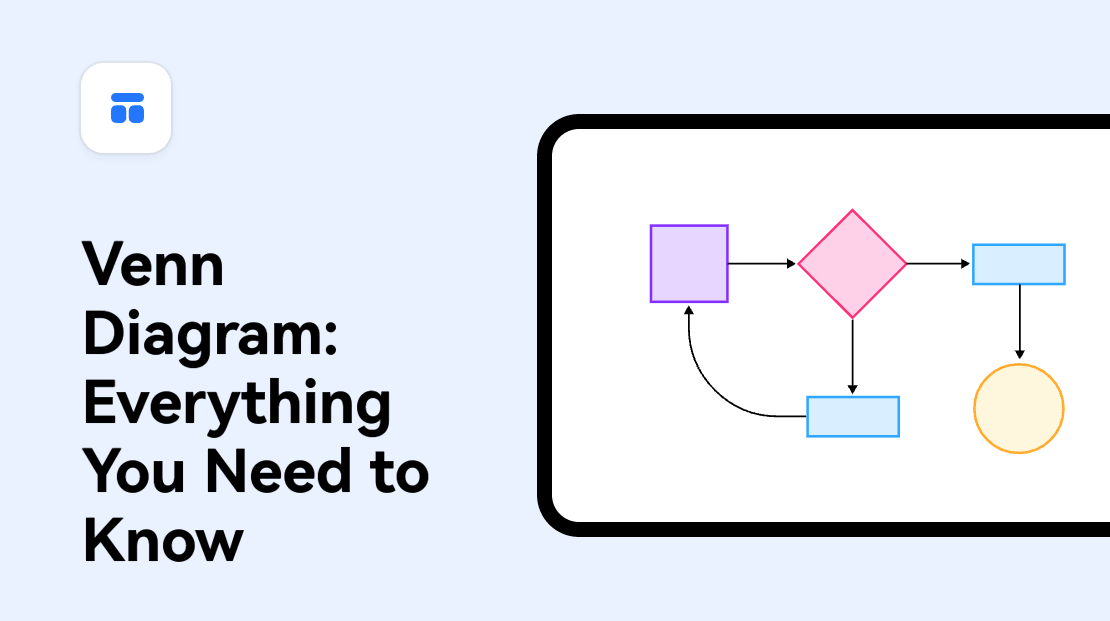
Venn Diagram: Everything You Need to Know
Discover the power of Venn diagrams - your ultimate guide to understanding this visual tool, its history, uses, and benefits.
#Diagram creator
Top Finds of Ideal Tree Diagram Makers
In this article, you'll learn about 8 top-notch tree diagram makers. Choose any one of them based on your needs!
#Diagram creator
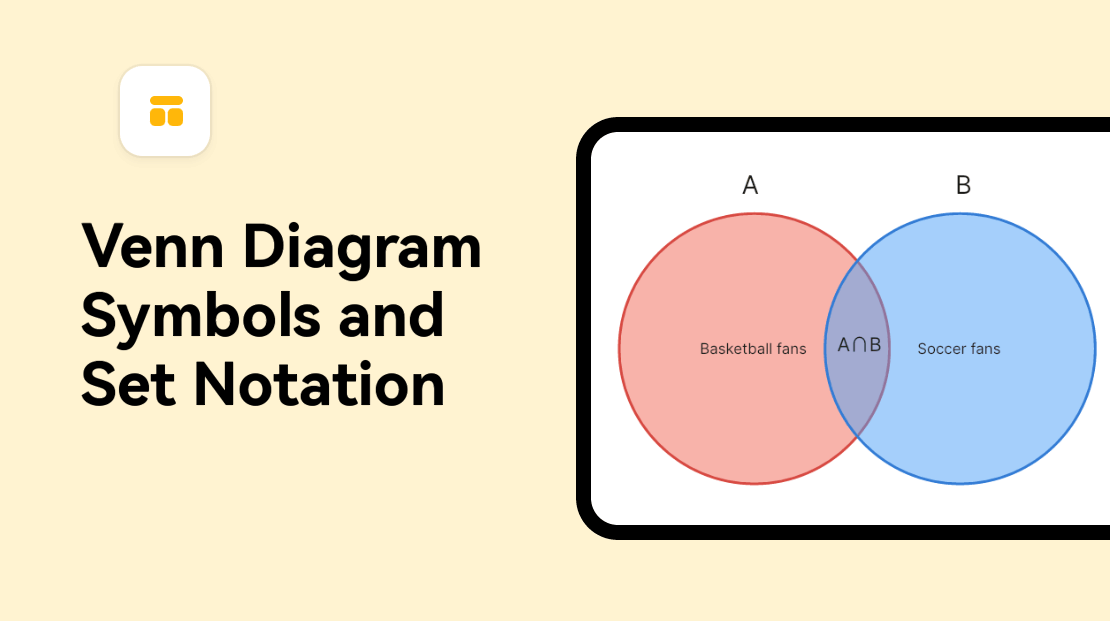
Venn Diagram Symbols and Set Notation
Establish concise relationships between different sets of items through Venn diagram symbols and assess whether the things are connected in some ways.
![Flowchart Symbols Guide [With Templates]](https://cms.boardmix.com/images/articles/flowchart-symbols-cheatsheet.png)
#Diagram creator
Flowchart Symbols Guide [With Templates]
Represent the details on your flowchart properly with flowchart symbols. This is to make sure the direction of the processes in the diagram is straightforward.
#Diagram creator
Swimlane Diagram: Everything You Need to Know
Develop a swimlane flowchart to get a better visual overview of the team’s organizational roles and identify bottlenecks head-on to streamline processes.
#Diagram creator
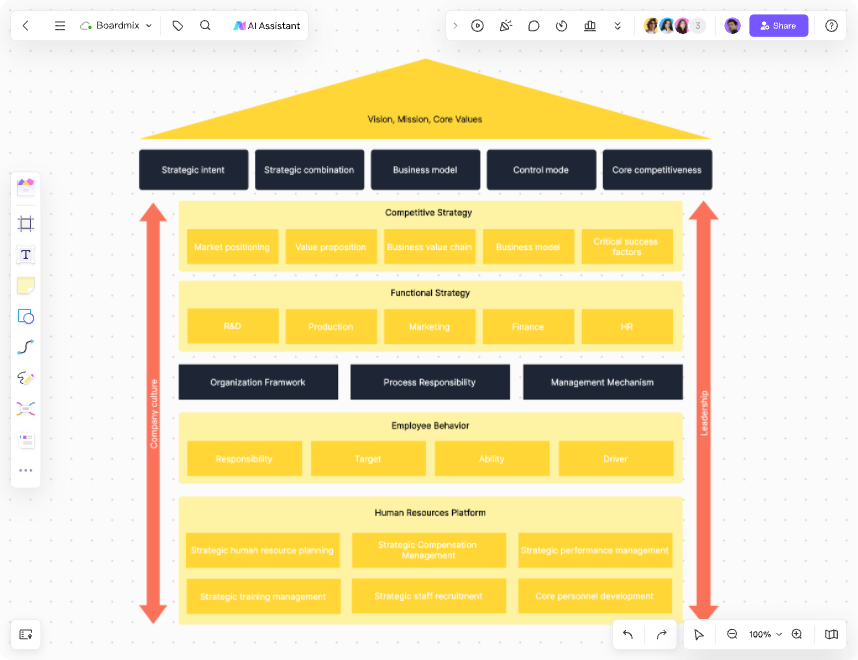
8 Types of Organizational Structures for Businesses
A clear organizational structure is vital for business success, with types varying based on size, nature, and goals.
#Diagram creator
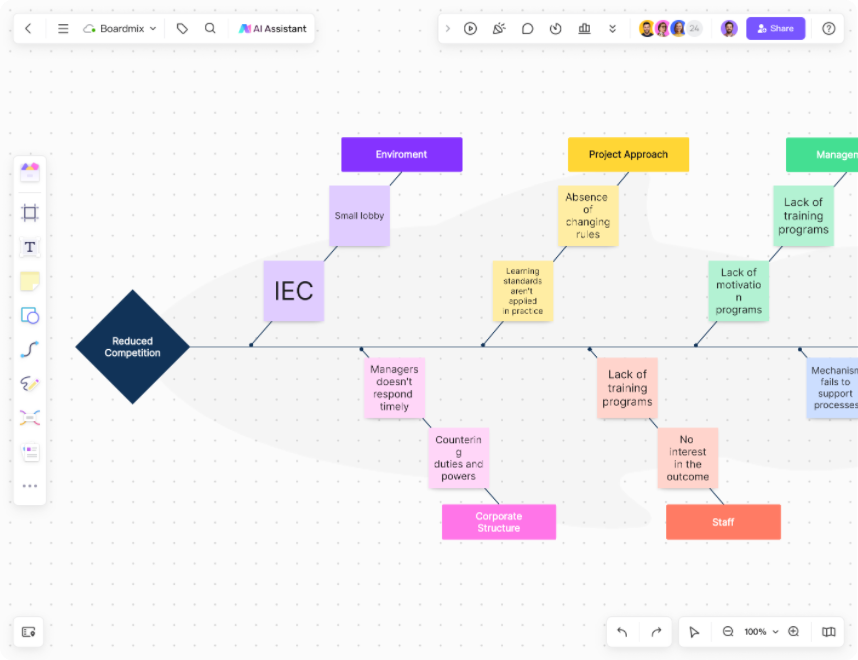
Fishbone Diagram Creators: A Comparison of the Top 6 Options
Looking for an online fishbone creator? Here are the 6 best fishbone diagram creators to make problem-solving more efficient.
#Diagram creator
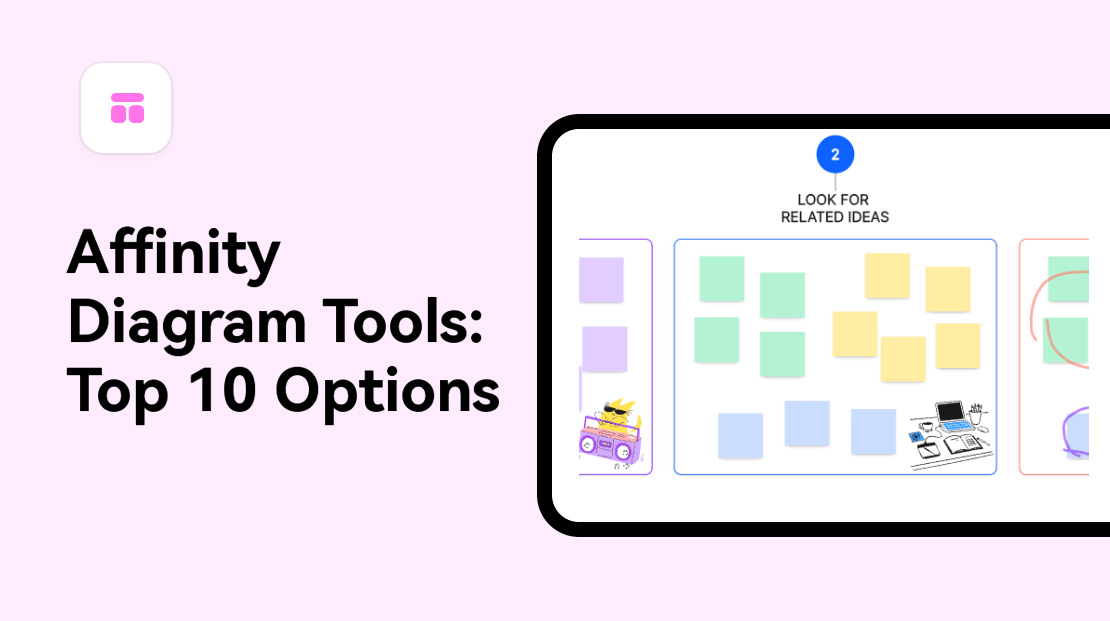
Affinity Diagram Tools: A Comparison of the Top 10 Options
Choosing the right affinity diagram tool for your business is quite easy. Check out the following 10 affinity diagram tools to get you started.
#Diagram creator
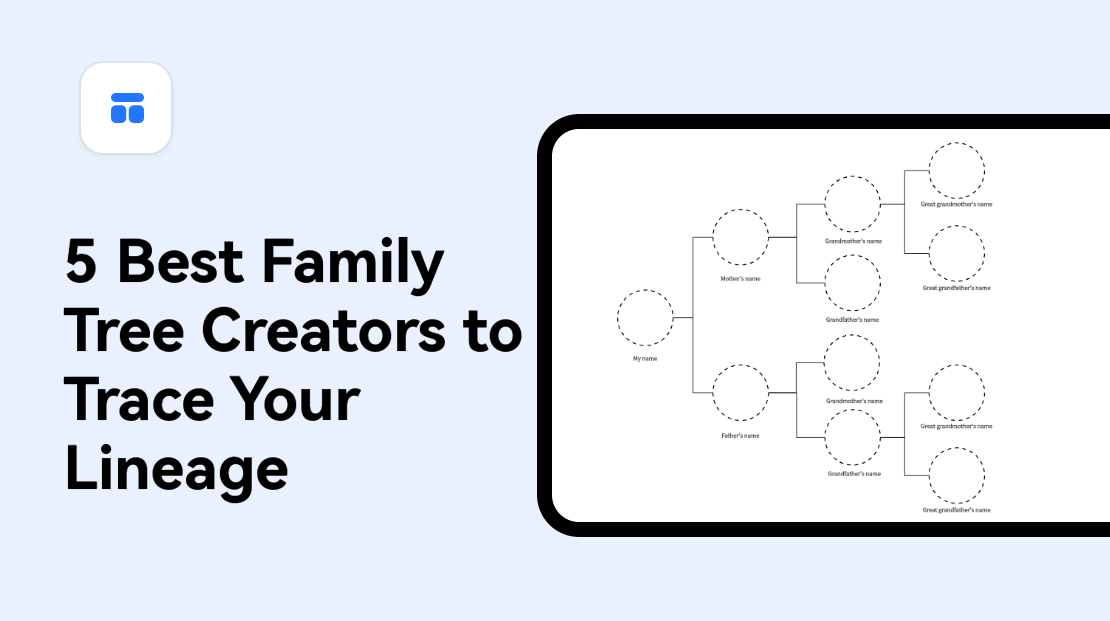
5 Best Family Tree Creators to Trace Your Lineage
Looking to make a family tree? Here are 5 best family tree builders that make it fast and easy to create one.
#Diagram creator
Choosing the Right Block Diagram Maker for You: A Review of 8 Popular Options
Looking to make a block diagram? Here are 8 popular block diagram makers that will help you understand your system’s functions.

#Diagram creator
5 Top-Rated Enterprise Workflow Software
Do you need the best enterprise workflow management tool? Here is a list of 5 top-rated enterprise workflow software for managing key business processes.